District in Ede
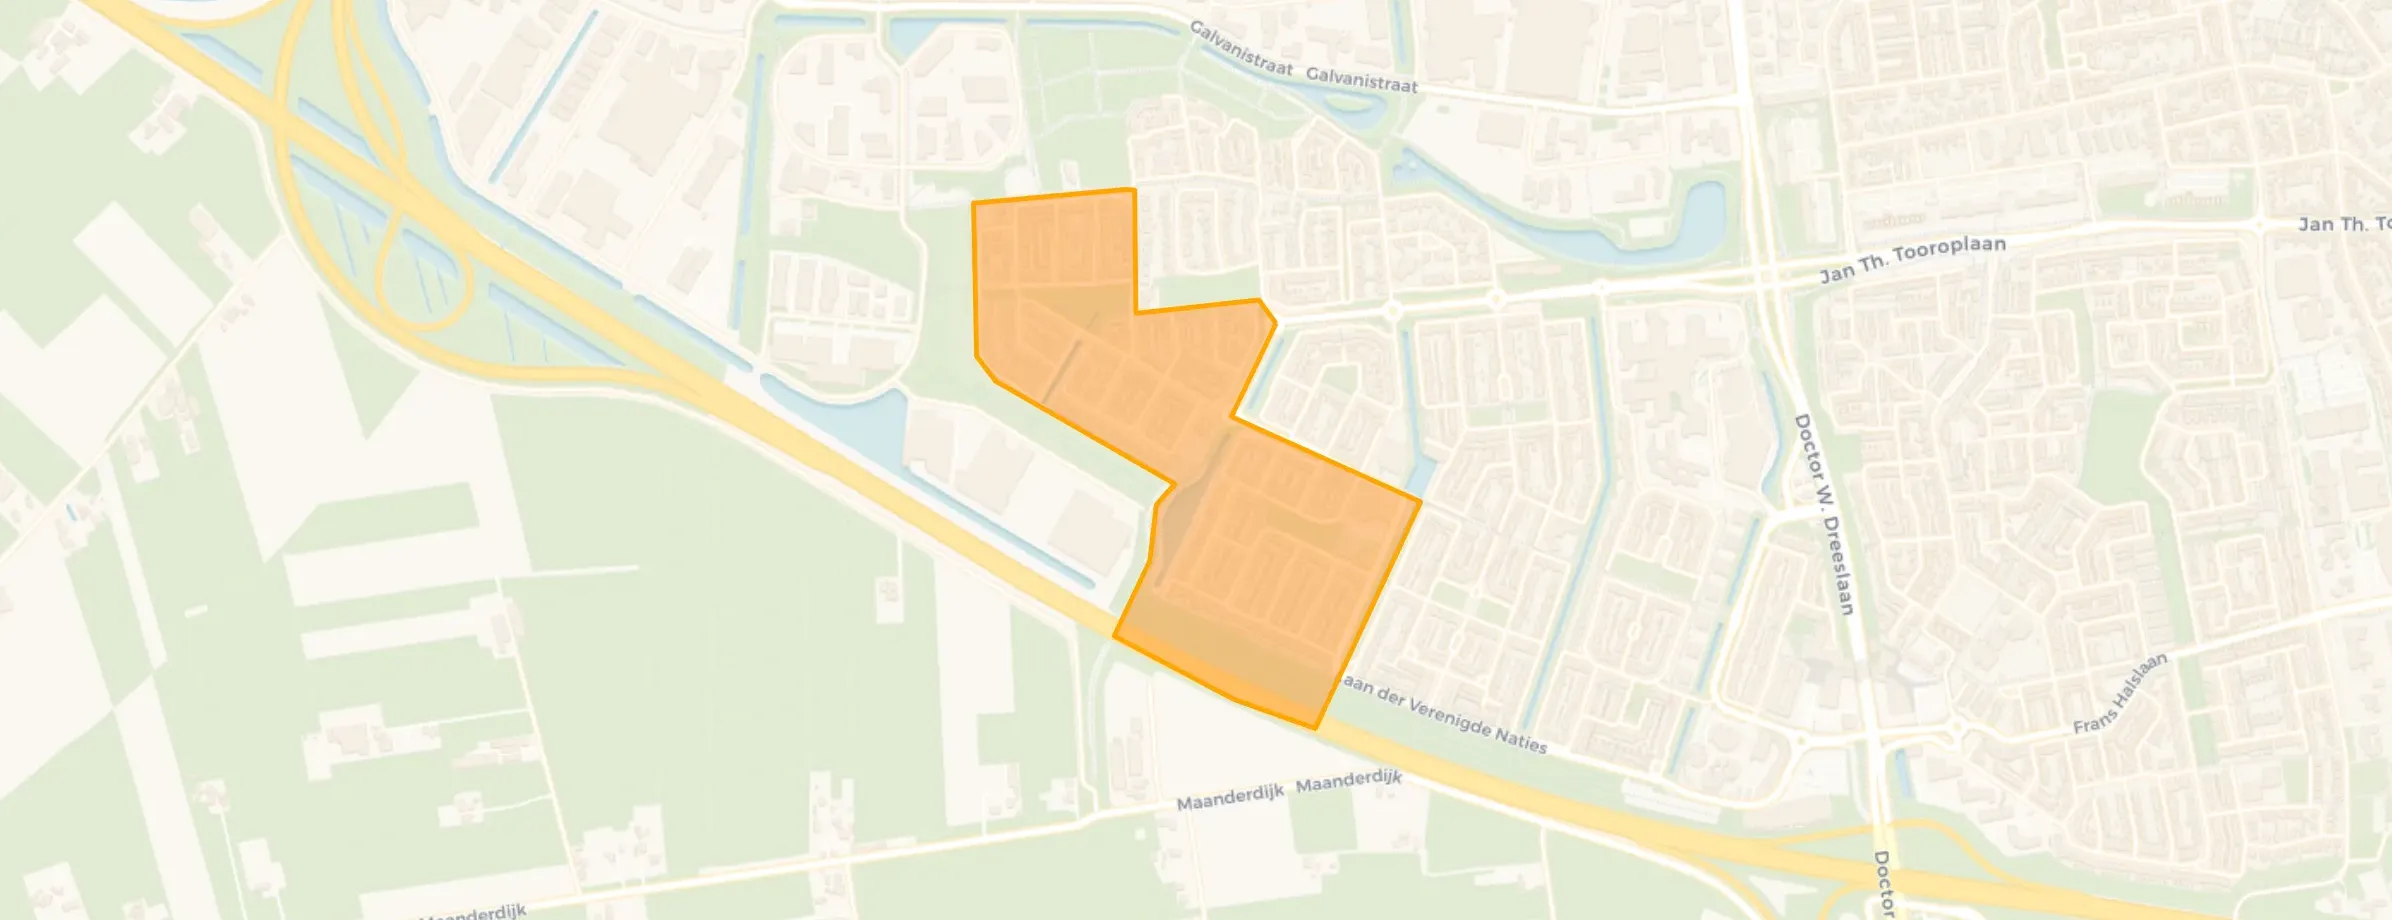
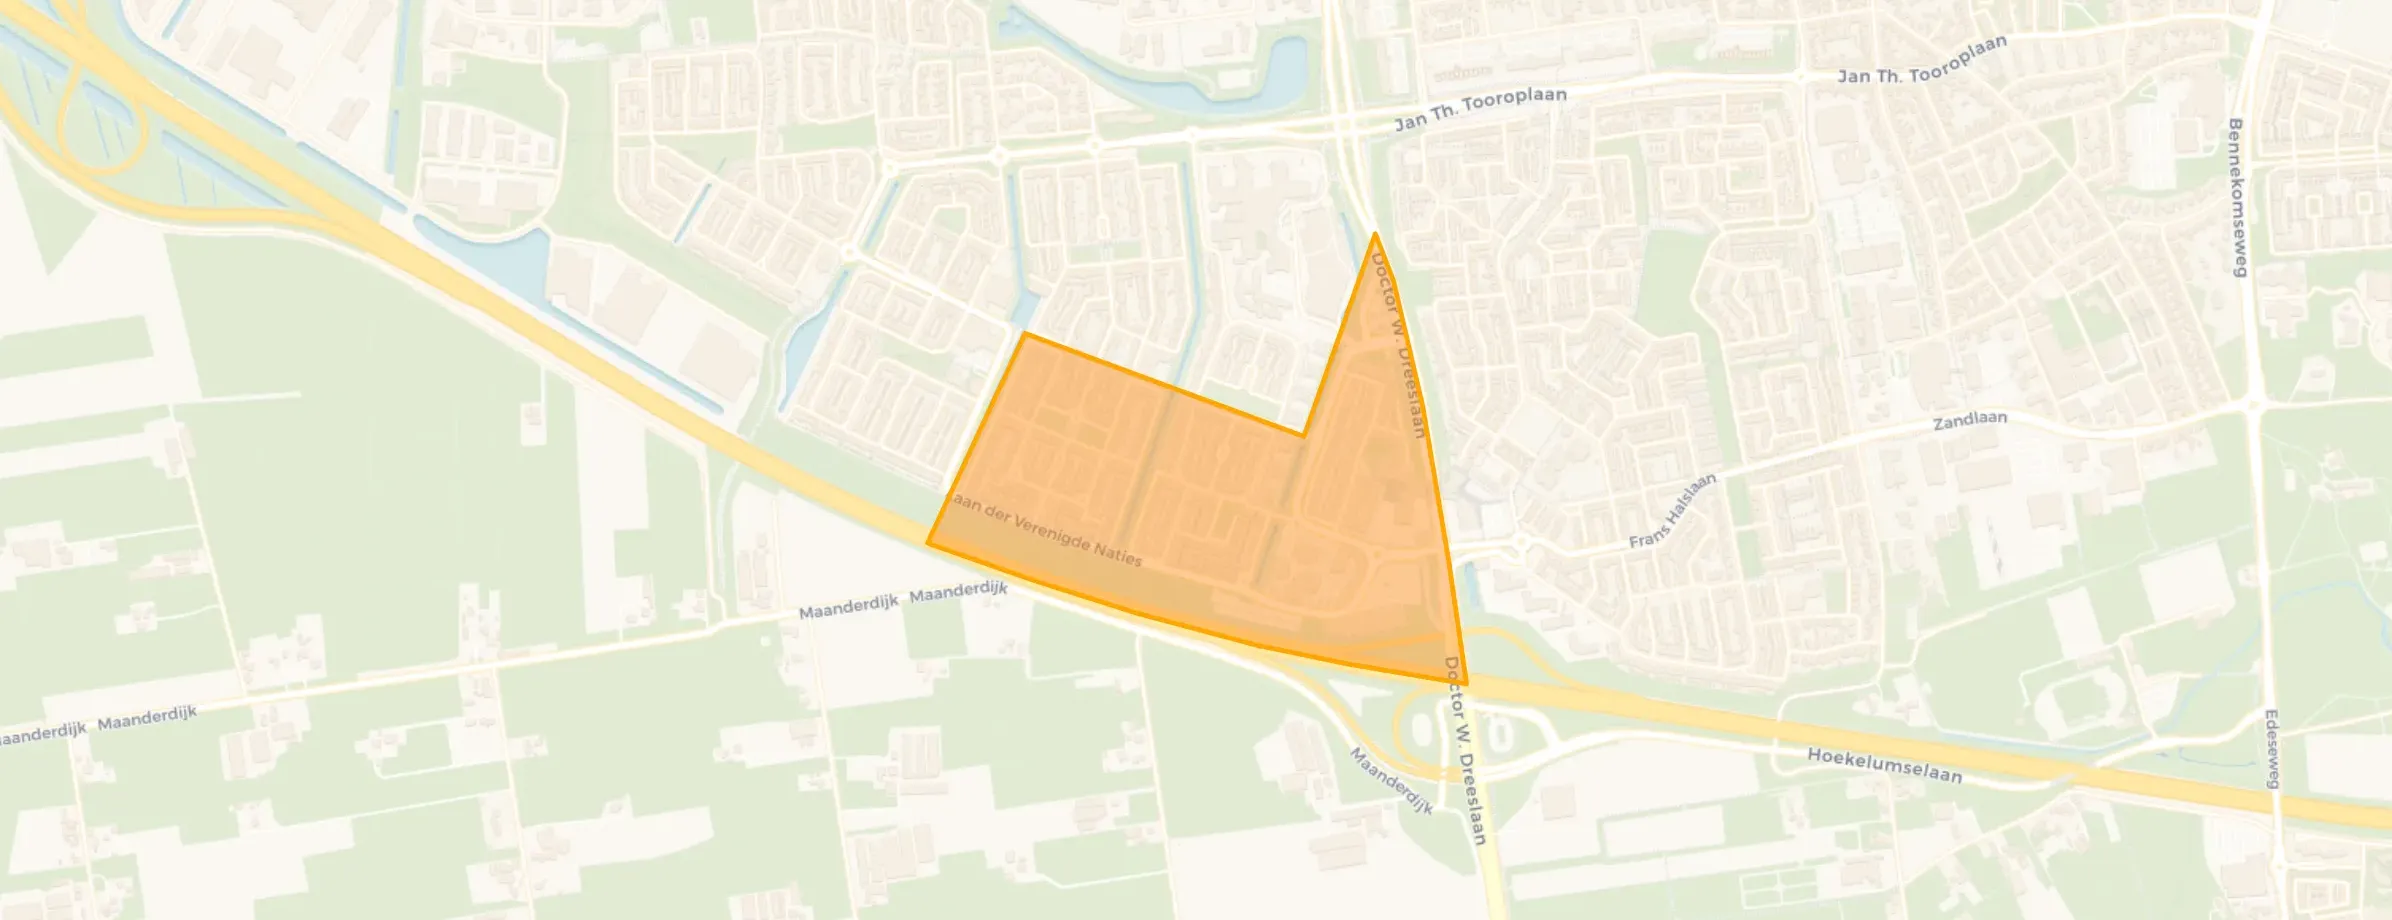
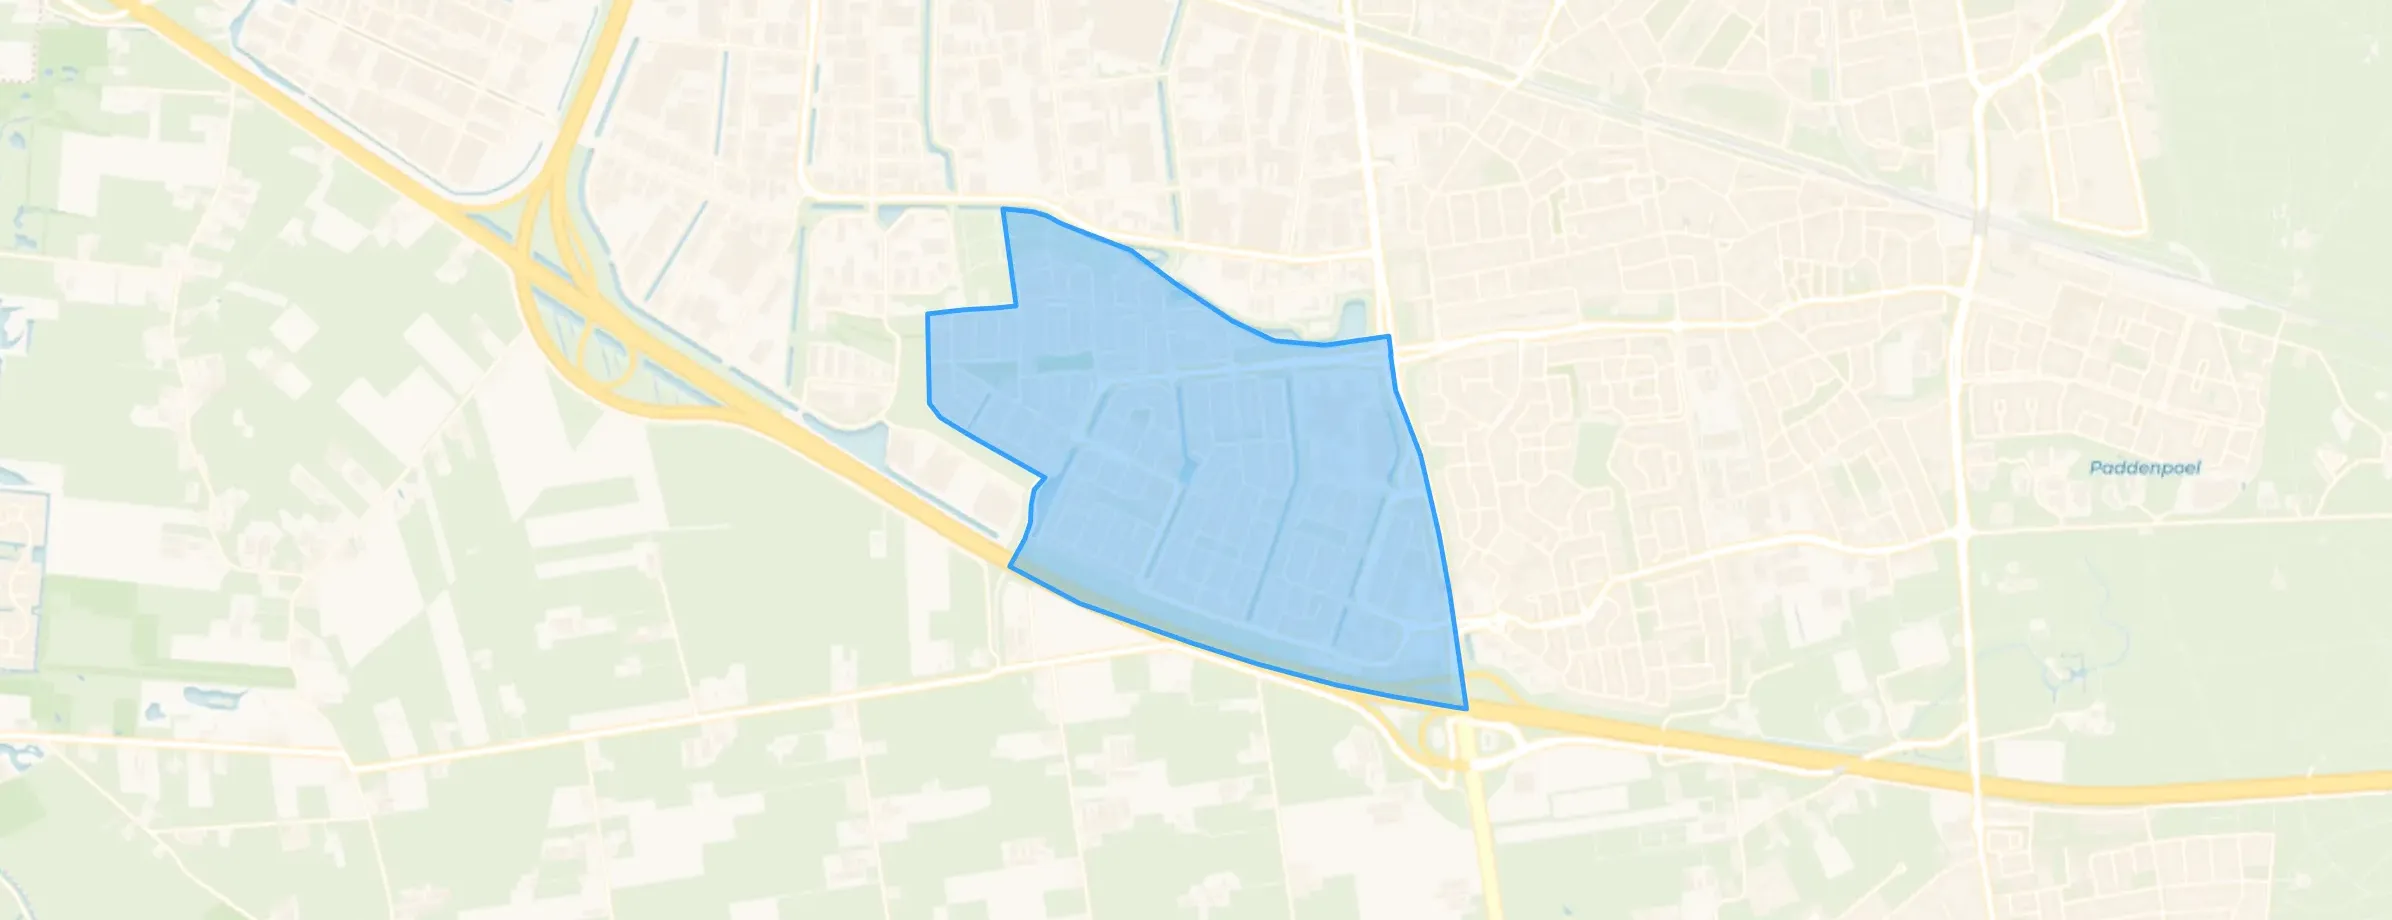
Rietkampen is located in the province of Gelderland, in the municipality of Ede The district has a total area of 136 hectares, of which 134 hectares are land and 2 hectares are water. The district is coded as WK022812. The postcode area is 6716AL-6716SN.
Rietkampen has 7.845 residents. Of these, 50,4% are men and 49,6% are women. Most residents are 45 to 65 years (29,3%). The other age groups are 23,4% for '25 to 45 years', 19,8% for '65 years or older', 16,0% for '0 to 15 years' and 11,4% for '15 to 25 years'. Of the residents, 42,1% is unmarried, 47,5% is married, 6,1% is divorced and 4,3% is widowed. 6.470 residents originate from the Netherlands, 405 come from Europe and 970 come from countries outside Europe.
There are 3.180 households in Rietkampen. 26,4% of these are single-person households, 33,5% households without children and 40,1% households with children. The average household size is 2,4 persons. The national average is 2,1 persons.
In Rietkampen there are 6.200 income recipients. The average income per income recipient is €42.400, which is €200 (0%) higher than the national average of €42.200. Per resident, the average income is €34.500, which is €400 (1%) lower than the national average of €34.900. Most residents of Rietkampen are educated to an intermediate level. 41,4% have an intermediate education (HAVO, VWO or MBO 2-4), 37,2% have a university or higher professional education (HBO/WO) and 21,4% have a lower education (VMBO or MBO 1).
Of the 7.845 residents, around 75% are in paid employment, which amounts to 5.884 people. This is 3% higher than the national average of 72%. The majority of workers are in salaried employment (90%), while 10% are self-employed. In Rietkampen, 24% of residents receive a benefit. The largest group is those receiving a state pension (AOW). 1.390 people receive this benefit.
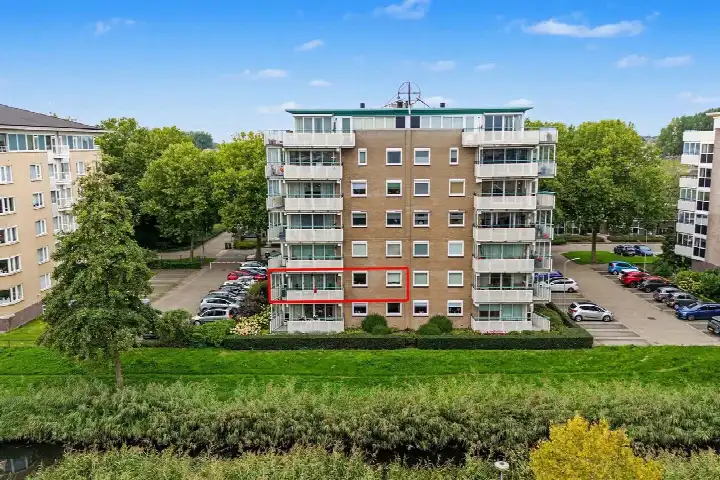
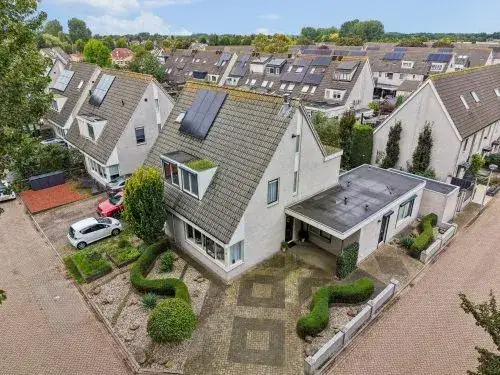
In Rietkampen there are 3.235 homes with an average assessed value (WOZ) of €395.000. Of these, around 98% are occupied and 2% unoccupied. Most homes are owner-occupied. This amounts to 19% rental homes and 81% owner-occupied homes. Of the homes, 81% privately owned, 16% owned by housing associations and 3% owned by other landlords. The most common construction periods in Rietkampen are 1990-2000 (97%) and 2020 and later (2%).
There are currently no homes for sale in Rietkampen. The most recently listed home is Noel-Bakerstate 40 by BMV Makelaars Ede. No homes were sold in Rietkampen over the past year.
There are currently no homes for rent in Rietkampen. The most recent home is Laan der Verenigde Naties 171, offered by FIT Vastgoedbeheer BV. No homes were let in Rietkampen over the past year.
No recent rental data available for Rietkampen.
In Rietkampen there are 1.784 addresses with a registered energy label. The most common labels are B (41%), A (36%) and C (20%). On average, an address in Rietkampen uses 2.540 kWh of electricity per year. This is 0% below the national average of 2.550 kWh. With an annual consumption of 750 m³ per address, natural gas consumption is 6% below the national average of 800 m³.
It's a nice neighbourhood, plenty of choice in schools, you can walk to patches of nature, and enough playgrounds for the children. Also, all necessary amenities are nearby, which is great since I don't have a driver's license. I just miss trees on our street. It was quite dull and grey, and our houses get very hot in summer. Moreover, especially in Ede, preserving nature is a must. I also noticed that most streets here do have trees, except for the Edendreef.
Auto-translated to English by AIMy experience with the neighbourhood is pleasant. I live in a building with young people (supervised) in an ordinary terraced house. Sometimes people experience some nuisance from parties and music, but that is handled well.
Auto-translated to English by AIThere are both young and old people living here, lots of nice spots for walking, super beautiful houses, and generally pleasant people to have around.
Auto-translated to English by AIMy experience with the neighbourhood is good, always having a chat with the neighbours.
Auto-translated to English by AIChild-friendly neighbourhood with green spaces and play facilities. Close to a shopping centre, the hospital, the cinema and the station. Various schools in the area within walking distance. Social control. Occasionally loitering youths and mess in the playgrounds. Regular noise from scooters on the through cycle path.
Auto-translated to English by AI5 minutes from nature, 15 minutes by bike to the centre, several big cities within half an hour, lots of volunteer work here
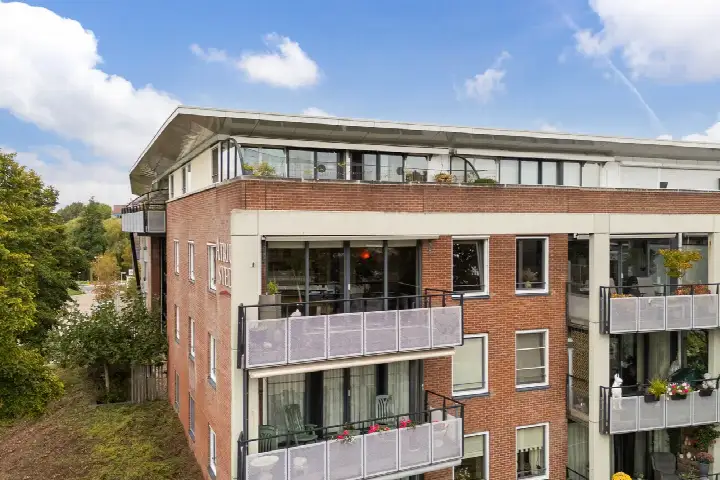
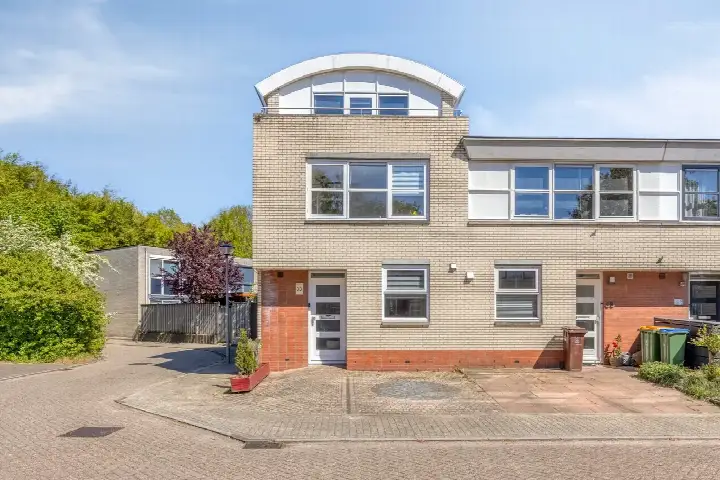
Auto-translated to English by AIThe housing stock is relatively young — 85% dates from after 1990. In addition, the most common type is terraced houses (55%).
Over the past year a home for sale in Rietkampen was listed for an average of €462,972 (€4,275 per m²). That is 12% below the Dutch national average.
Residents give Rietkampen a 8.0 out of 10 based on 6 reviews. The strongest score is for amenities (8.5), the weakest for housing (7.5).
Wijk Rietkampen has 7,845 residents. Many families: 40% of the households have children.
The housing supply in Rietkampen is remarkably efficient: 80% has an A, A+ or B label. The average natural gas consumption per household is 750 m³ per year.
From Rietkampen you can on average reach a supermarket at 1.4 km, a GP at 1.4 km, a railway station at 3.2 km, a primary school at 0.5 km (as the crow flies, source: CBS).
Right now you will find 35 homes for sale and 1 homes for rent in Rietkampen.