District in Haarlem
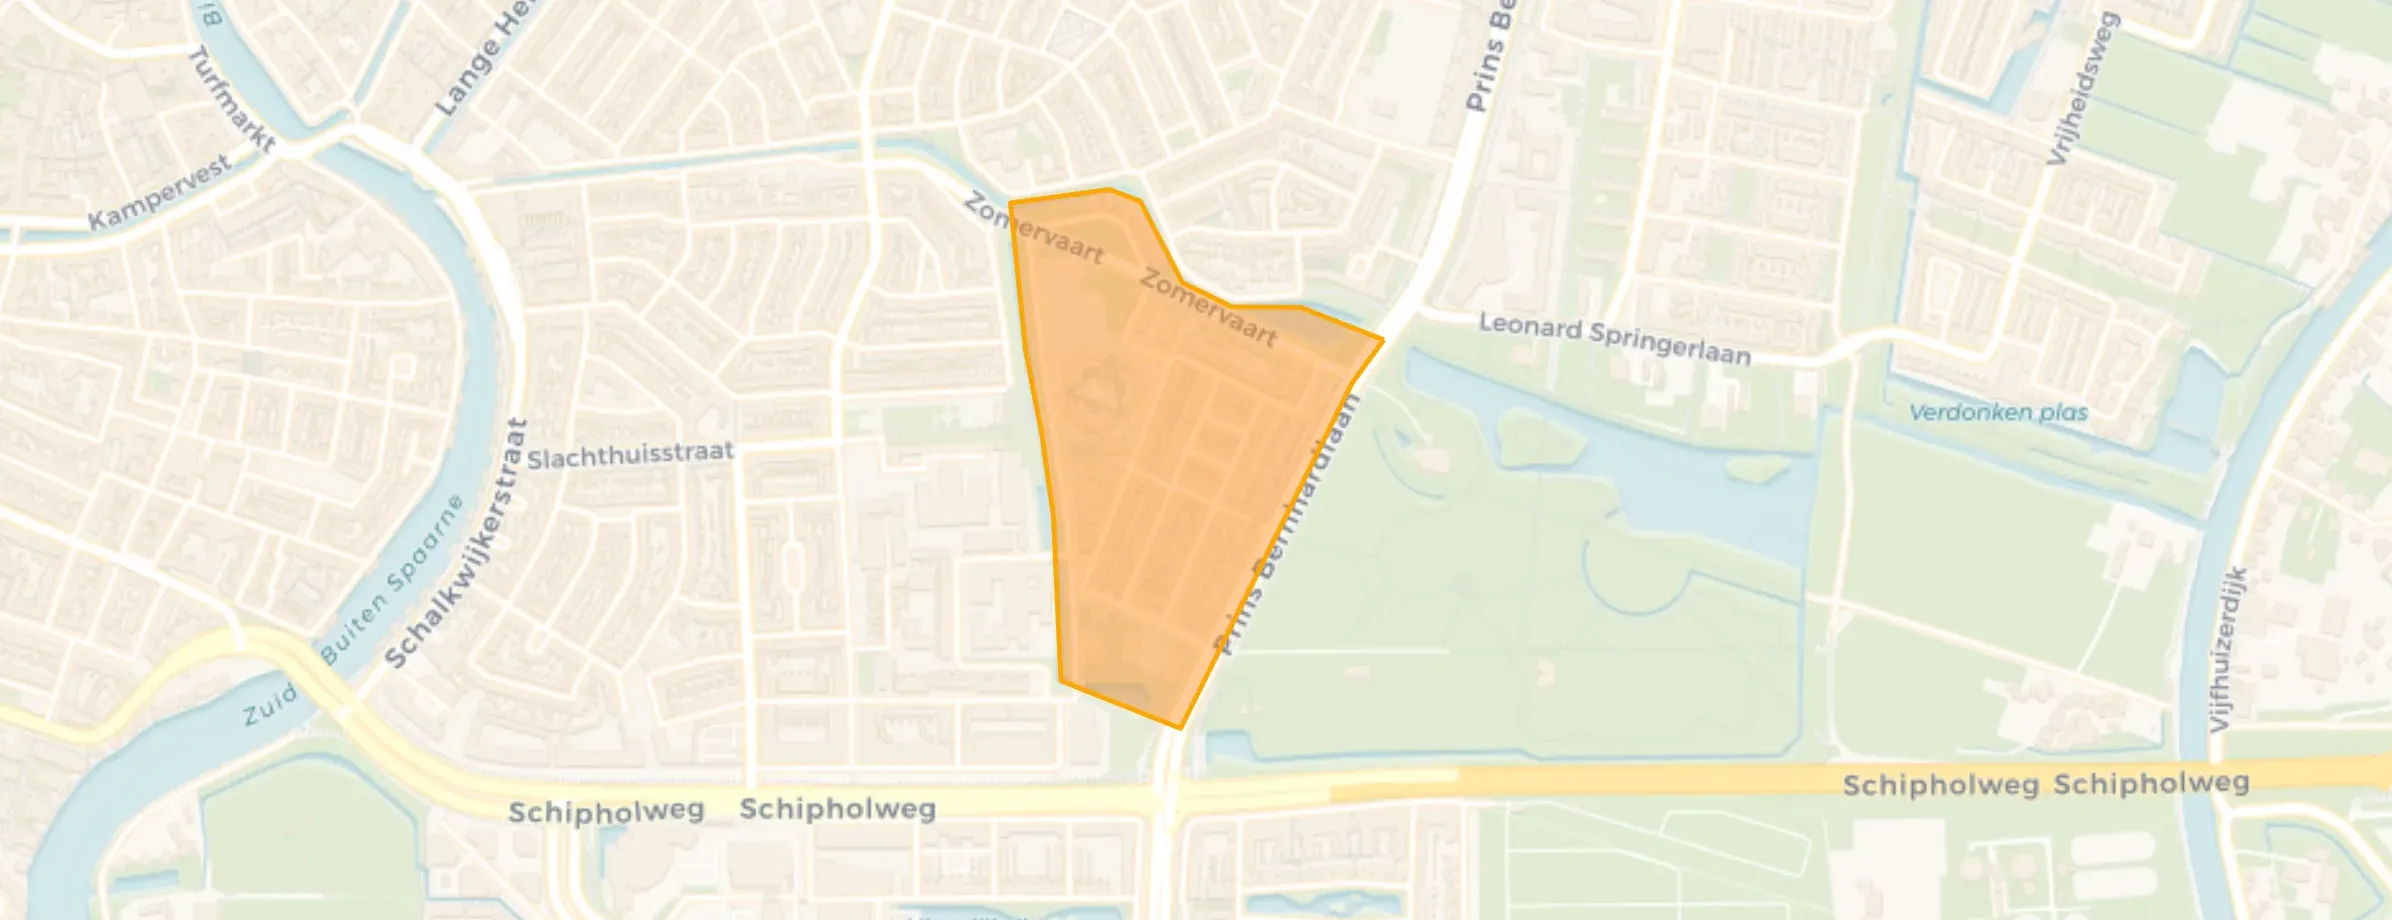
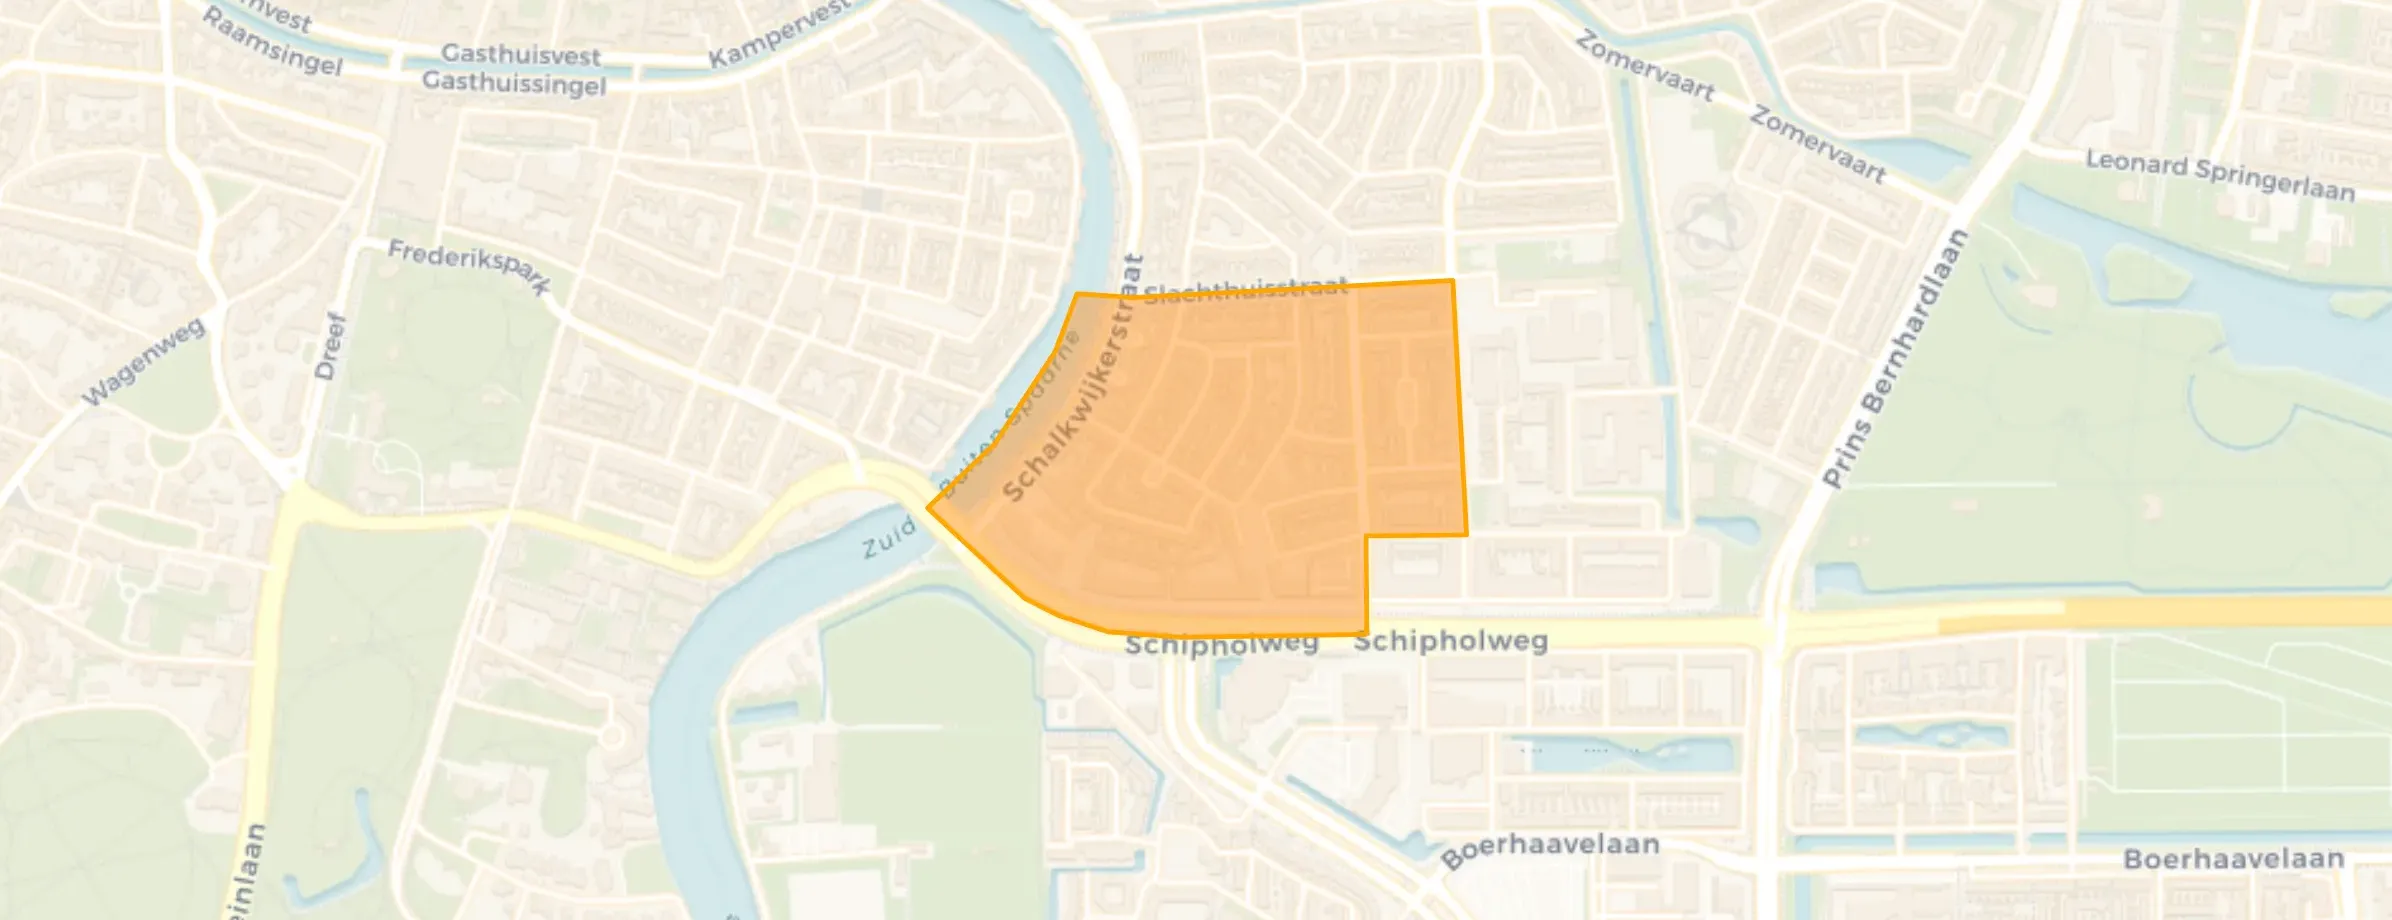
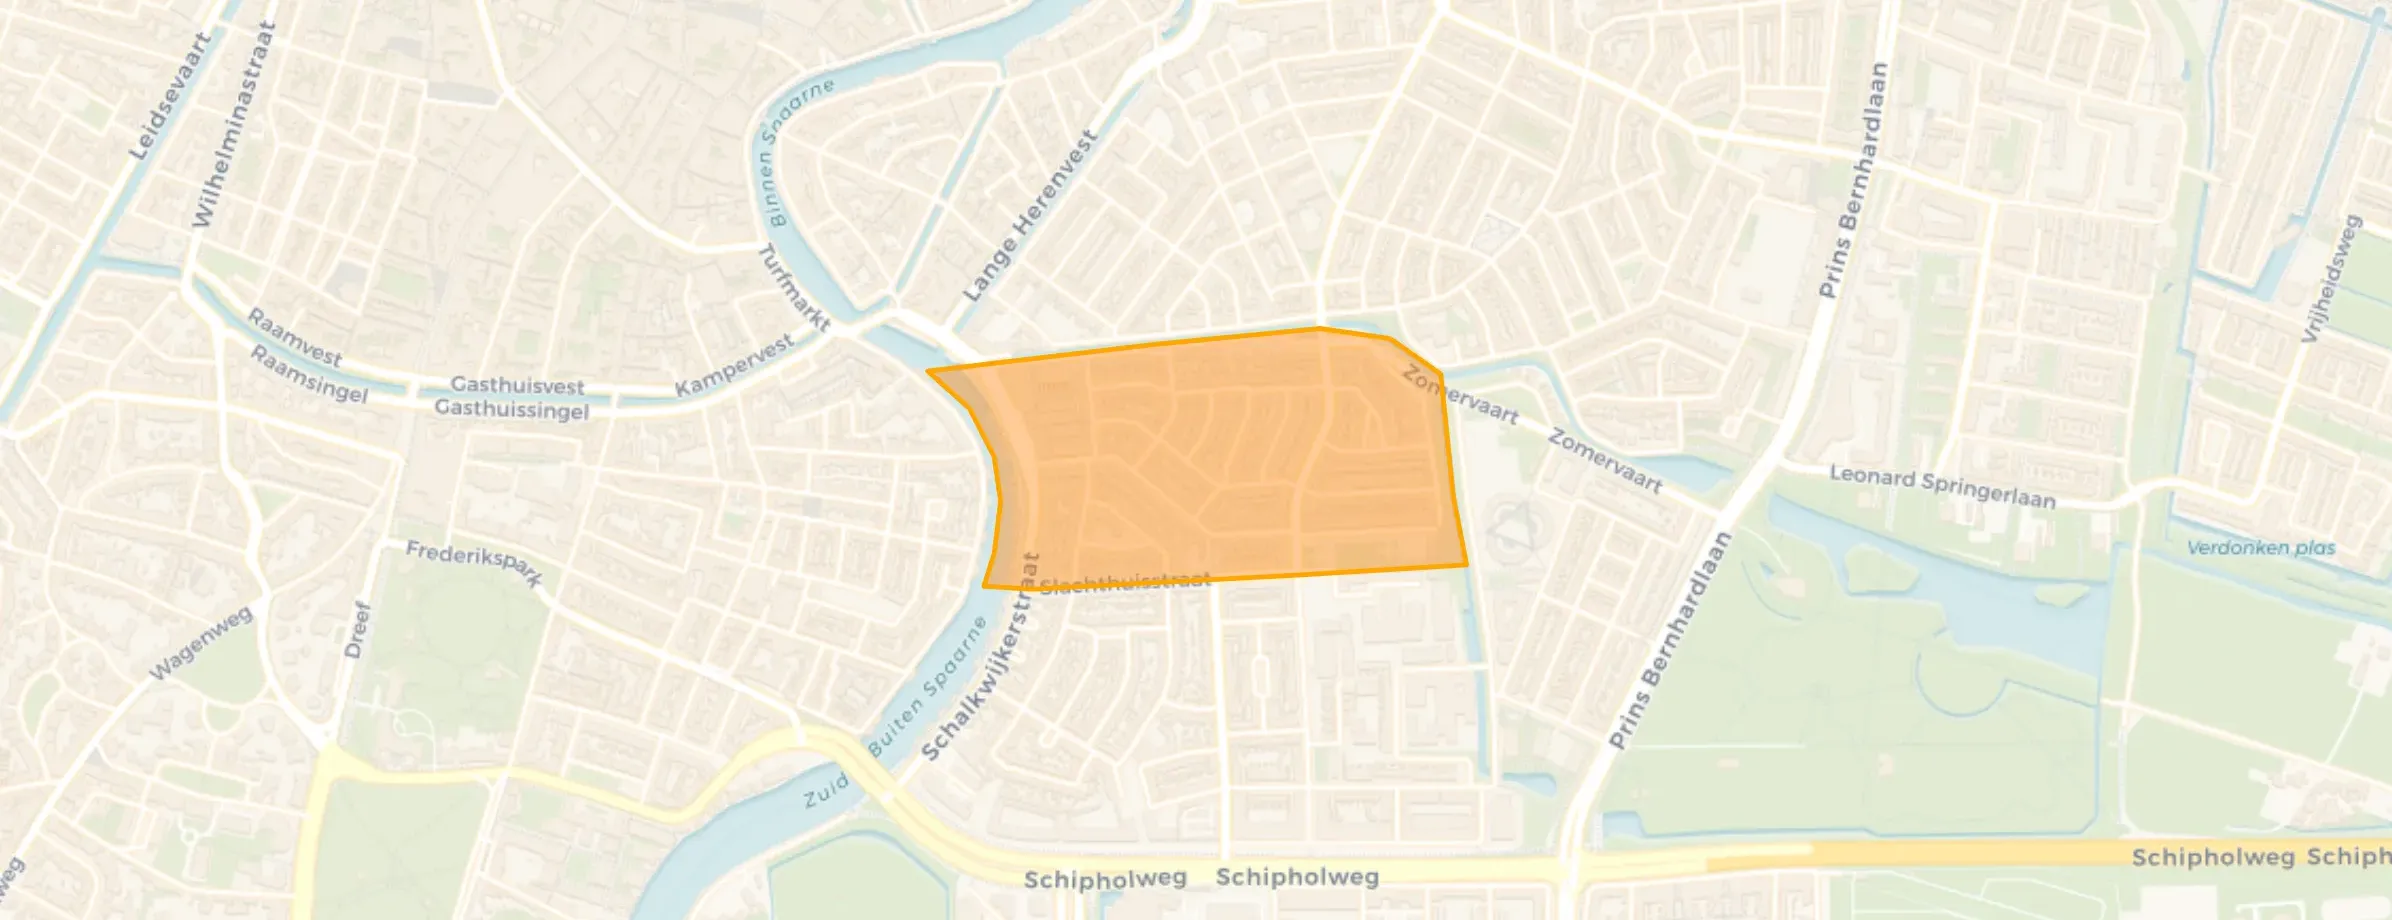
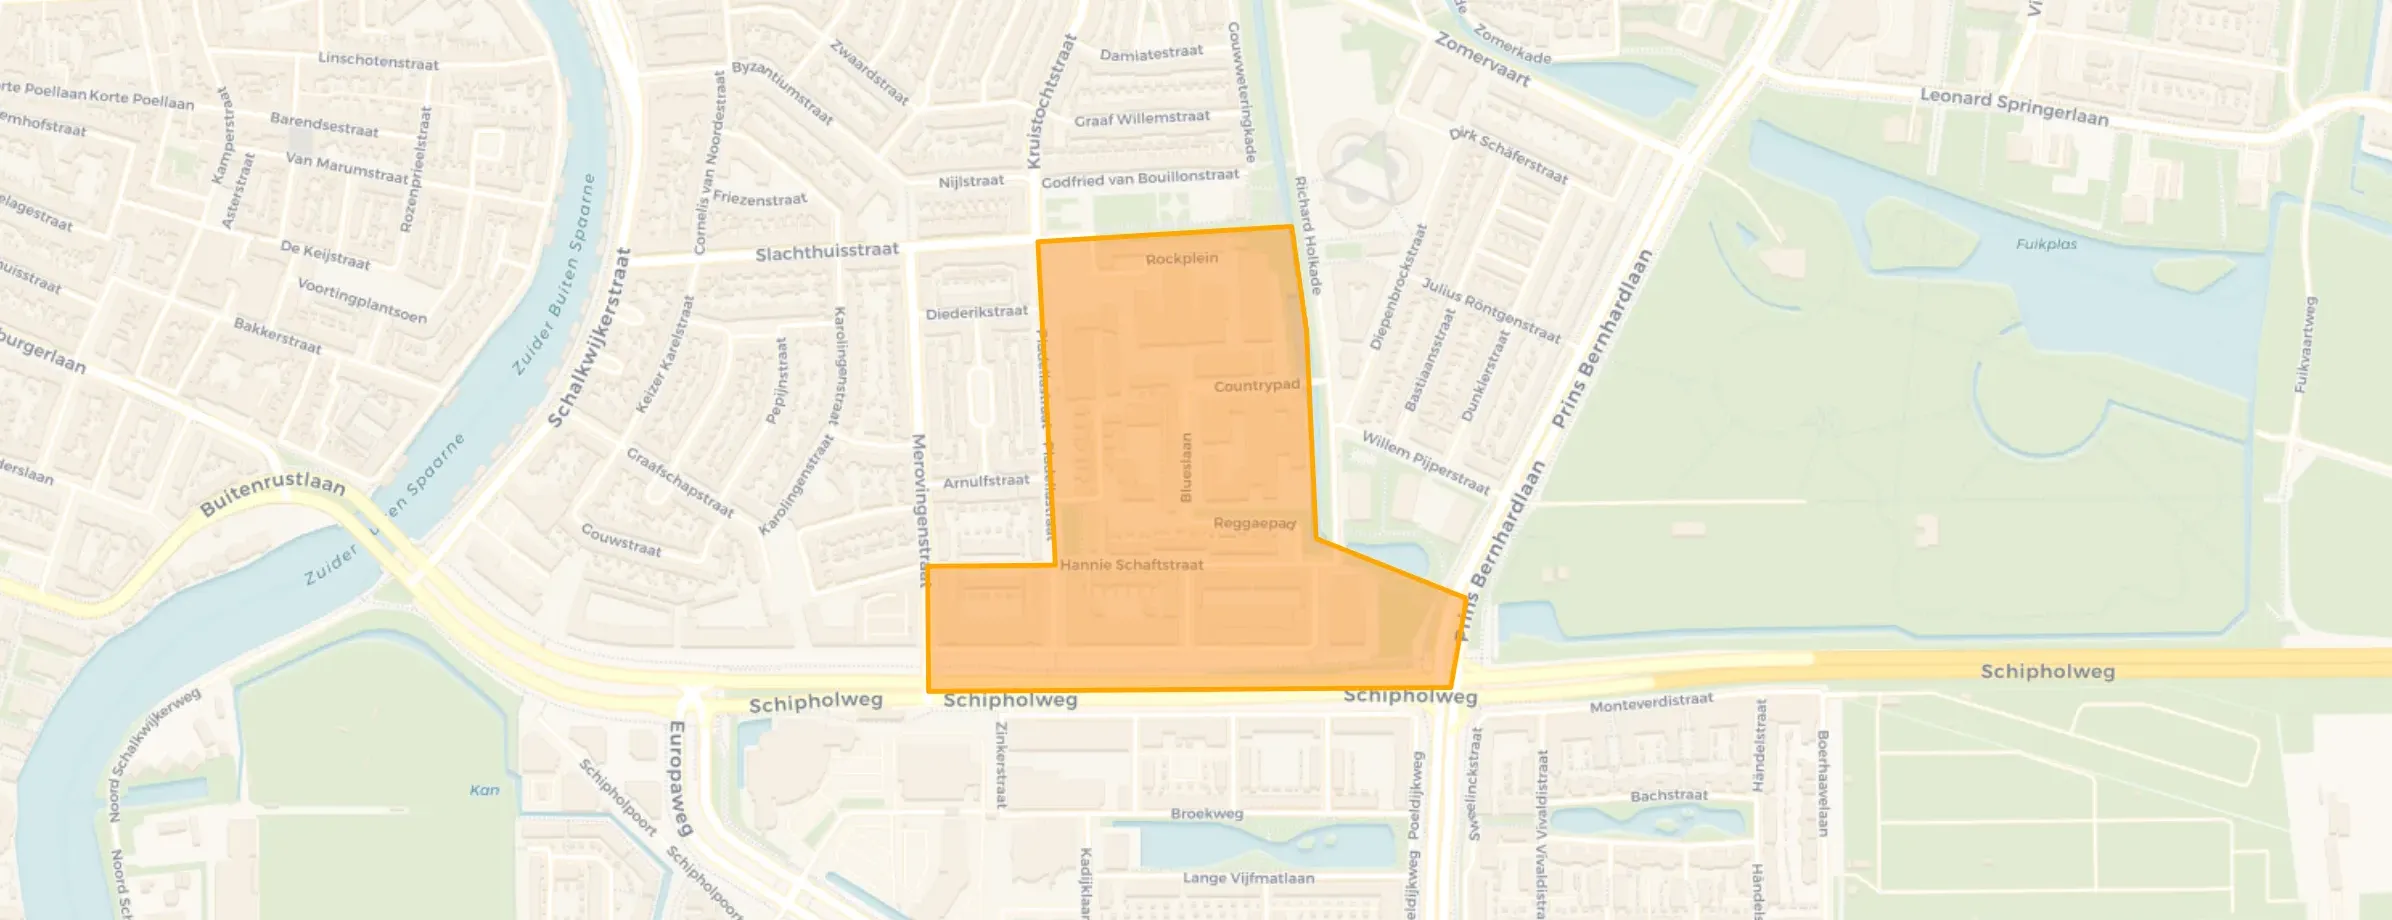
Slachthuiswijk is located in the province of Noord-Holland, in the municipality of Haarlem The district has a total area of 67 hectares, of which 65 hectares are land and 3 hectares are water. The district is coded as WK039208. The postcode area is 2033DA-2034LS.
Slachthuiswijk has 6.745 residents. Of these, 48,2% are men and 51,8% are women. Most residents are 25 to 45 years (36,0%). The other age groups are 23,4% for '45 to 65 years', 16,2% for '0 to 15 years', 16,2% for '65 years or older' and 8,2% for '15 to 25 years'. Of the residents, 60,7% is unmarried, 25,9% is married, 9,8% is divorced and 3,6% is widowed. 4.195 residents originate from the Netherlands, 725 come from Europe and 1.825 come from countries outside Europe.
There are 3.535 households in Slachthuiswijk. 48,5% of these are single-person households, 22,2% households without children and 29,3% households with children. The average household size is 1,9 persons. The national average is 2,1 persons.
In Slachthuiswijk there are 5.000 income recipients. The average income per income recipient is €39.900, which is €2.300 (5%) lower than the national average of €42.200. Per resident, the average income is €32.400, which is €2.500 (7%) lower than the national average of €34.900. Most residents of Slachthuiswijk are highly educated. 37,3% have a university or higher professional education (HBO/WO), 34,6% have an intermediate education (HAVO, VWO or MBO 2-4) and 28,1% have a lower education (VMBO or MBO 1).
Of the 6.745 residents, around 70% are in paid employment, which amounts to 4.722 people. This is 2% lower than the national average of 72%. The majority of workers are in salaried employment (85%), while 15% are self-employed. In Slachthuiswijk, 27% of residents receive a benefit. The largest group is those receiving a state pension (AOW). 970 people receive this benefit.
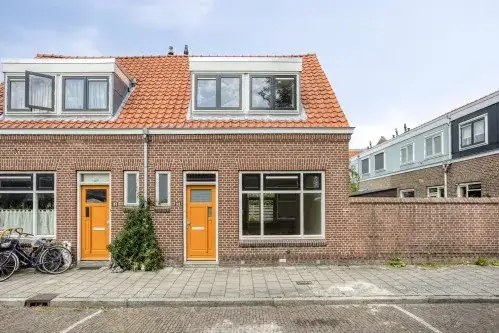
In Slachthuiswijk there are 3.516 homes with an average assessed value (WOZ) of €425.000. Of these, around 97% are occupied and 3% unoccupied. Most homes are rental properties. This amounts to 73% rental homes and 27% owner-occupied homes. Of the homes, 27% privately owned, 62% owned by housing associations and 11% owned by other landlords. The most common construction periods in Slachthuiswijk are 1925-1950 (28%) and 1900-1925 (27%).
There are currently no homes for sale in Slachthuiswijk. The most recently listed home is Patriarchstraat 32 by Hoekstra en van Eck. No homes were sold in Slachthuiswijk over the past year.
There are currently no homes for rent in Slachthuiswijk. The most recent home is Clothildestraat 27, offered by Rijsterborgh Makelaars. No homes were let in Slachthuiswijk over the past year.
No recent rental data available for Slachthuiswijk.
In Slachthuiswijk there are 3.118 addresses with a registered energy label. The most common labels are A (32%), C (19%) and A++ (11%). On average, an address in Slachthuiswijk uses 2.000 kWh of electricity per year. This is 22% below the national average of 2.550 kWh. With an annual consumption of 560 m³ per address, natural gas consumption is 30% below the national average of 800 m³.
Buurt met veel potentie, maar erg veel sociale huur. Ongezonde balans. Te veel afval op straat, weinig groen. Bewoners hechten weinig waarde aan de buurt. Wel een fijne buurt voor kinderen en rustig gelegen in Haarlem. Dichtbij de de stad en uitvalswegen naar Amsterdam. Er zijn in de buurt zelf geen winkels, maar ligt om 5 min afstand van Amsterdamstraat en 10min van de binnenstad.
Auto-translated to English by AI.
Auto-translated to English by AISad people have no life, they ruin others' lives
Auto-translated to English by AIA safe, quiet neighbourhood close to Haarlem city centre, Albert Heijn within walking distance, and a secondary and primary school.
Auto-translated to English by AIVery boring, little to do, it's very quiet and peaceful, actually perfect for older people.
Auto-translated to English by AIA lot of noise and nuisance, often police responding to reports in this neighbourhood. Not a super neighbourhood..
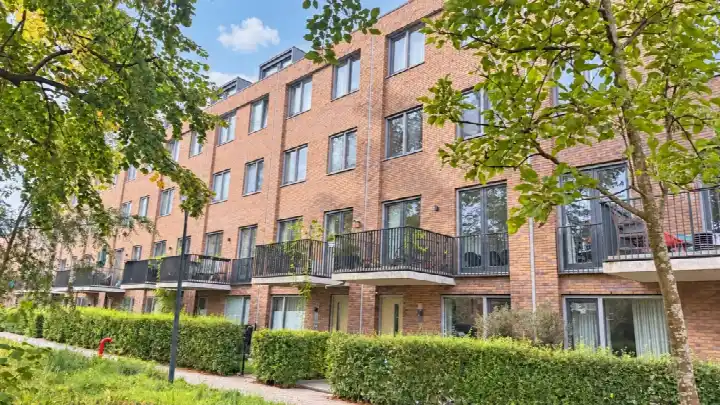
Auto-translated to English by AIThe housing stock is relatively young — 58% dates from after 1990. In addition, the most common type is flats (60%).
Over the past year a home for sale in Slachthuiswijk was listed for an average of €572,550 (€6,494 per m²).
A rental home in Slachthuiswijk cost an average of €2,107 per month (€26 per m²).
Residents give Slachthuiswijk a 5.5 out of 10 based on 6 reviews. The strongest score is for safety (6.8), the weakest for cleanliness (4.0).
Wijk Slachthuiswijk has 6,745 residents. The largest age group is 25 to 45 years (36%).
The housing supply in Slachthuiswijk is remarkably efficient: 76% has an A, A+ or B label. The average natural gas consumption per household is 560 m³ per year.
From Slachthuiswijk you can on average reach a supermarket at 0.6 km, a GP at 0.7 km, a railway station at 2.5 km, a primary school at 0.6 km (as the crow flies, source: CBS).
Right now you will find 25 homes for sale and 4 homes for rent in Slachthuiswijk.