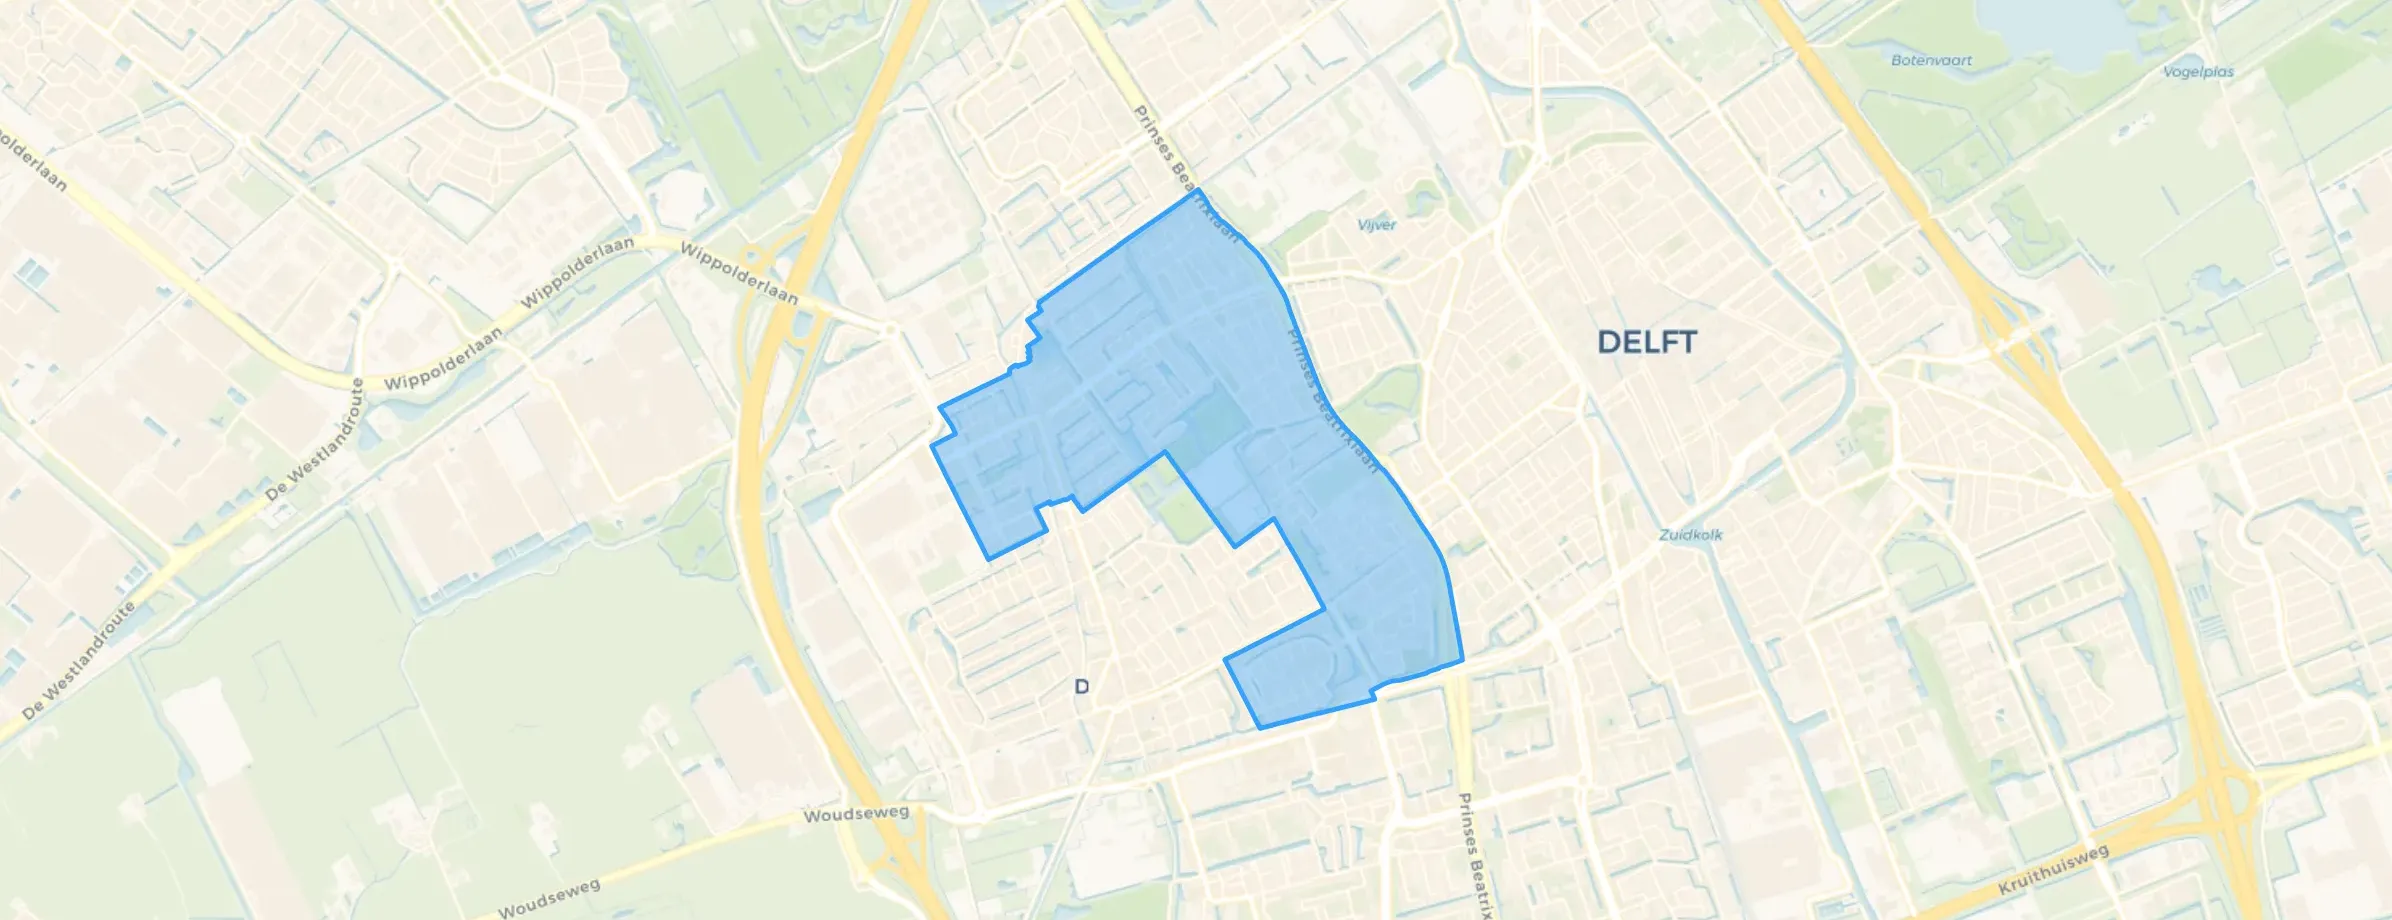
District in Delft
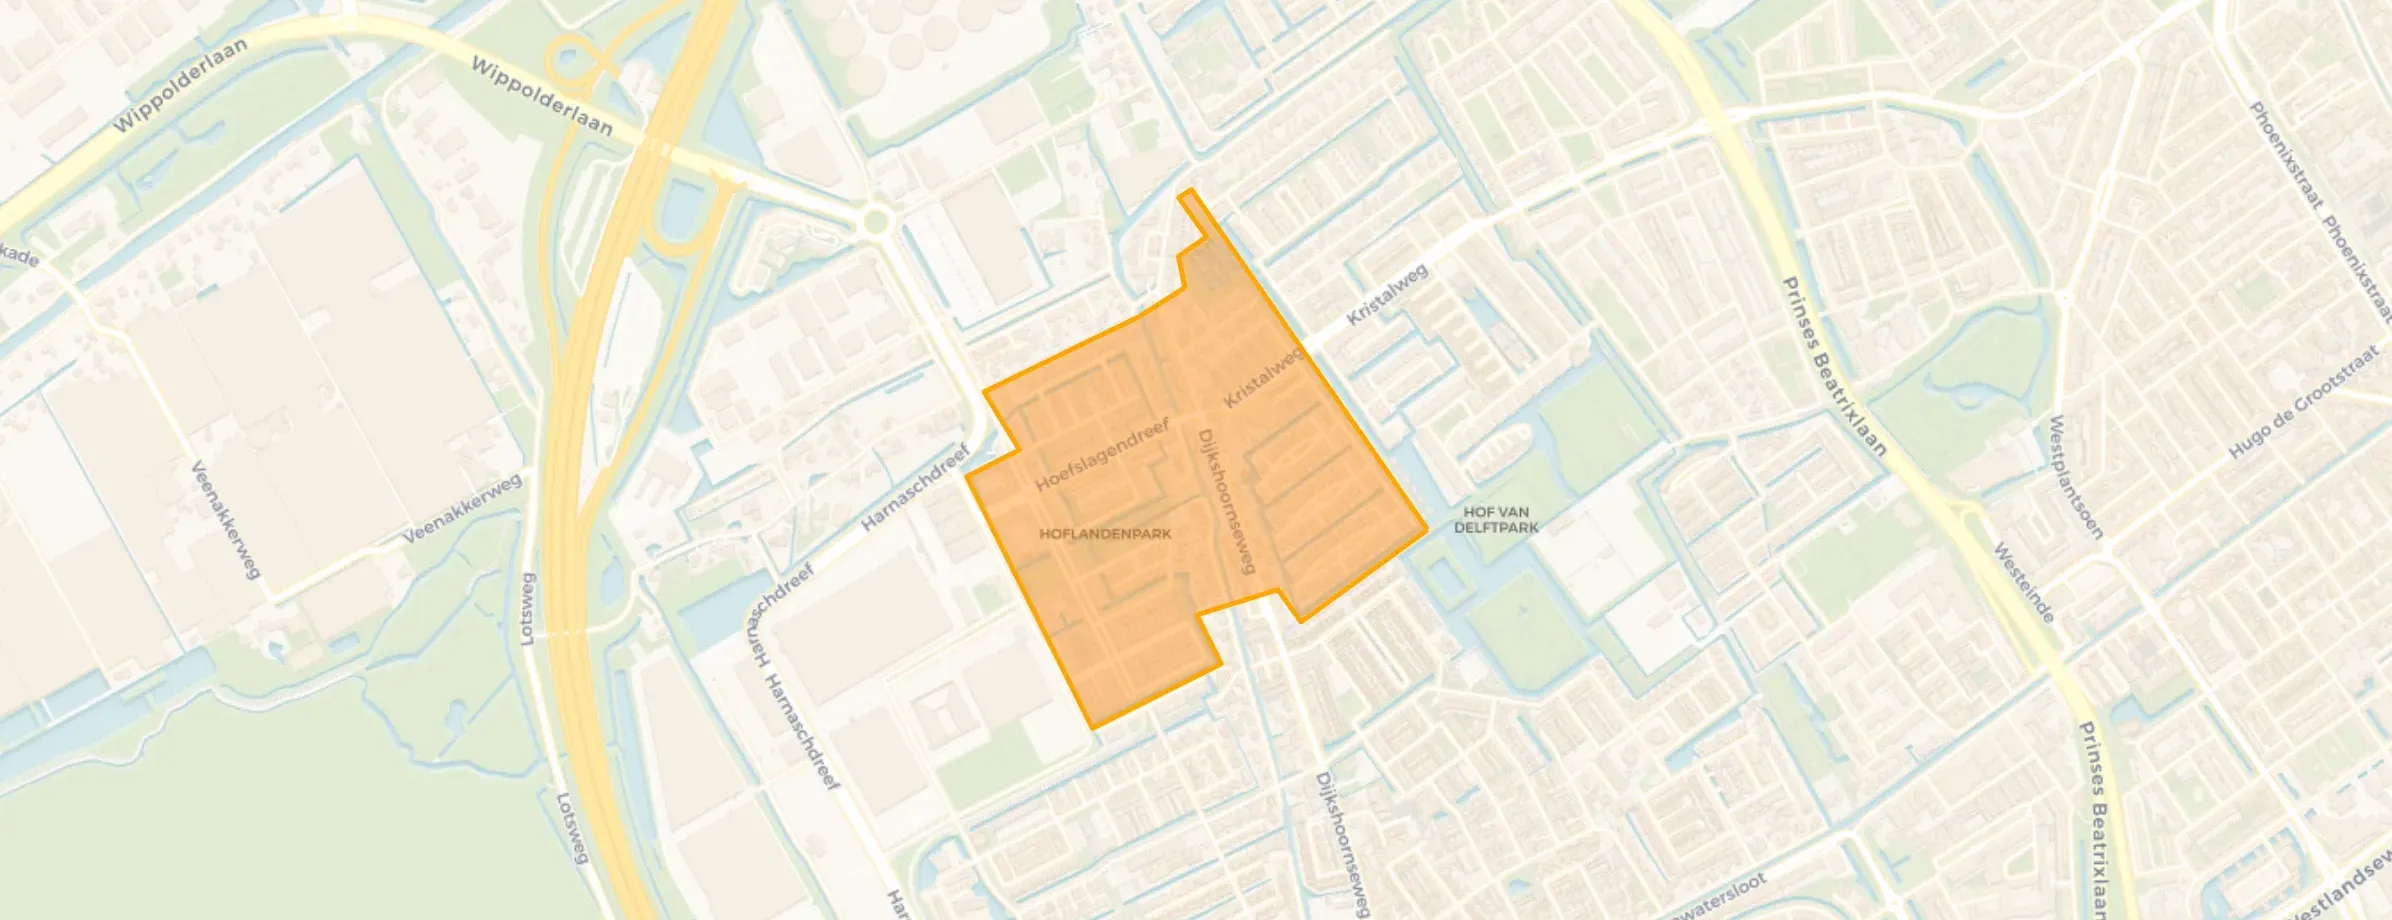
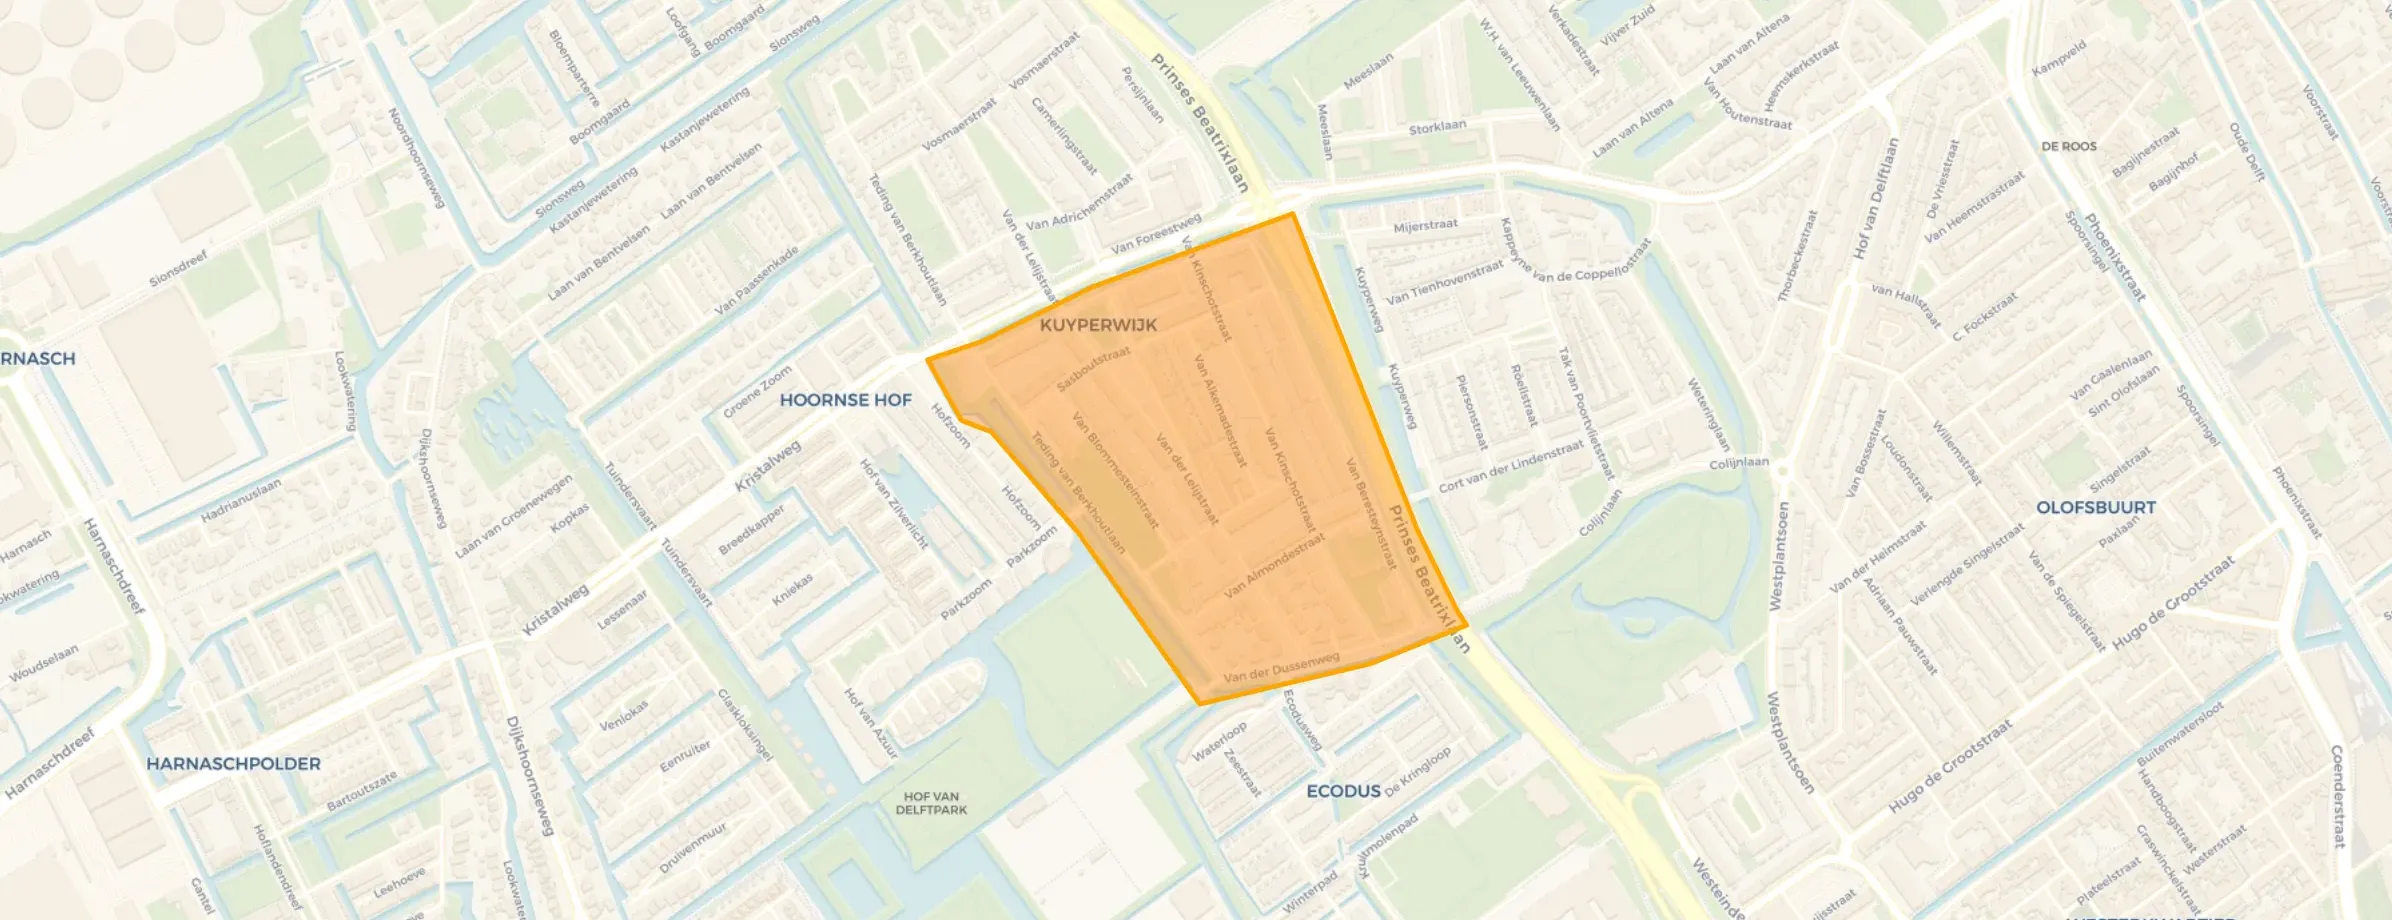
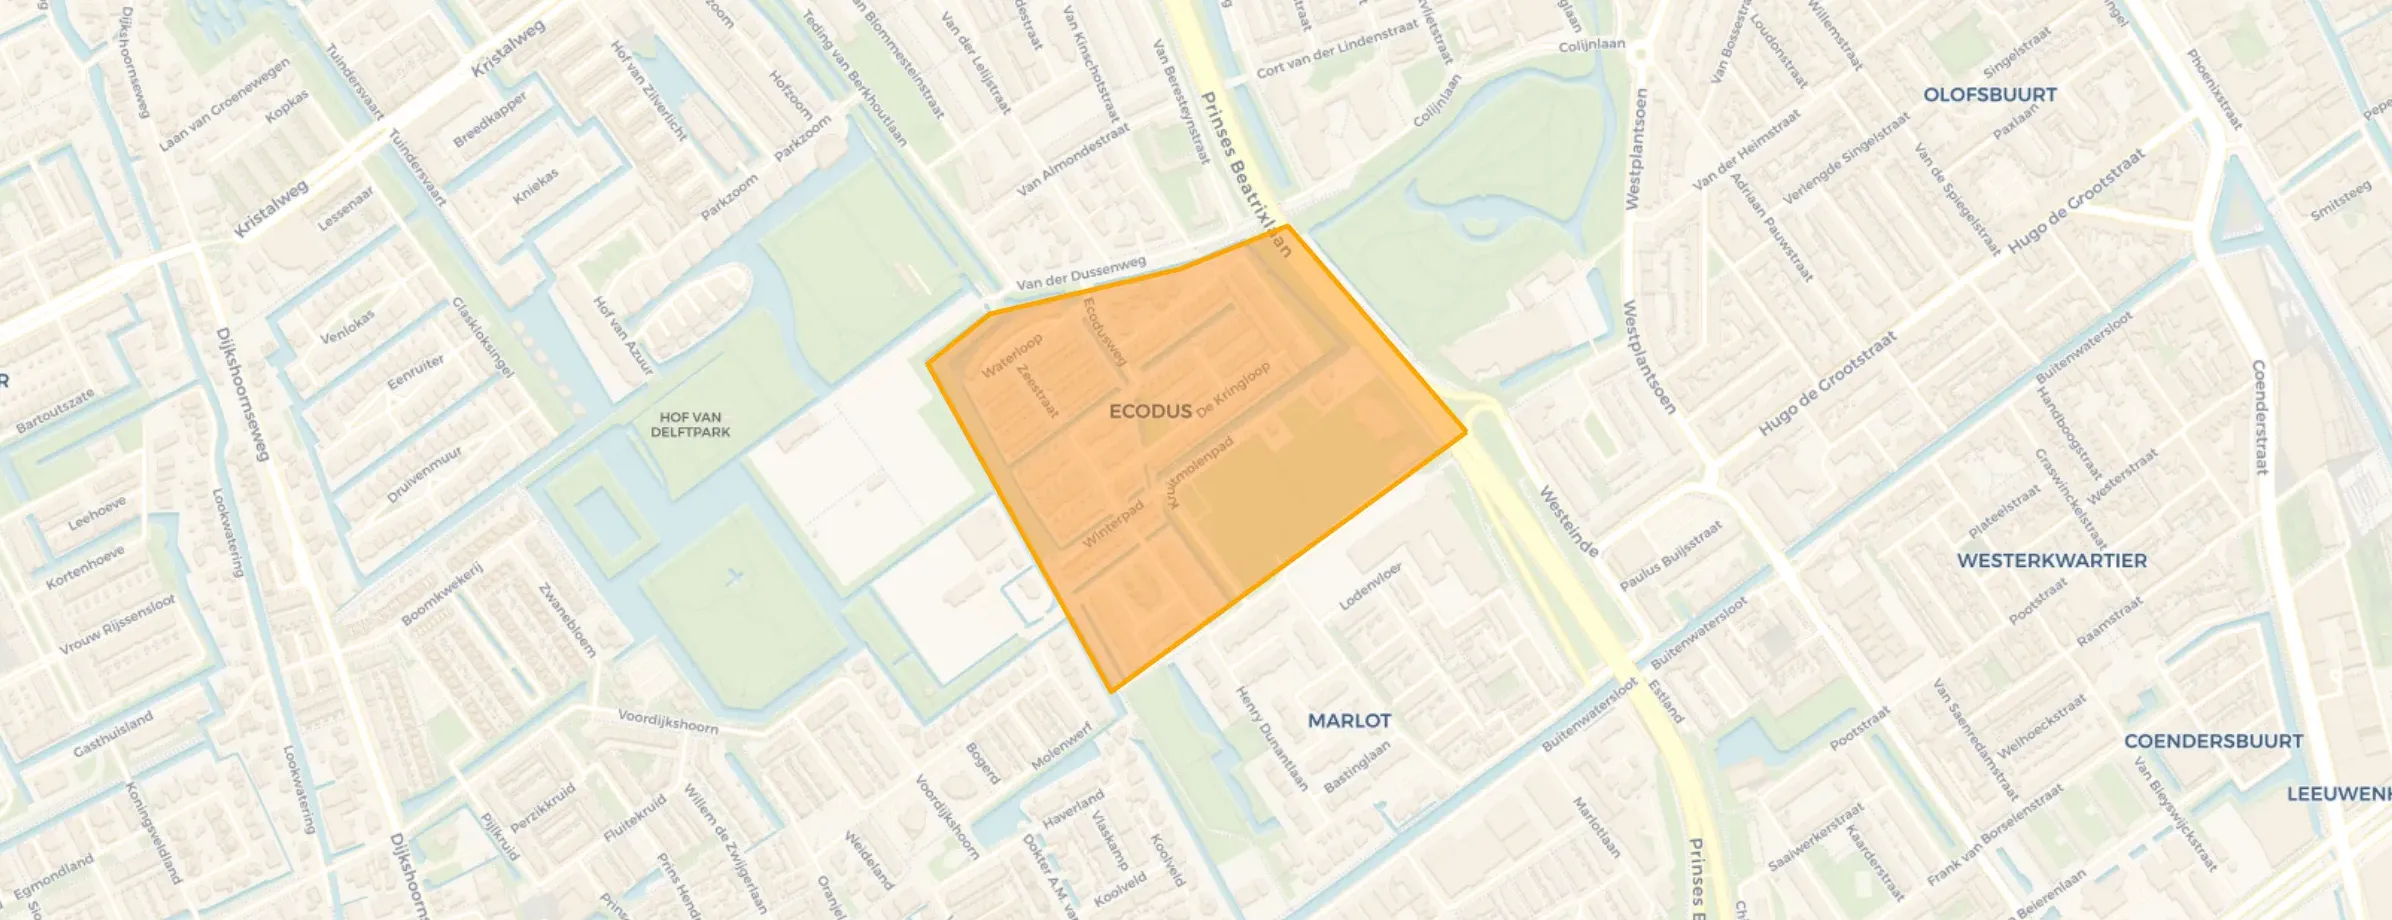
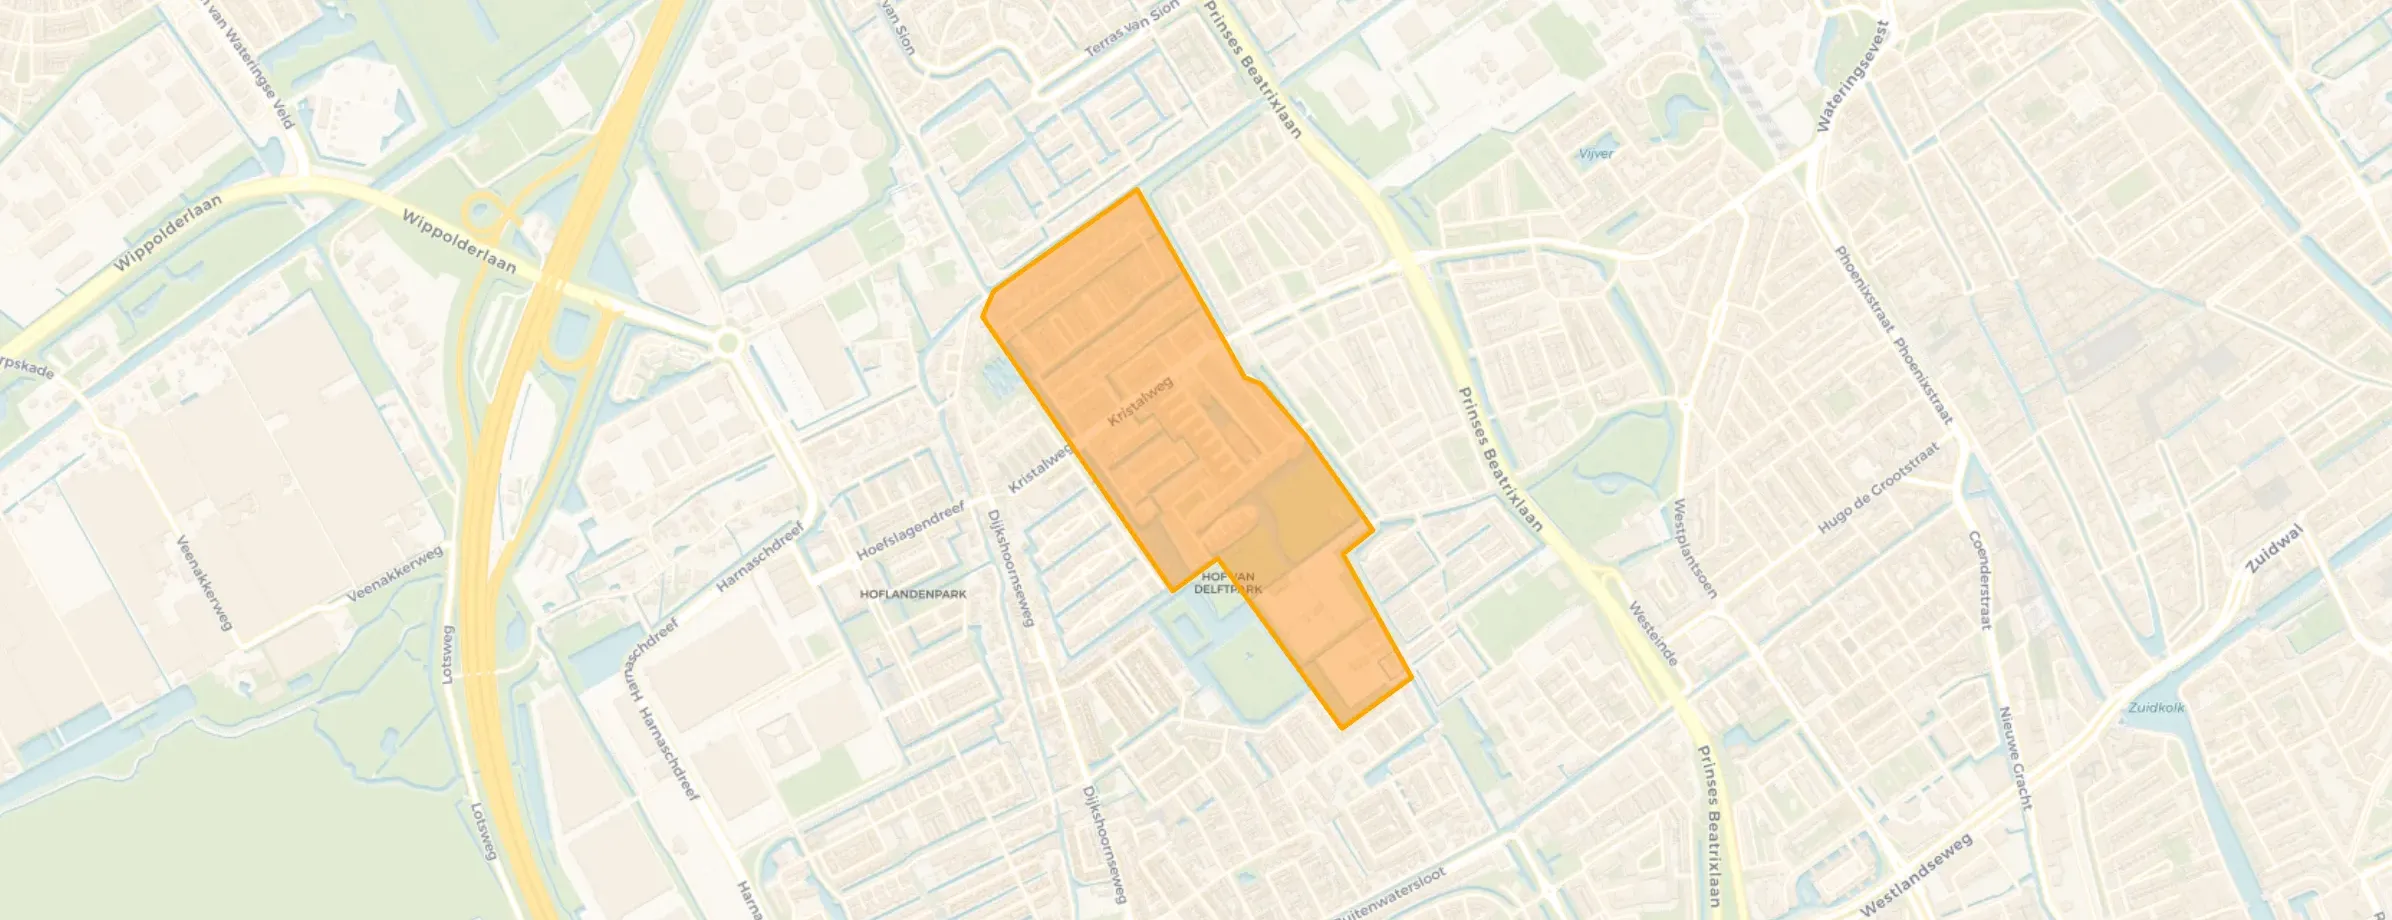
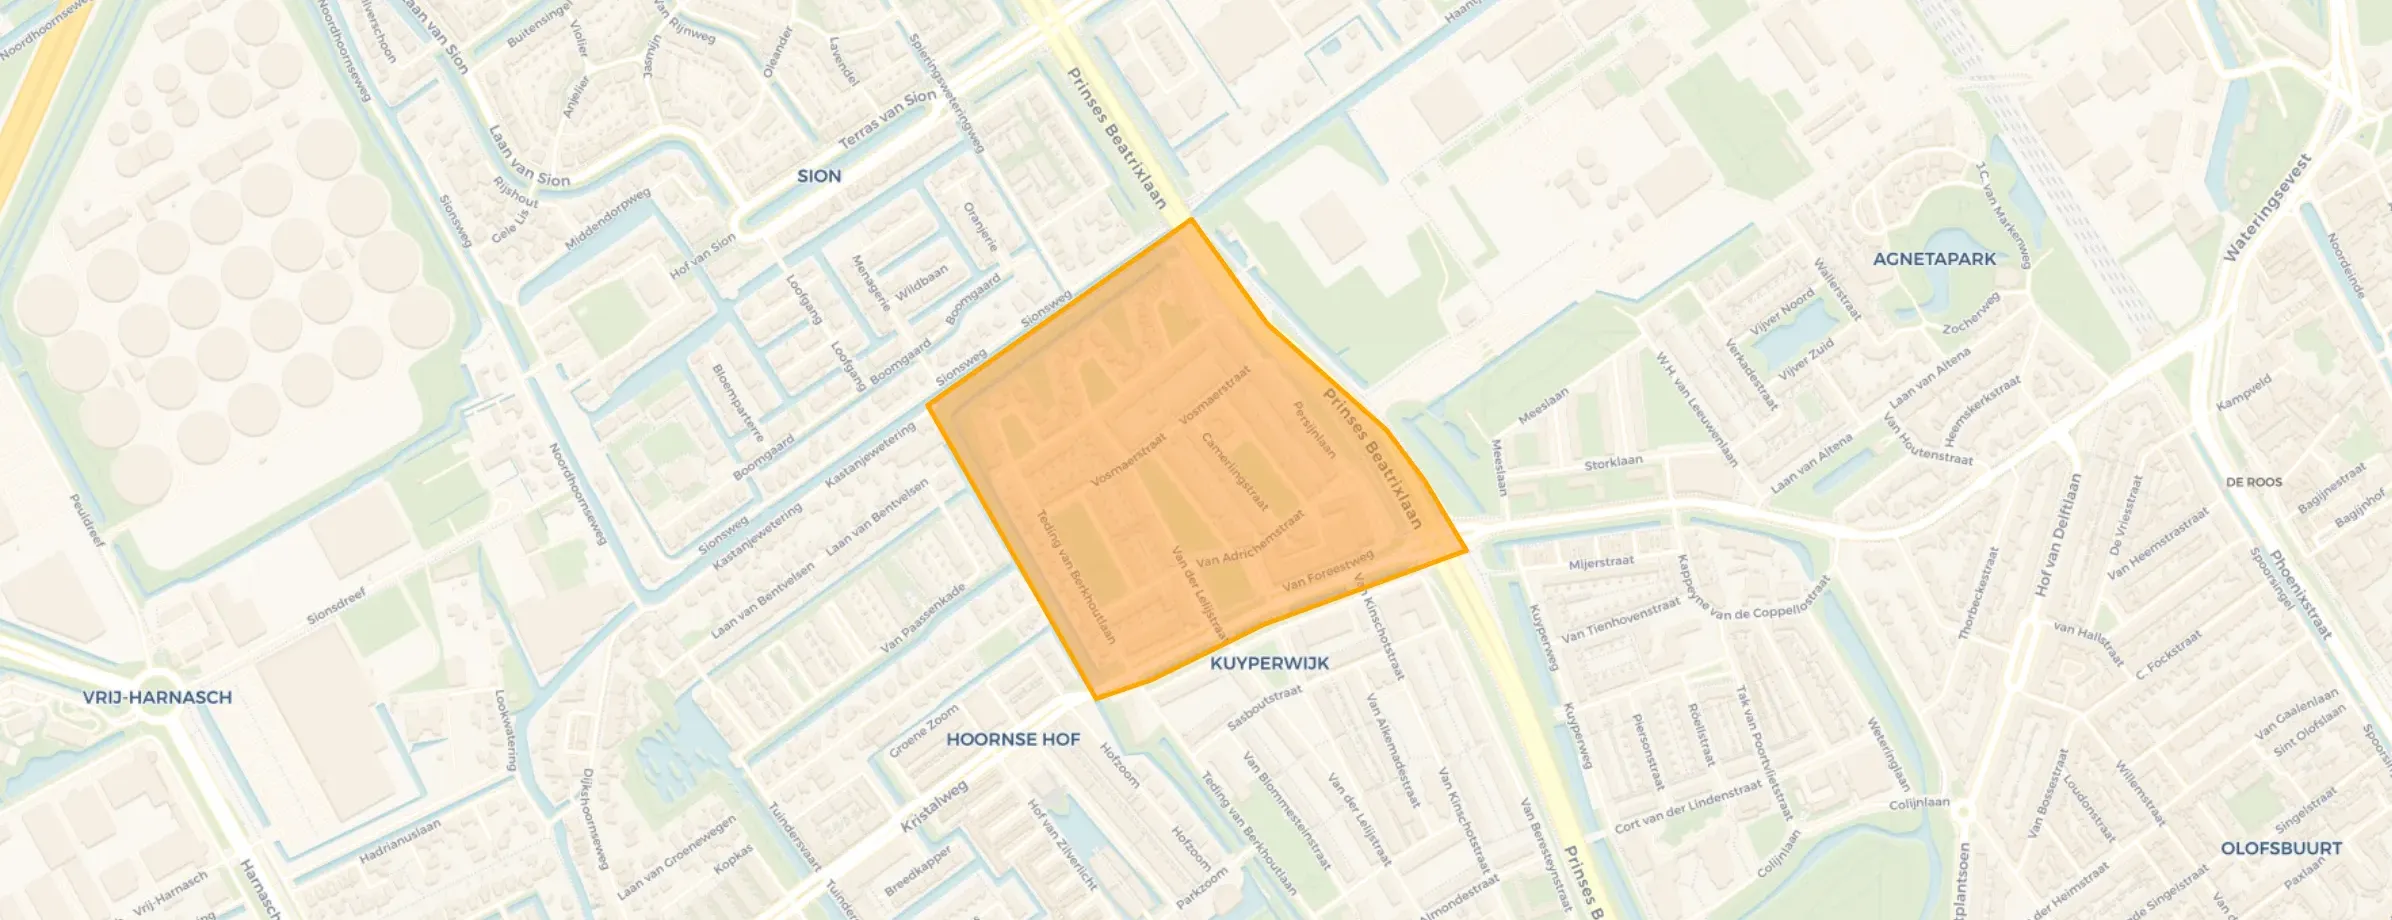
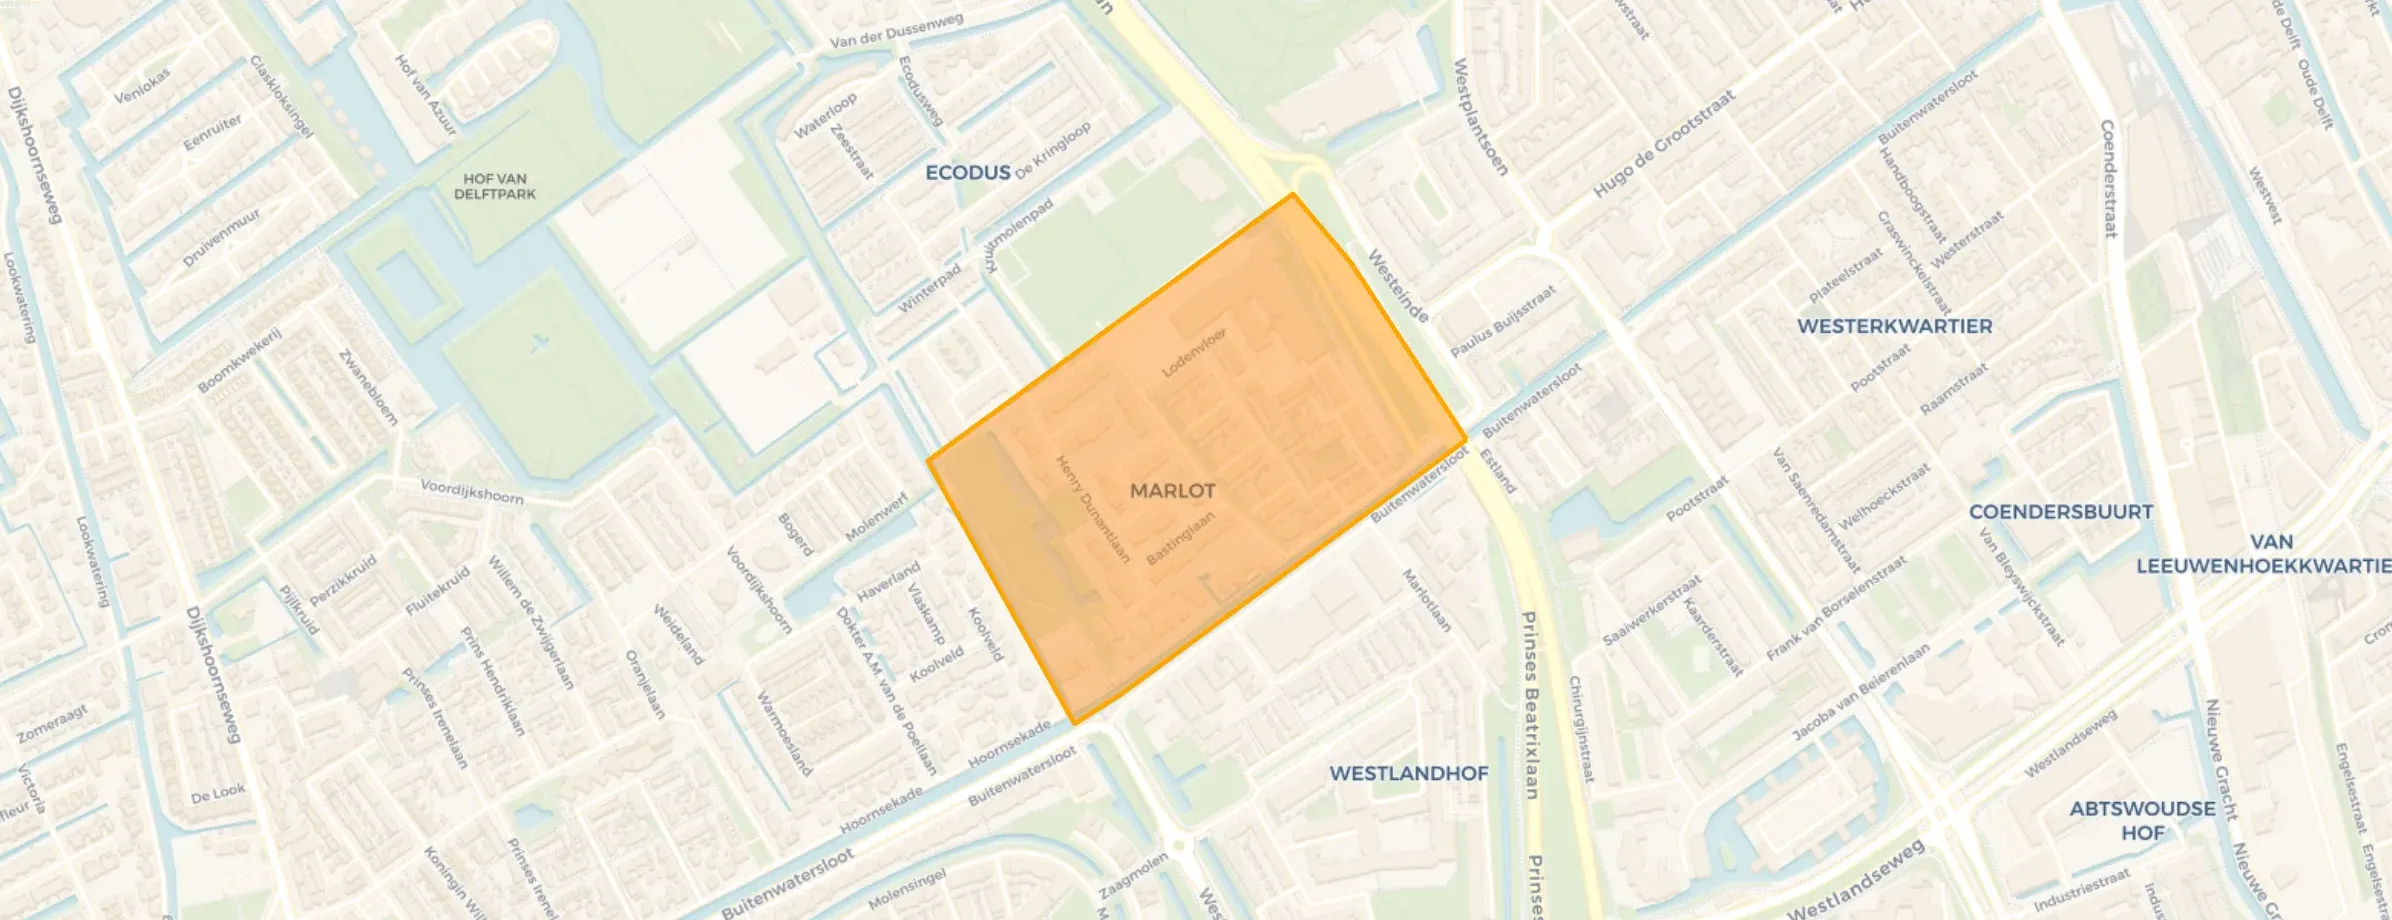
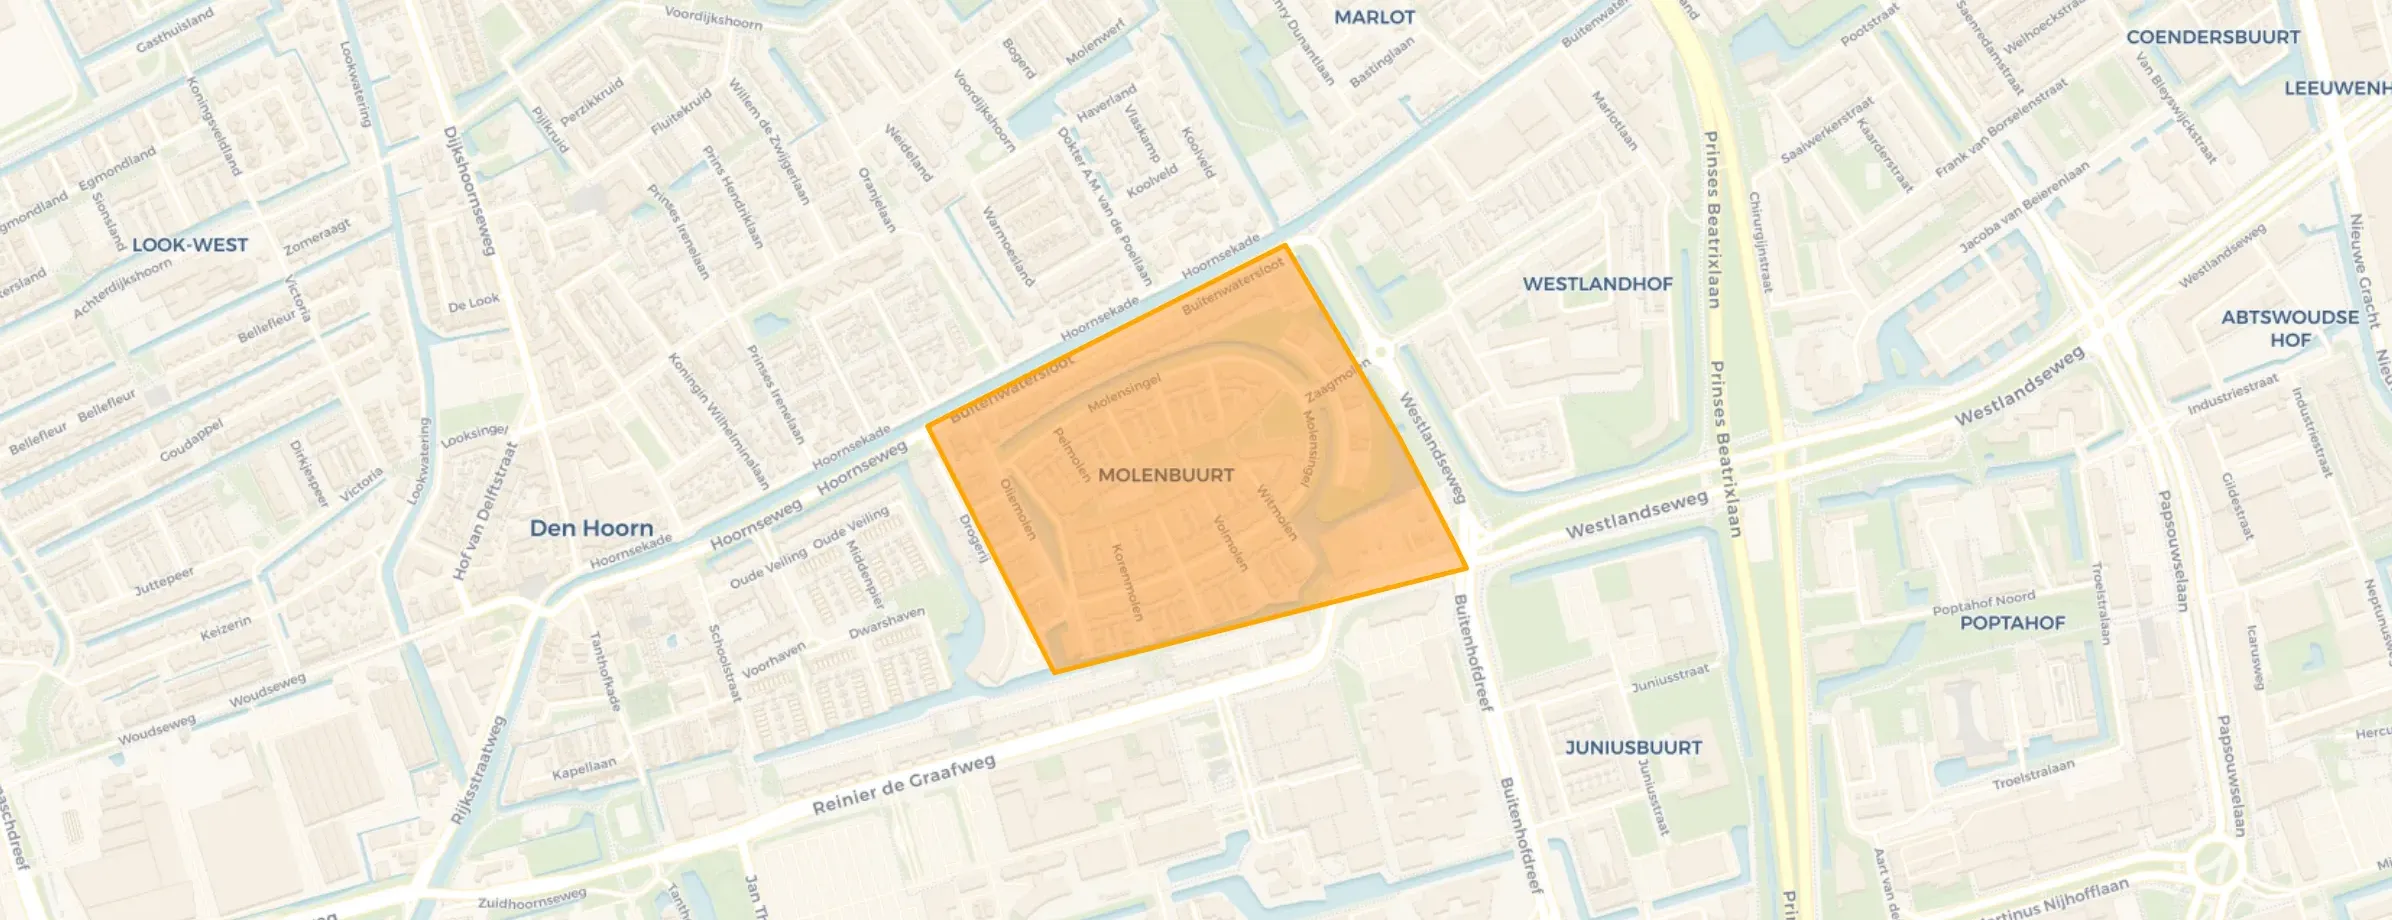
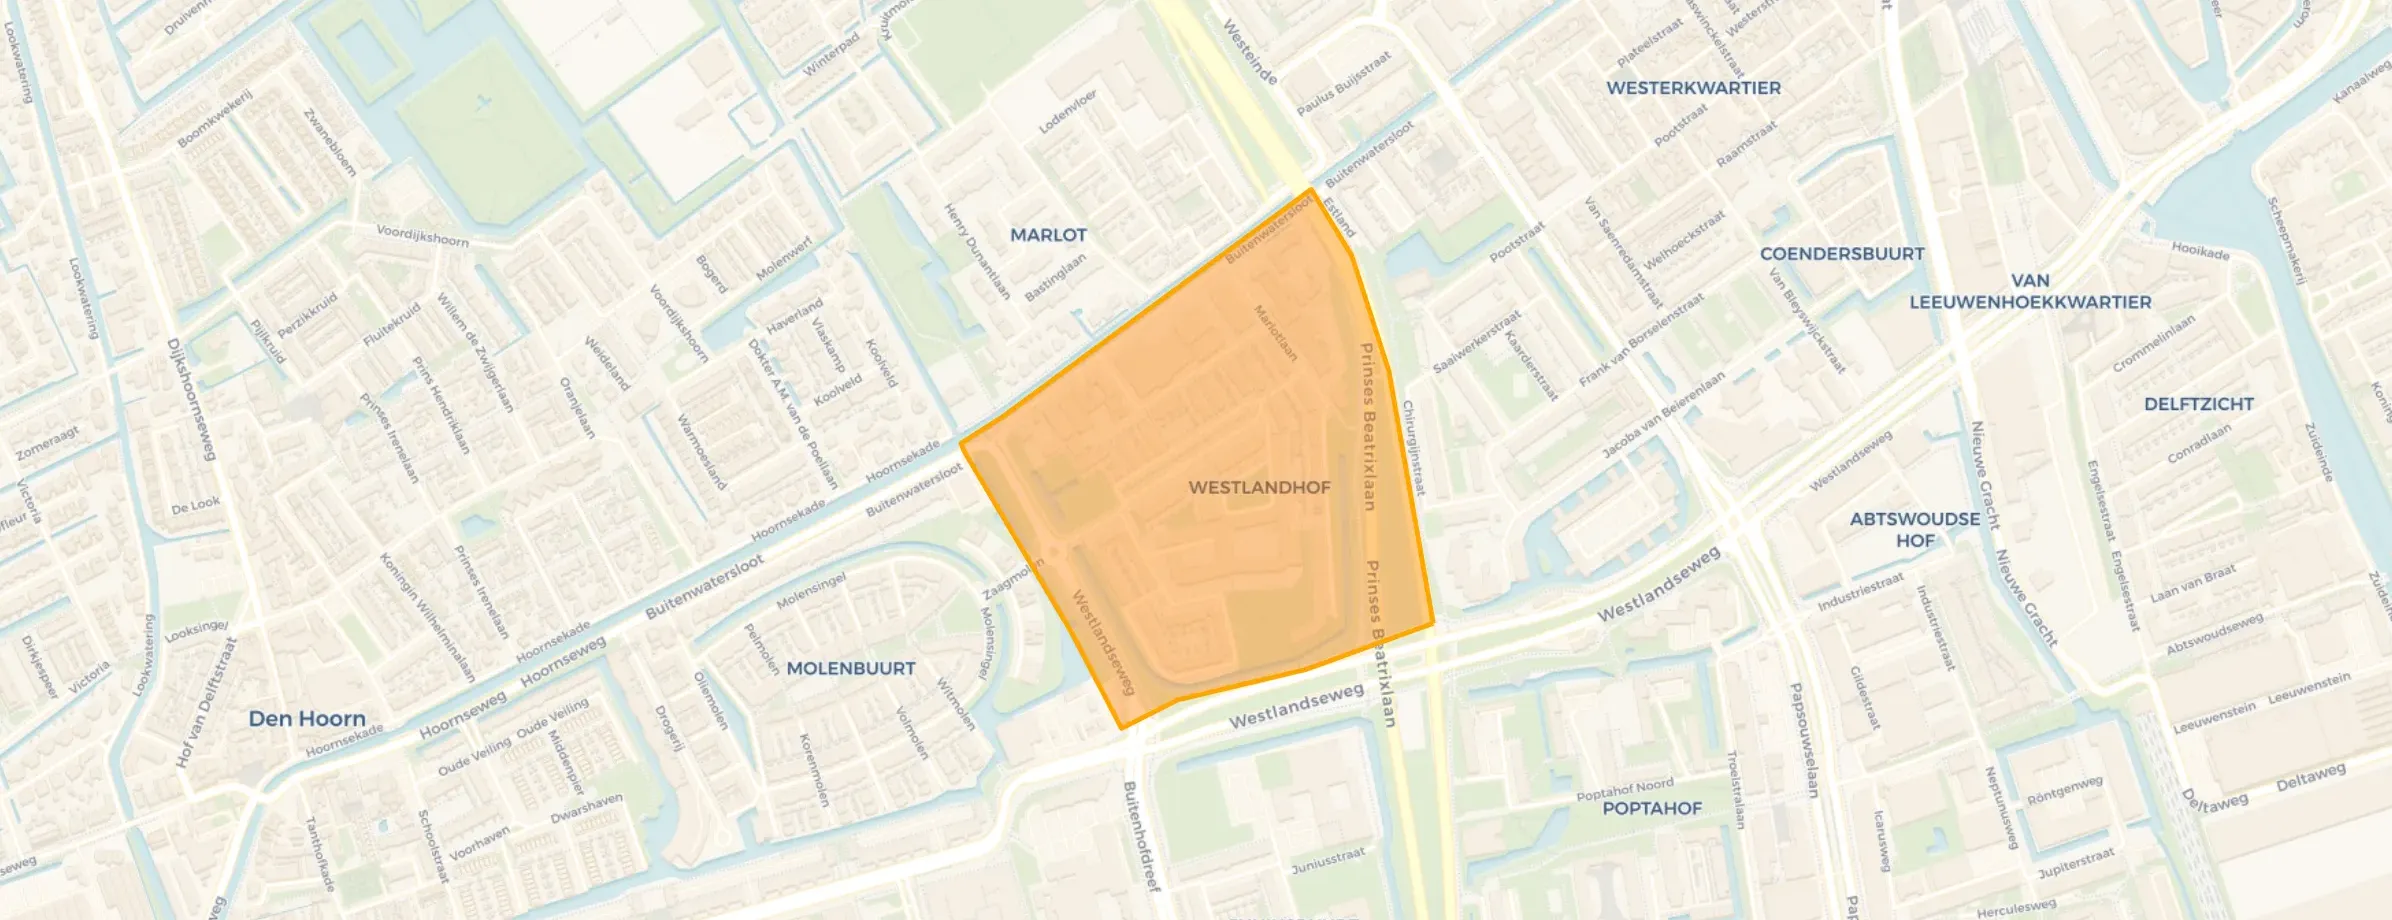
Voordijkshoorn is located in the province of Zuid-Holland, in the municipality of Delft The district has a total area of 161 hectares, of which 156 hectares are land and 5 hectares are water. The district is coded as WK050314. The postcode area is 2614AA-2625DA.
Voordijkshoorn has 12.775 residents. Of these, 50,8% are men and 49,2% are women. Most residents are 25 to 45 years (29,5%). The other age groups are 24,7% for '45 to 65 years', 20,2% for '0 to 15 years', 13,9% for '65 years or older' and 11,7% for '15 to 25 years'. Of the residents, 55,2% is unmarried, 34,9% is married, 7,1% is divorced and 2,8% is widowed. 8.390 residents originate from the Netherlands, 1.165 come from Europe and 3.220 come from countries outside Europe.
There are 5.865 households in Voordijkshoorn. 41,3% of these are single-person households, 23,0% households without children and 35,6% households with children. The average household size is 2,2 persons.
In Voordijkshoorn there are 9.700 income recipients. The average income per income recipient is €43.200, which is €7.400 (21%) higher than the national average of €35.800. Per resident, the average income is €33.300, which is €4.100 (14%) higher than the national average of €29.200. Most residents of Voordijkshoorn are highly educated. 46,8% have a university or higher professional education (HBO/WO), 32,9% have an intermediate education (HAVO, VWO or MBO 2-4) and 20,3% have a lower education (VMBO or MBO 1).
Of the 12.775 residents, around 67% are in paid employment, which amounts to 8.559 people. This is 2% higher than the national average of 65%. The majority of workers are in salaried employment (86%), while 14% are self-employed. In Voordijkshoorn, 18% of residents receive a benefit. The largest group is those receiving a state pension (AOW). 1.510 people receive this benefit.
In Voordijkshoorn there are 5.751 homes with an average assessed value (WOZ) of €391.000. Of these, around 97% are occupied and 3% unoccupied. In Voordijkshoorn there are roughly as many rental as owner-occupied homes. This amounts to 49% rental homes and 51% owner-occupied homes. Of the homes, 51% privately owned, 35% owned by housing associations and 14% owned by other landlords. The most common construction periods in Voordijkshoorn are 1950-1970 (39%) and 1990-2000 (20%).
There are currently no homes for sale in Voordijkshoorn. The most recently listed home is Antonia Veerstraat 4 by Van Daal Makelaardij | De Energieke Makelaar op Funda. No homes were sold in Voordijkshoorn over the past year.
There are currently no homes for rent in Voordijkshoorn. The most recent home is De Hoop 17, offered by Huispedia. No homes were let in Voordijkshoorn over the past year.
No recent rental data available for Voordijkshoorn.
In Voordijkshoorn there are 5.850 addresses with a registered energy label. The most common labels are A (41%), C (17%) and B (15%). On average, an address in Voordijkshoorn uses 2.360 kWh of electricity per year. This is 16% below the national average of 2.810 kWh. With an annual consumption of 600 m³ per address, natural gas consumption is 53% below the national average of 1.280 m³.
A good experience, they have everything you need like a football field, a supermarket, a snack bar, etc. There are also many schools. Everything in Den Hoorn is well organised. Safety is good because nothing crazy ever happens, and there isn't much litter either.
Auto-translated to English by AIThe neighbourhood is deteriorating very quickly unfortunately. Rubbish is increasingly being dumped next to containers, more drug-using residents and their associated dealers. Hardly any parking spaces left for visitors, the surrounding neighbourhoods come here to park to avoid paid parking in their own area, the church musicians park the area full of expensive cars on Wednesday evenings. The general condition of older homes is poor despite renovation. Cracks in balconies and ceilings are hidden under coating, insulation or paint. The new-build owner-occupied homes have brought a lot of antisocial people (not from Delft) with them, making the playground less fun for the children who grew up here and leaving a lot of rubbish behind. Cars are parked on street corners, making it impossible to see as a road user. Cars are parked on passing and refuge areas, on Van Kinschotstraat, cars are half in the middle of the road up to beyond the designated parking spaces at the bus crossing. In short, the neighbourhood is increasingly busy and increasingly antisocial. Not to mention the perspective houses in between that cause nuisance. Old residents who have lived here for years and are moving because of nuisance-causing new neighbours, it's all just possible nowadays. Don't forget the housing associations, taking responsibility for overdue maintenance, serious defects and living nuisance, Stedelink and Woonbron also don't. The low flats near the bicycle tunnel are completely disfiguring the neighbourhood, people dump everything by the container or on the street there. That landlord also doesn't show himself. Enforcement is never there either and I haven't seen the neighbourhood police officer in 28 years.
Auto-translated to English by AI
The housing stock is mainly post-war — 51% was built between 1945 and 1990. In addition, the most common type is flats (56%).
Over the past year a home for sale in Voordijkshoorn was listed for an average of €534,846 (€5,304 per m²). Last quarter prices fell by 9%.
A rental home in Voordijkshoorn cost an average of €2,380 per month (€20 per m²).
Wijk Voordijkshoorn has 12,775 residents. The largest age group is 25 to 45 years (30%). Many families: 36% of the households have children.
The housing supply in Voordijkshoorn is remarkably efficient: 59% has an A, A+ or B label. The average natural gas consumption per household is 600 m³ per year.
From Voordijkshoorn you can on average reach a supermarket at 0.9 km, a GP at 0.5 km, a railway station at 2.5 km, a primary school at 0.7 km (as the crow flies, source: CBS).
Right now you will find 37 homes for sale and 6 homes for rent in Voordijkshoorn.

Buurtje.nl uses cookies to make the site work and to improve it. In doing so, we process data such as your IP address and the pages you visit.
We use this data for three purposes: running the website (functional), measuring visits so we can improve Buurtje.nl (analytics), and — if you allow it — tailoring ads to your interests (marketing).
How we handle your data is described in our privacy policy. You can change your preferences at any time via 'Cookie preferences' at the bottom of every page.
Choose per category which cookies we may place. Read more in our privacy policy.