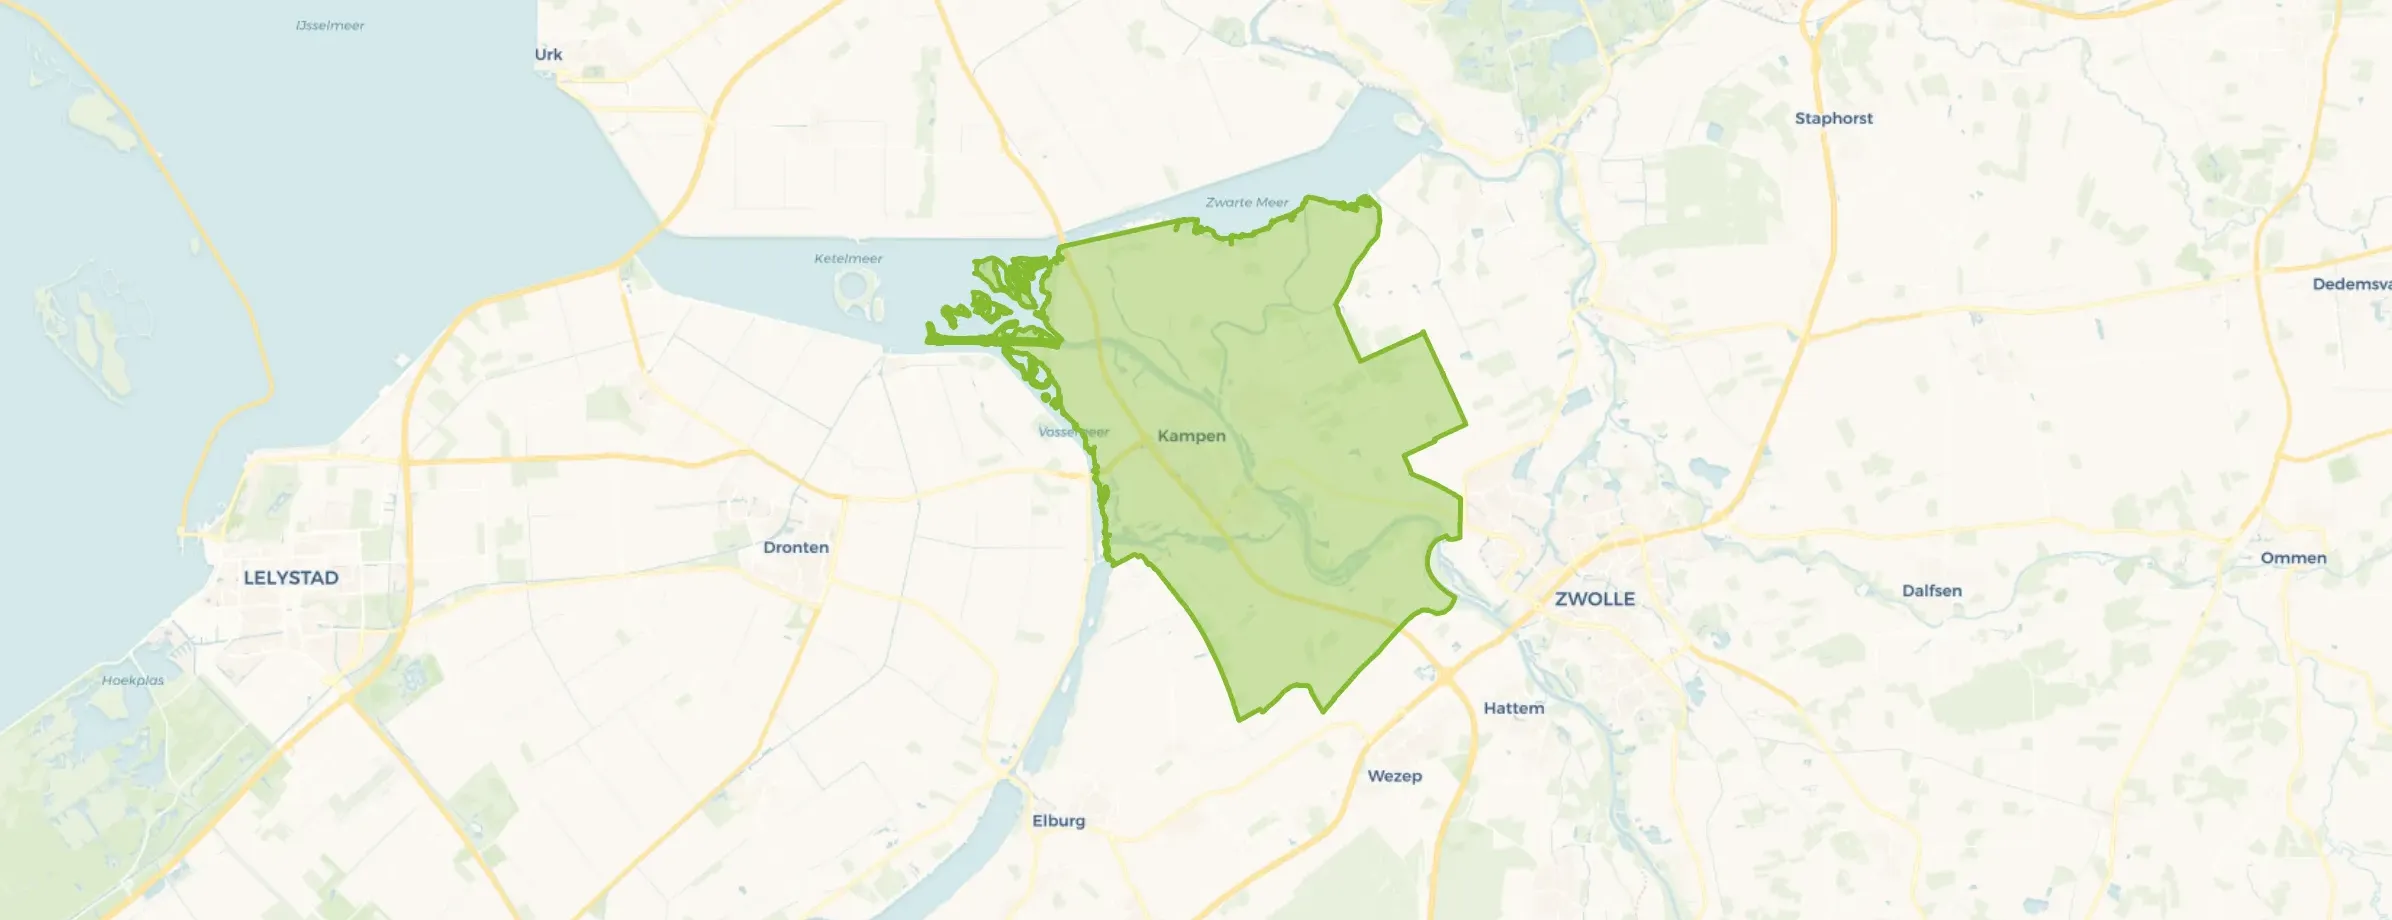
Municipality in Overijssel
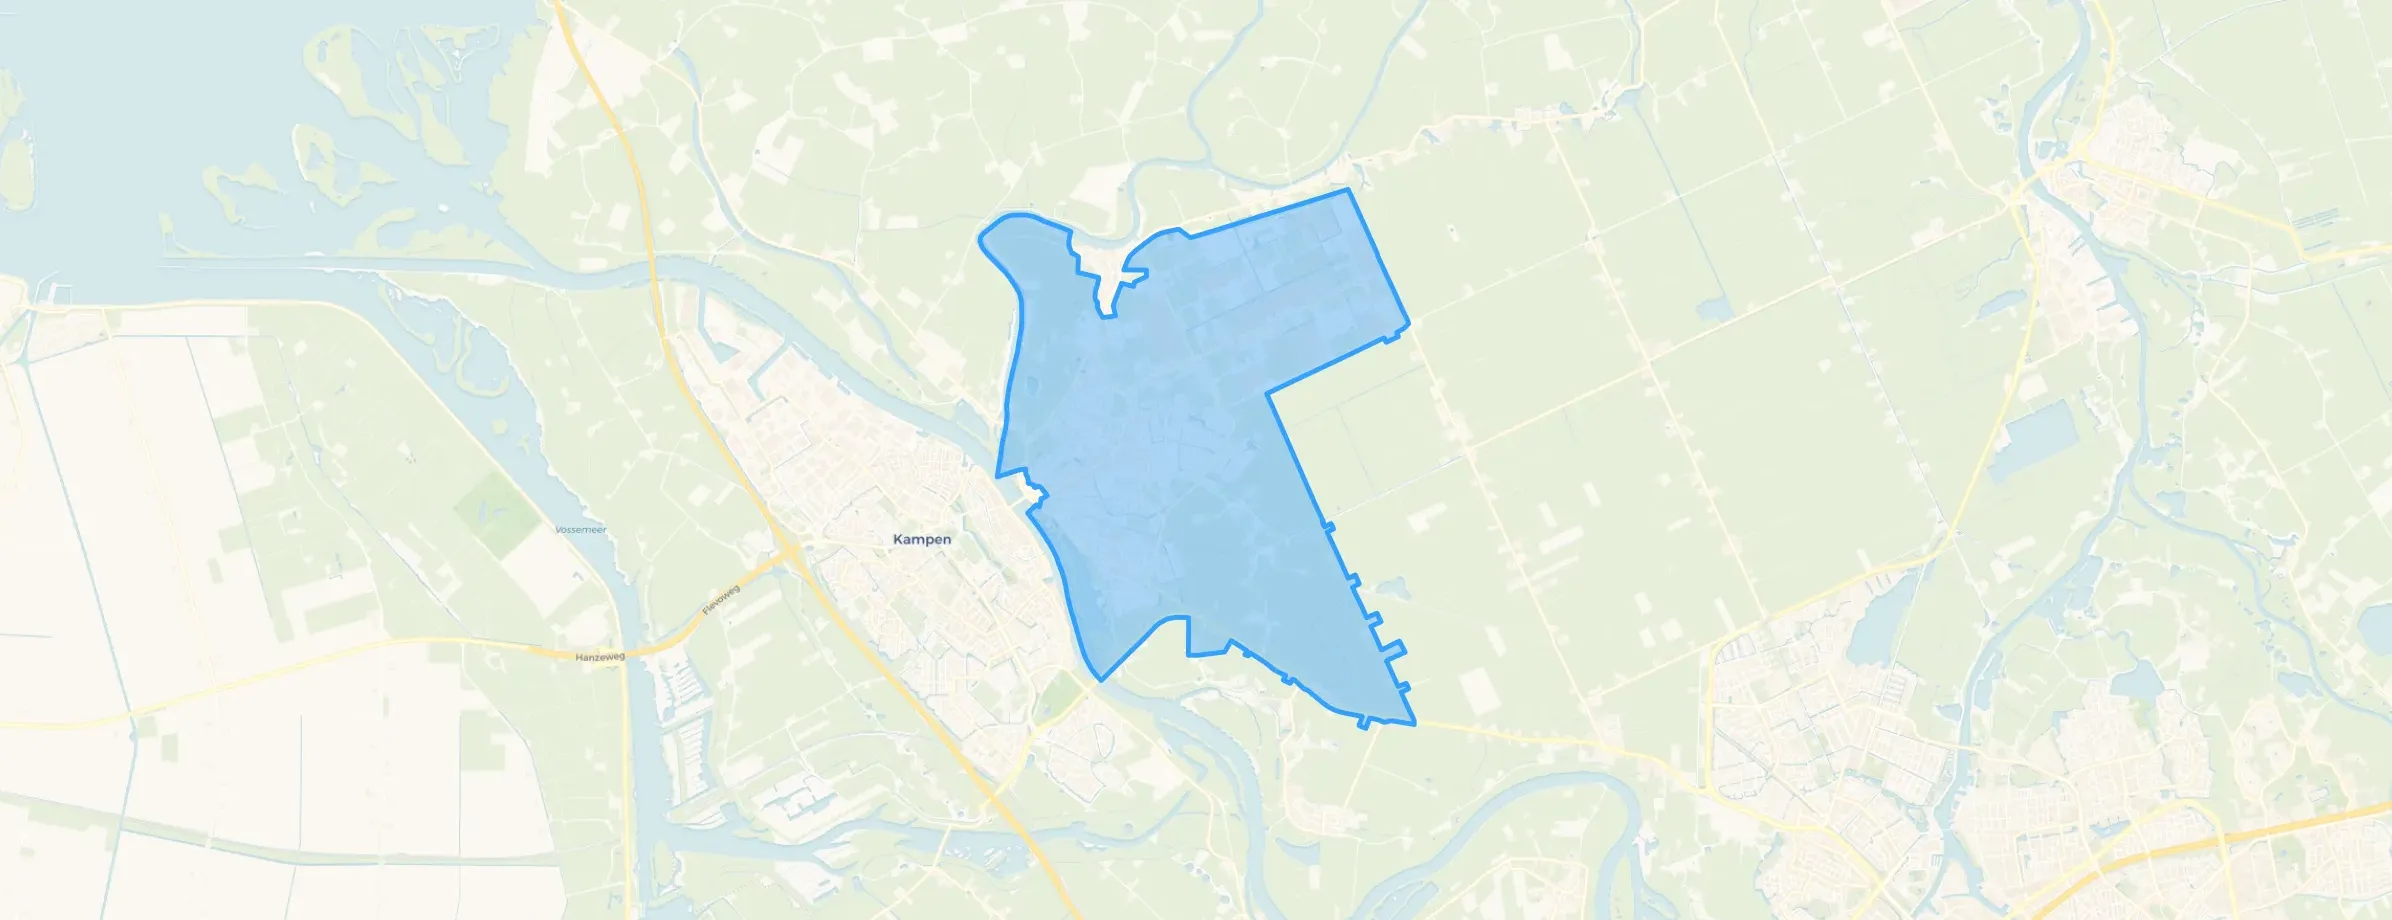
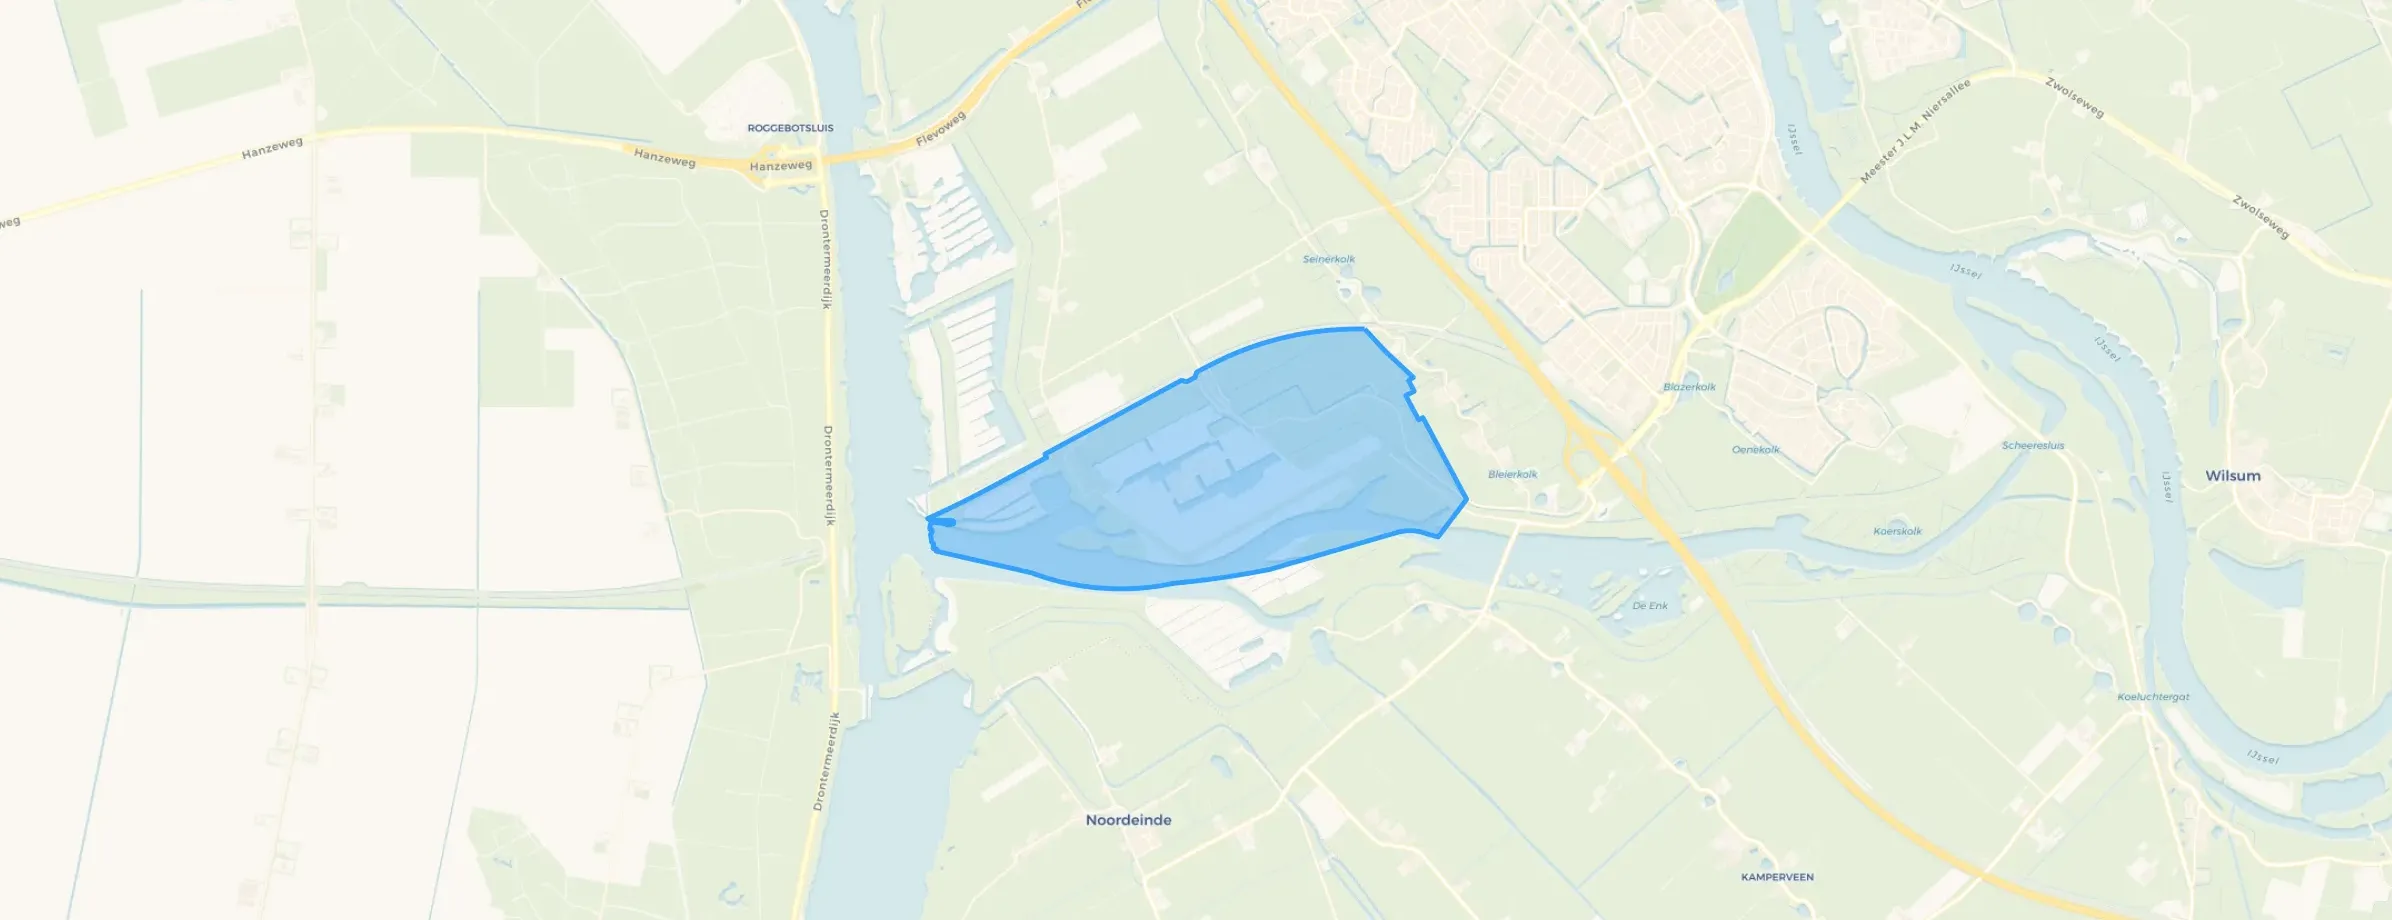
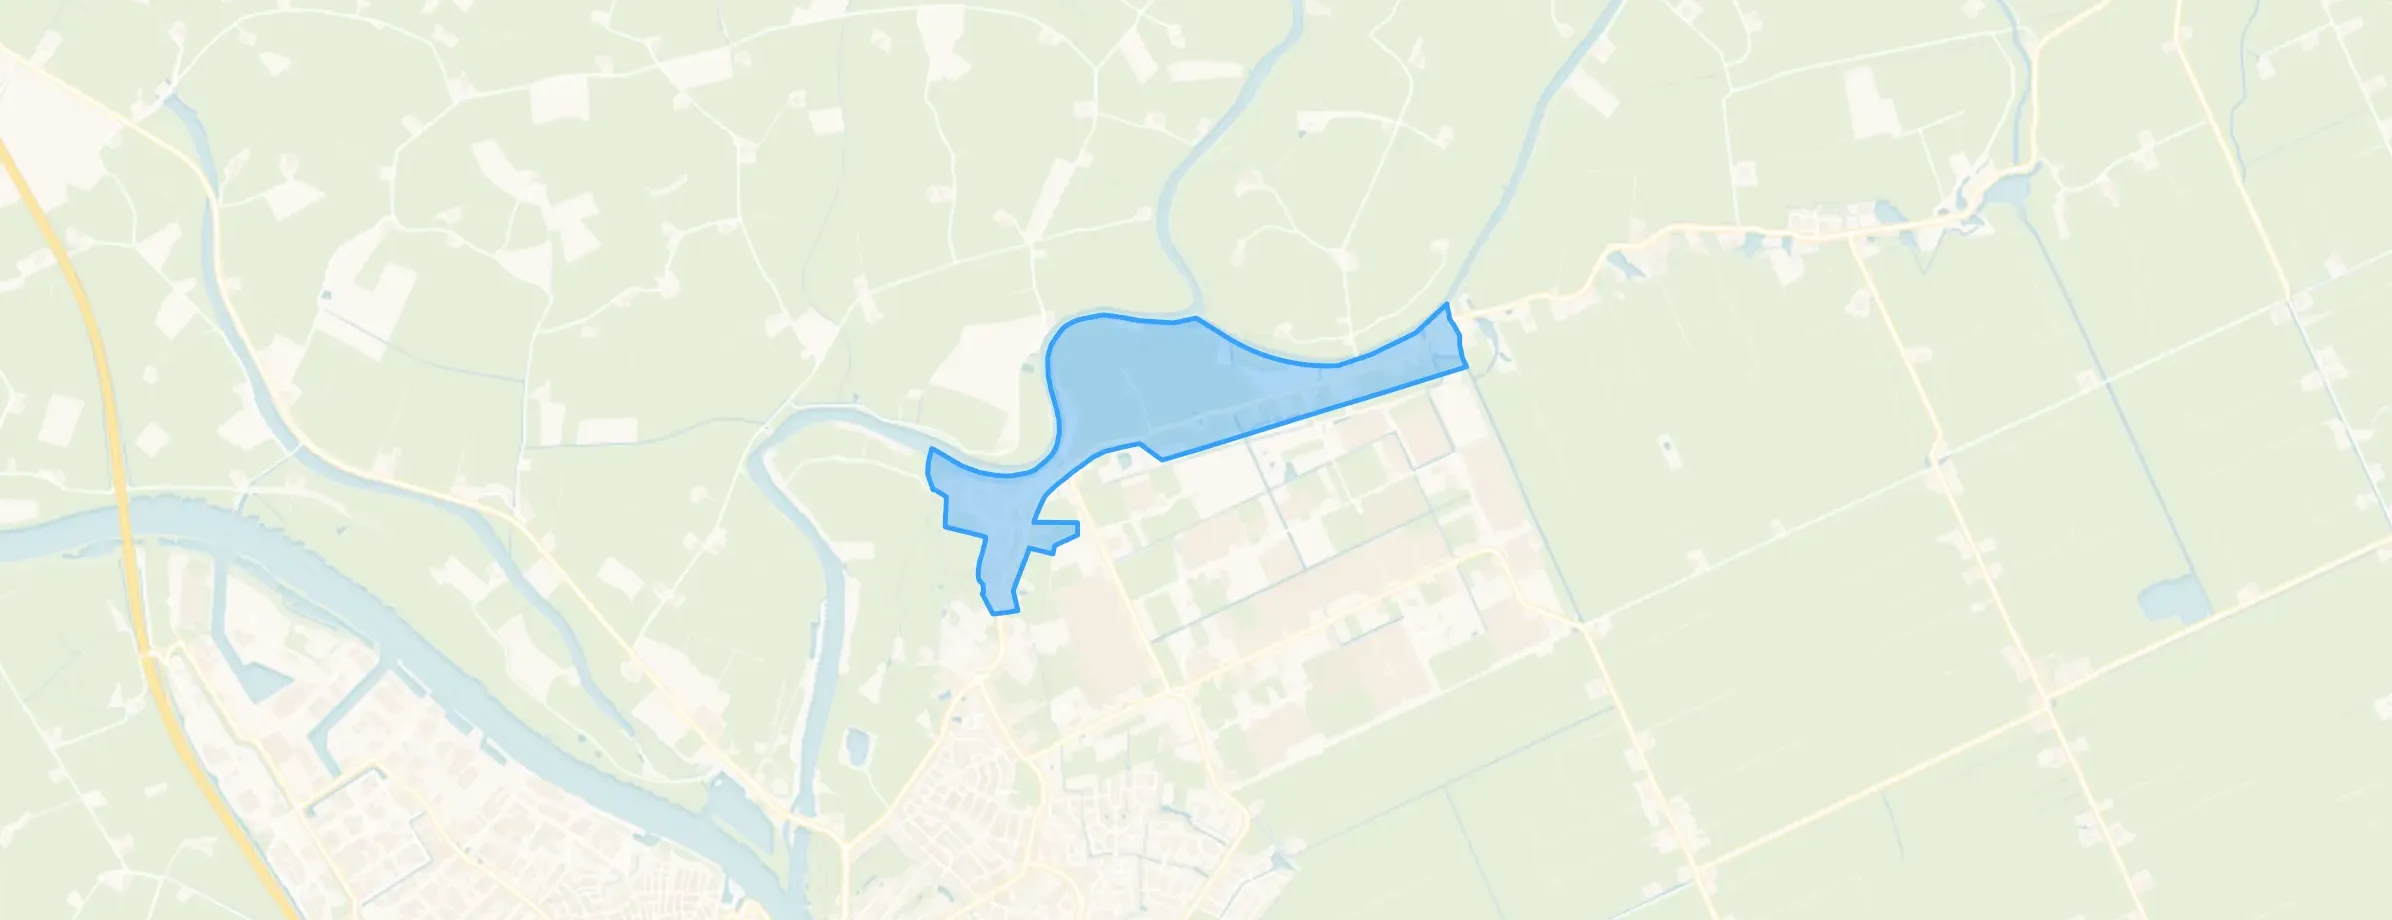
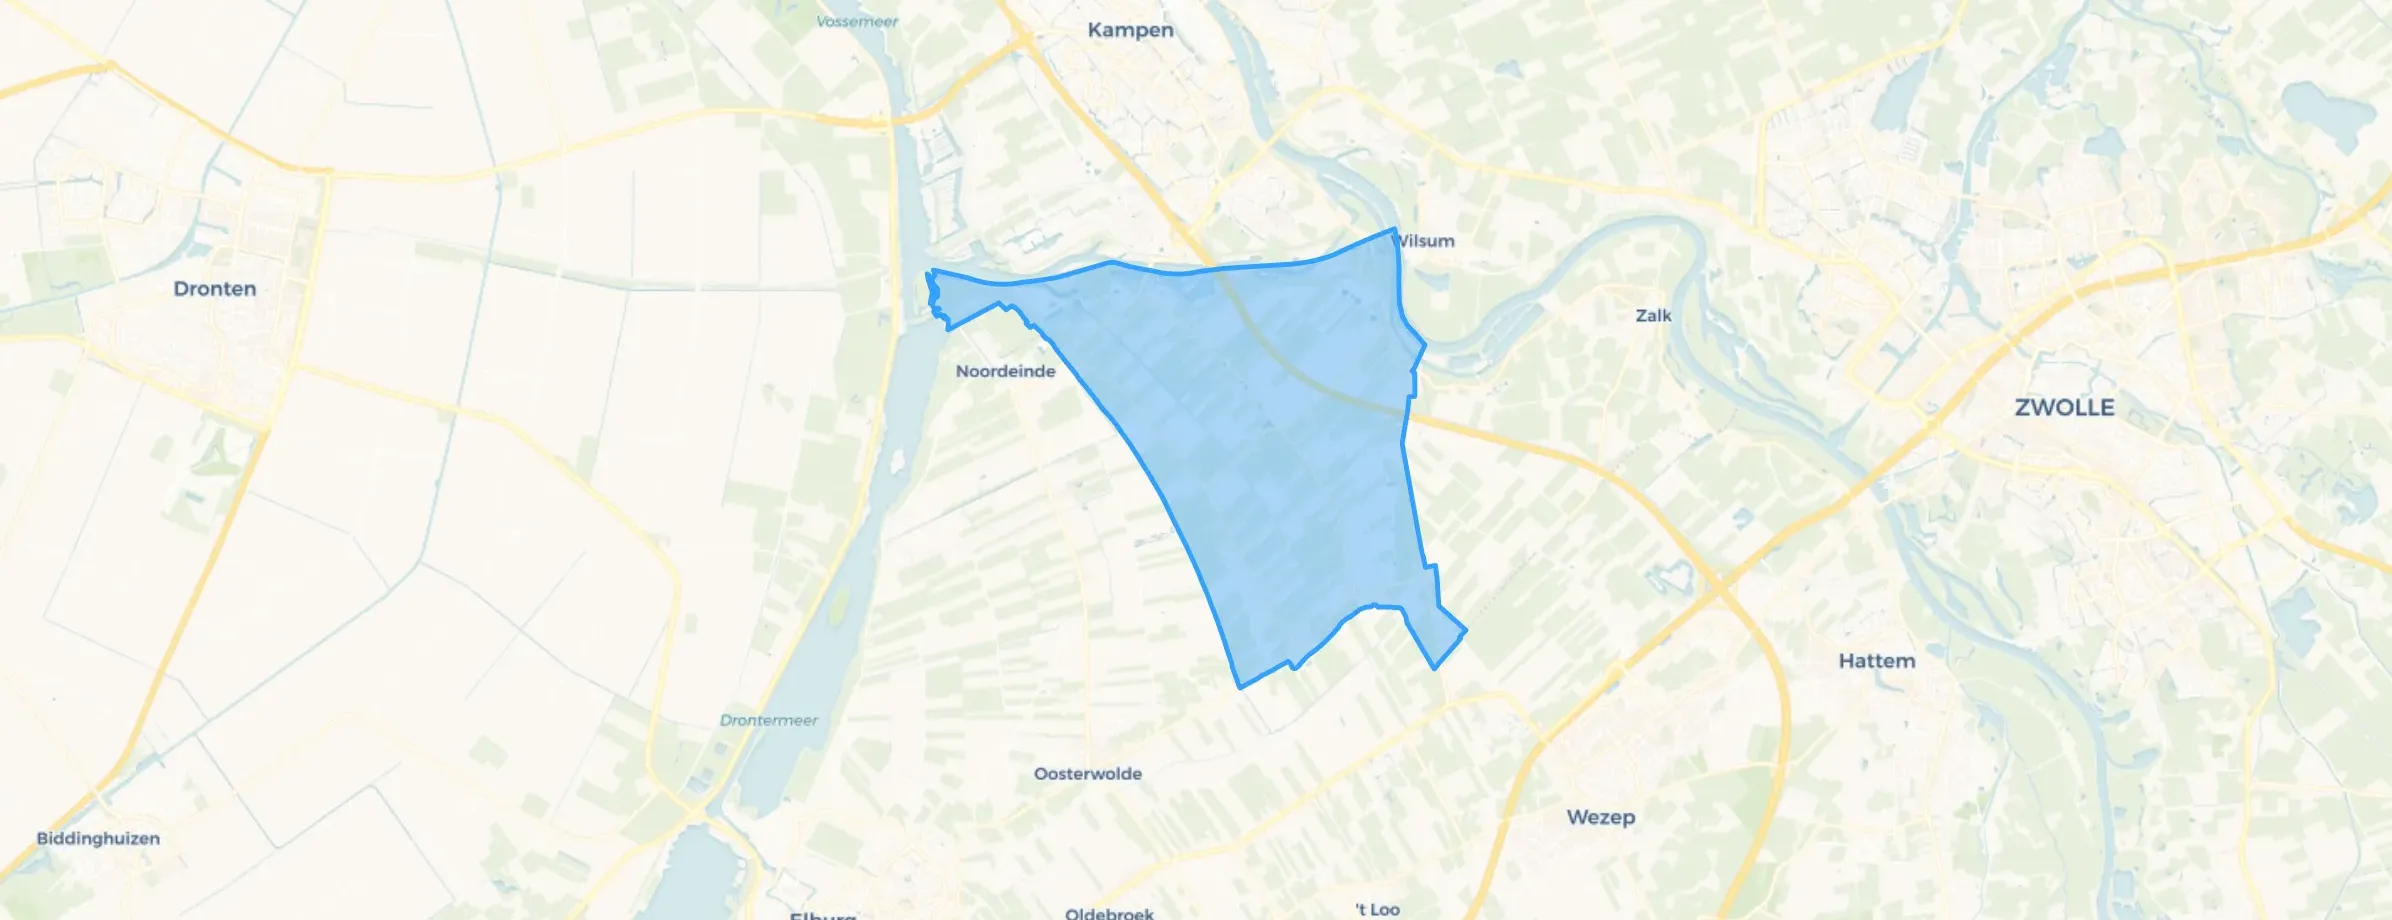
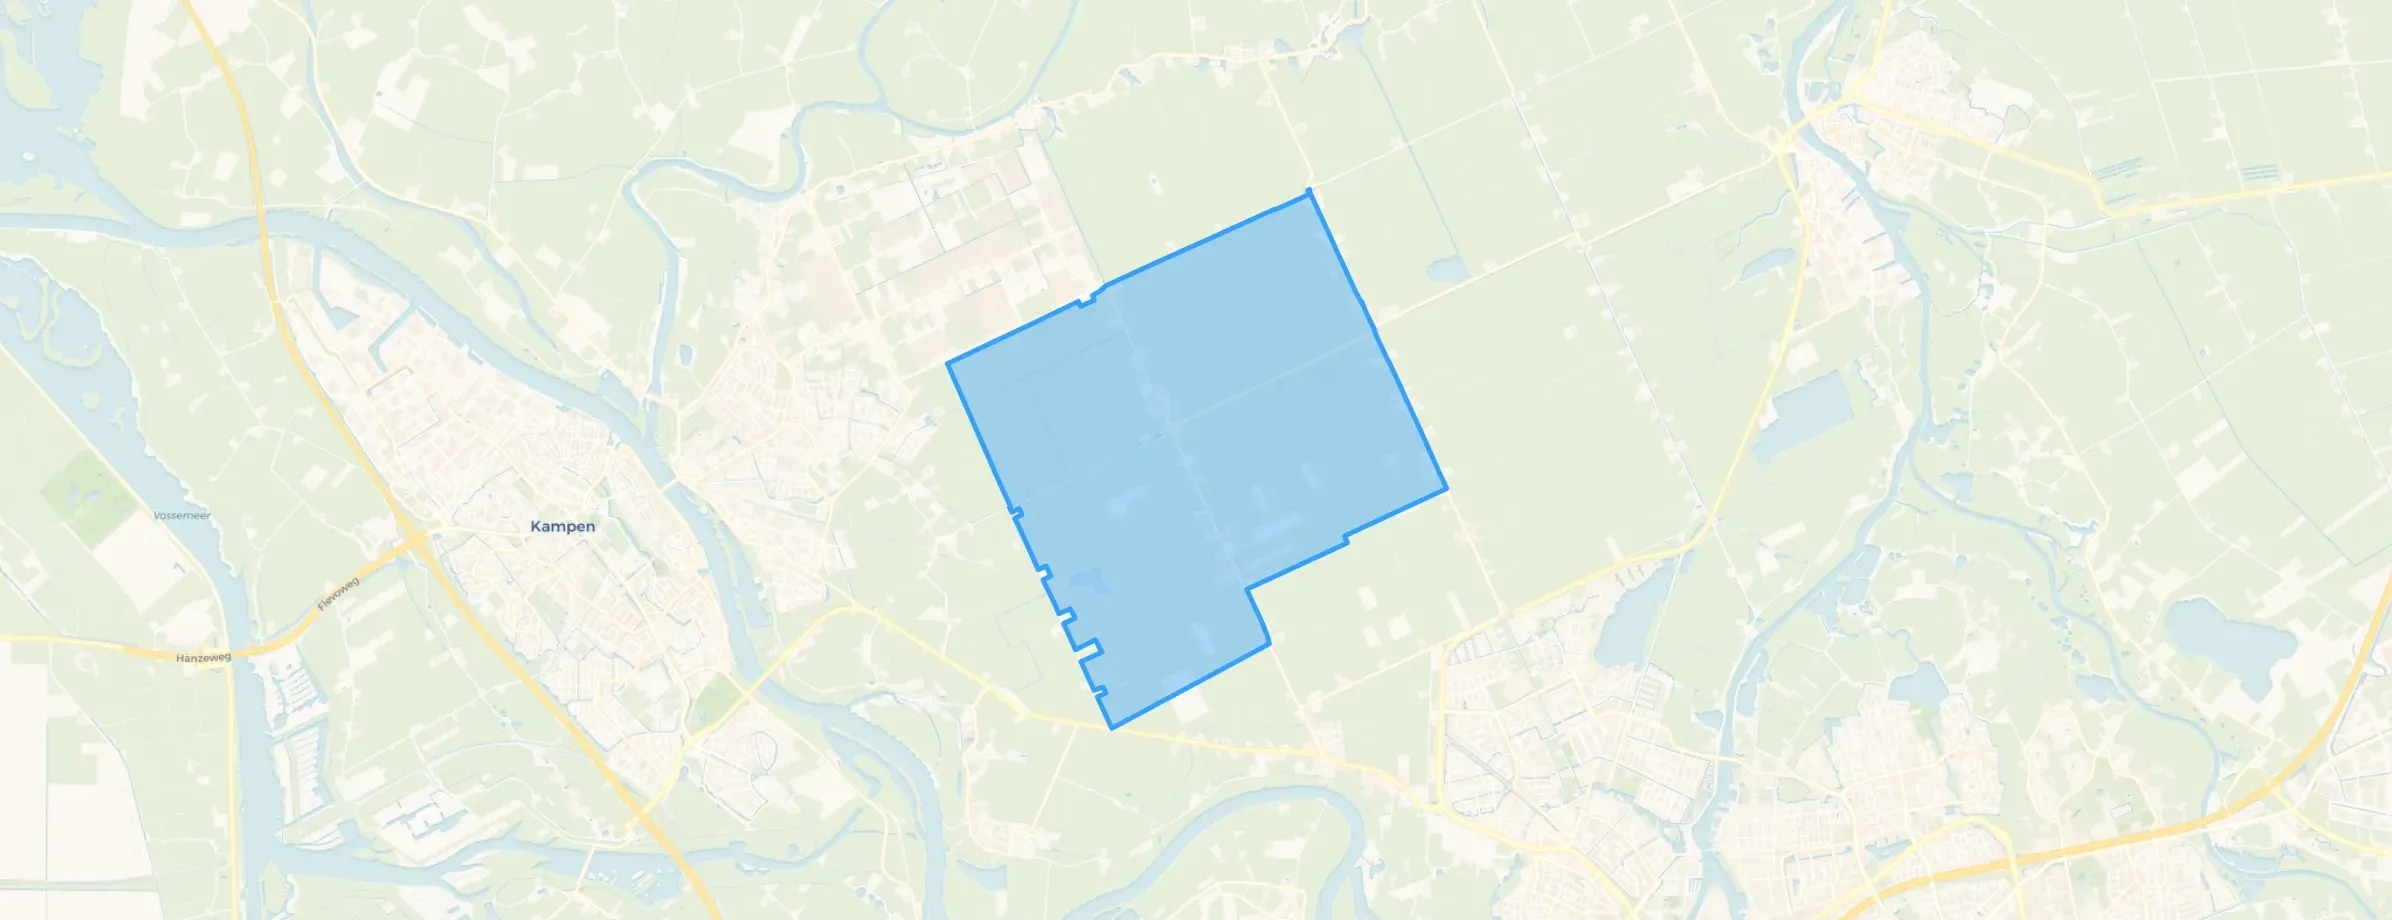
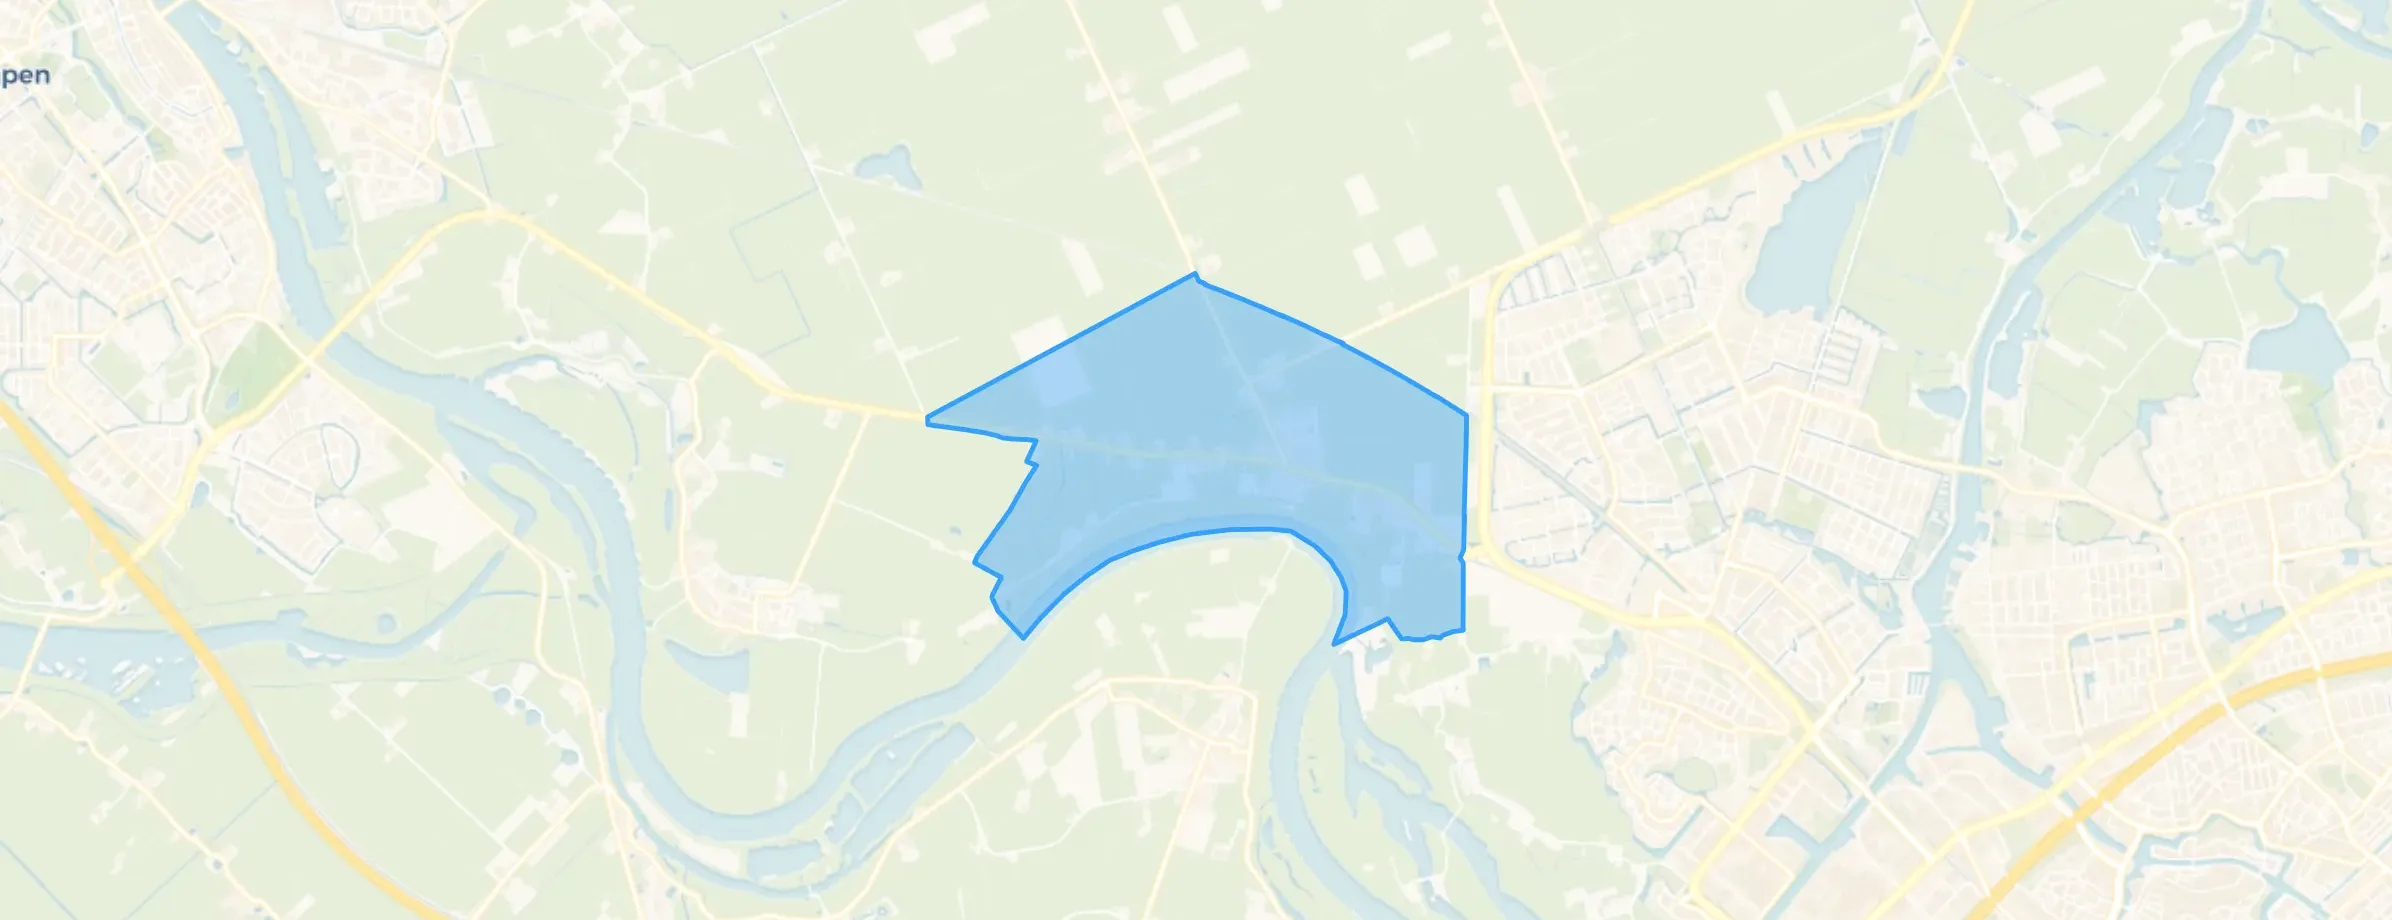
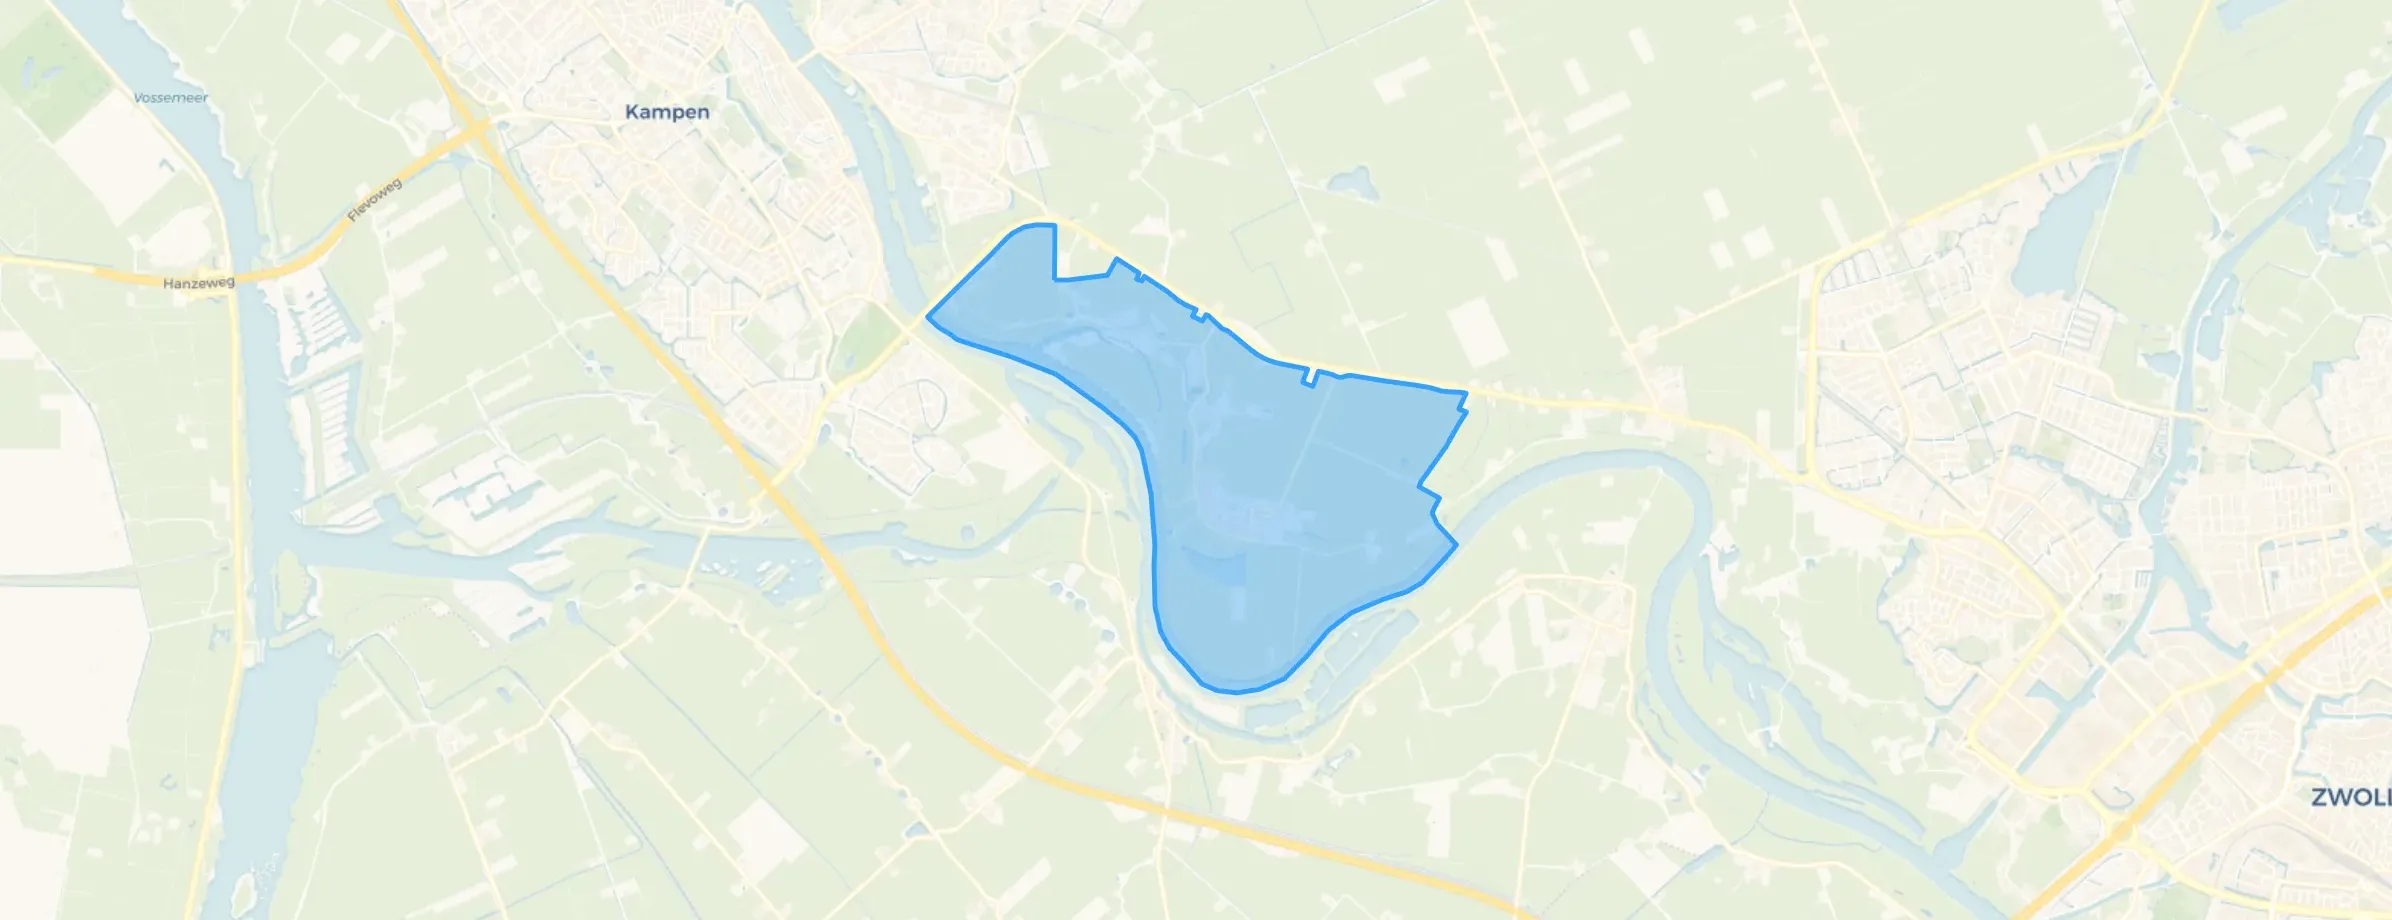
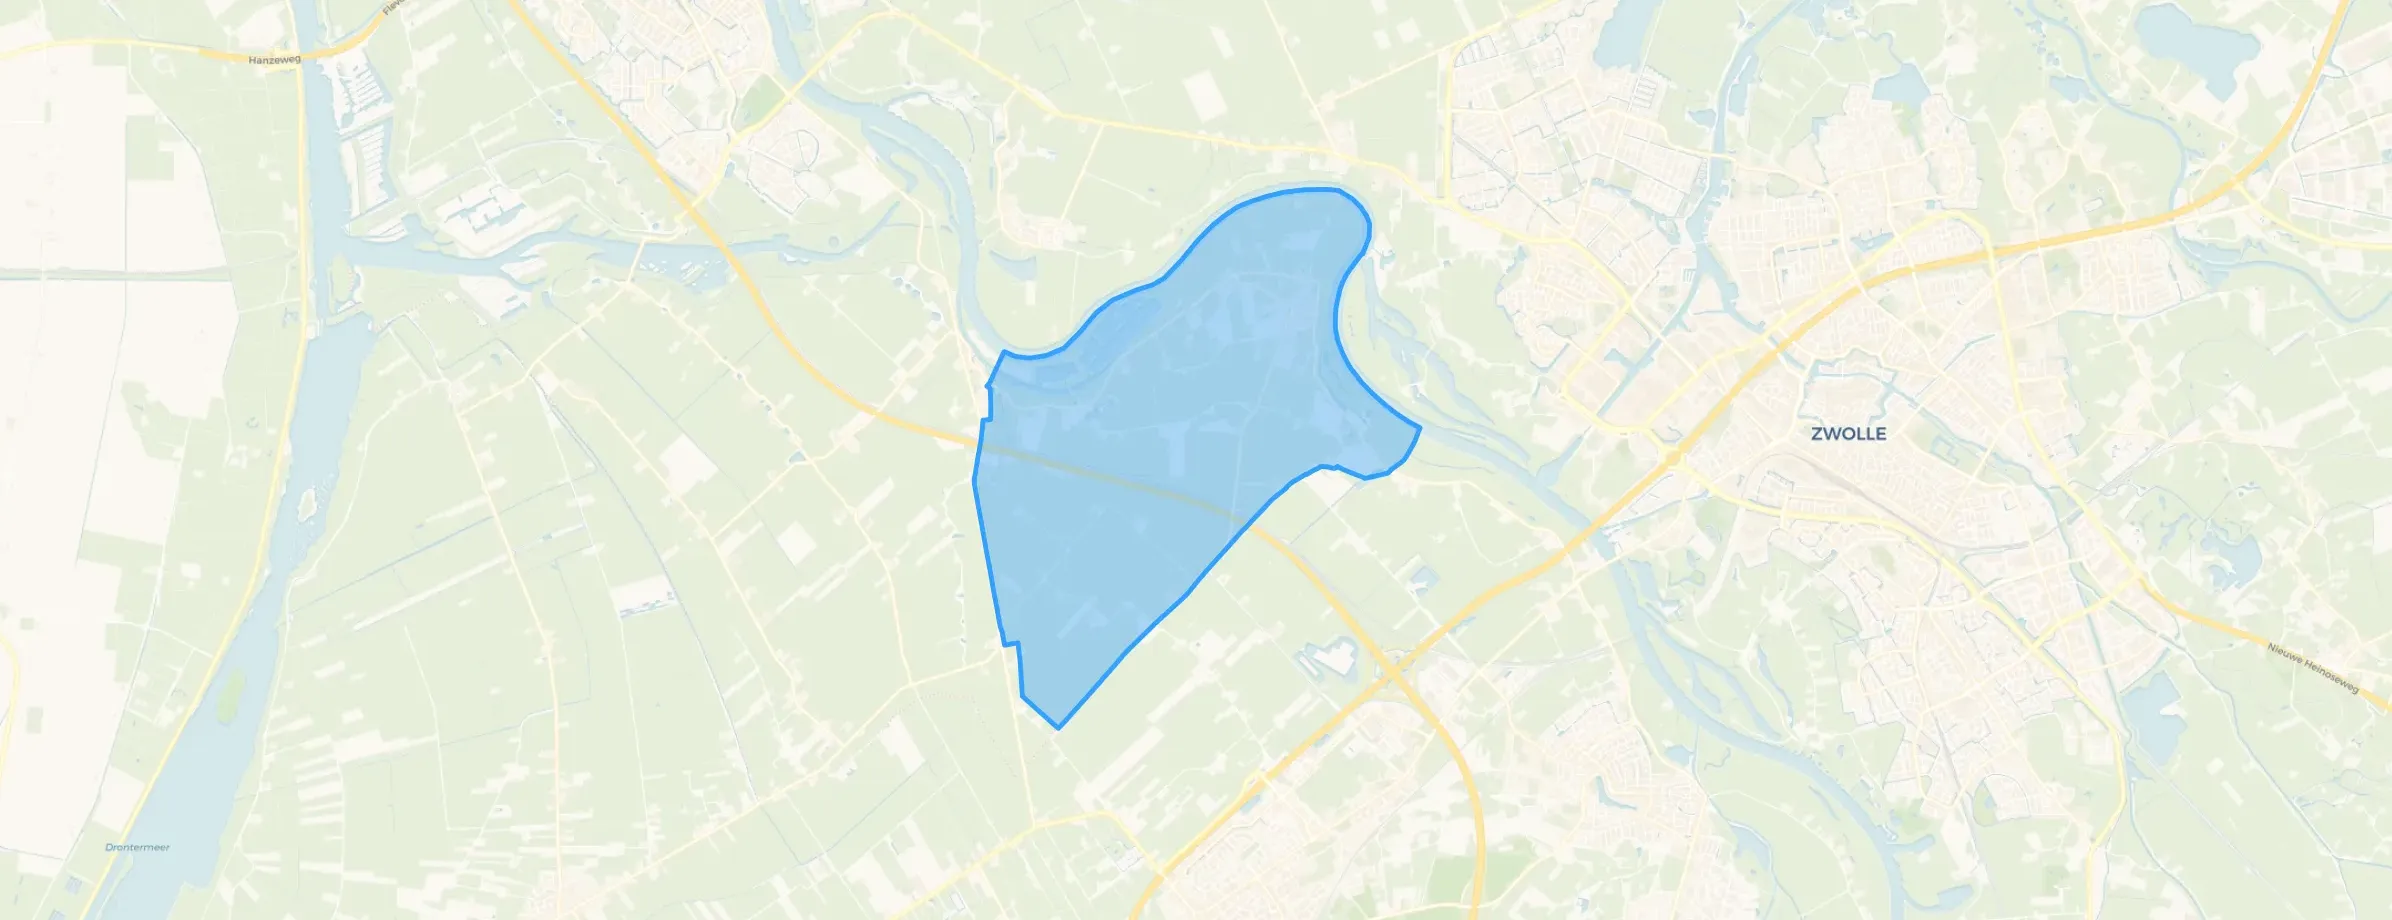
Kampen is located in the province of Overijssel The municipality has a total area of 16.179 hectares, of which 14.123 hectares are land and 2.056 hectares are water. The municipality is coded as GM0166. The postcode area is 8261AA-8293PG.
Kampen has 56.547 residents. Of these, 50,1% are men and 49,9% are women. Most residents are 25 to 45 years (25,6%). The other age groups are 24,8% for '45 to 65 years', 18,3% for '65 years or older', 18,3% for '0 to 15 years' and 12,9% for '15 to 25 years'. Of the residents, 46,3% is unmarried, 43,5% is married, 5,9% is divorced and 4,3% is widowed. 49.061 residents originate from the Netherlands, 2.553 come from Europe and 4.933 come from countries outside Europe.
There are 23.359 households in Kampen. 32,7% of these are single-person households, 29,0% households without children and 38,3% households with children. The average household size is 2,4 persons. The national average is 2,1 persons.
In Kampen there are 44.300 income recipients. The average income per income recipient is €37.700, which is €4.500 (11%) lower than the national average of €42.200. Per resident, the average income is €30.300, which is €4.600 (13%) lower than the national average of €34.900. Most residents of Kampen are educated to an intermediate level. 45,3% have an intermediate education (HAVO, VWO or MBO 2-4), 28,8% have a lower education (VMBO or MBO 1) and 25,9% have a university or higher professional education (HBO/WO).
Of the 56.547 residents, around 76% are in paid employment, which amounts to 42.976 people. This is 4% higher than the national average of 72%. The majority of workers are in salaried employment (85%), while 15% are self-employed. In Kampen, 23% of residents receive a benefit. The largest group is those receiving a state pension (AOW). 9.330 people receive this benefit.
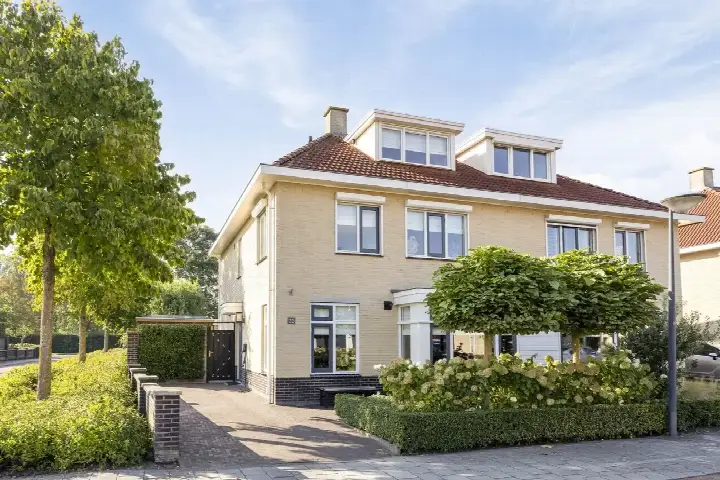
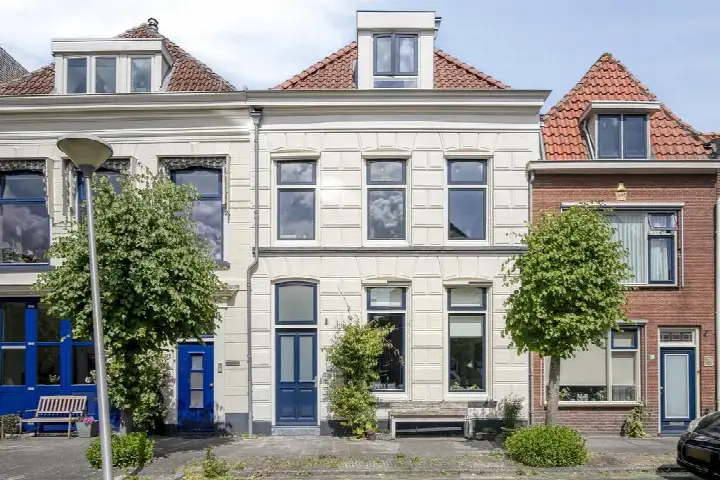
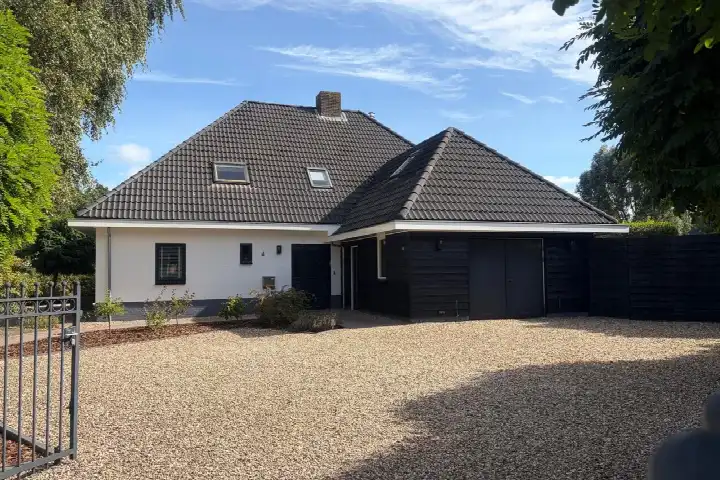
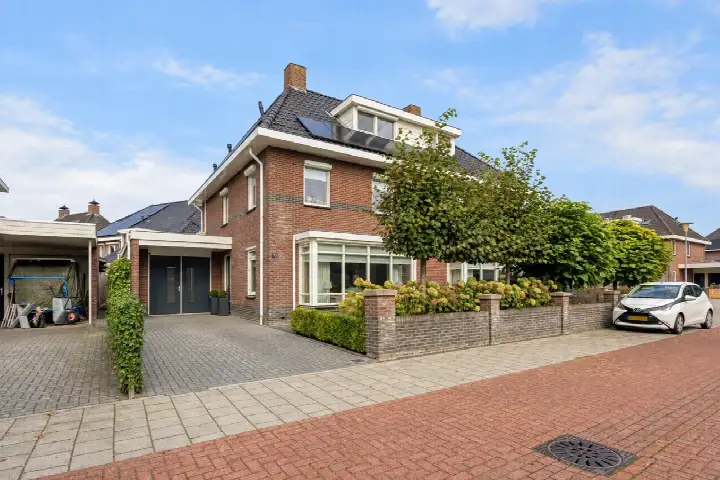
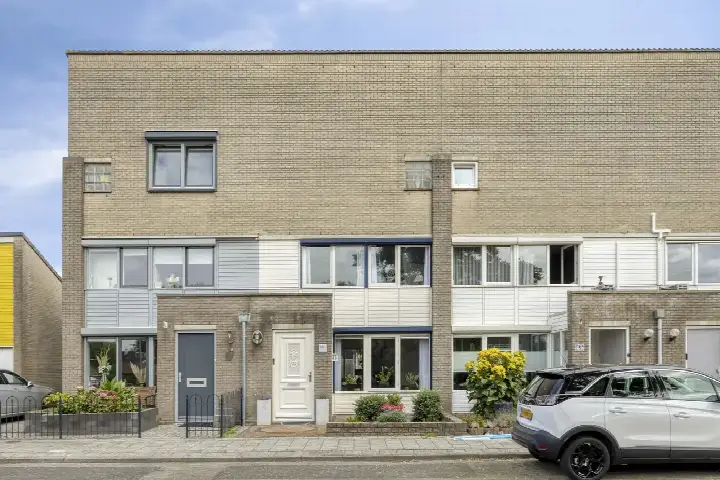
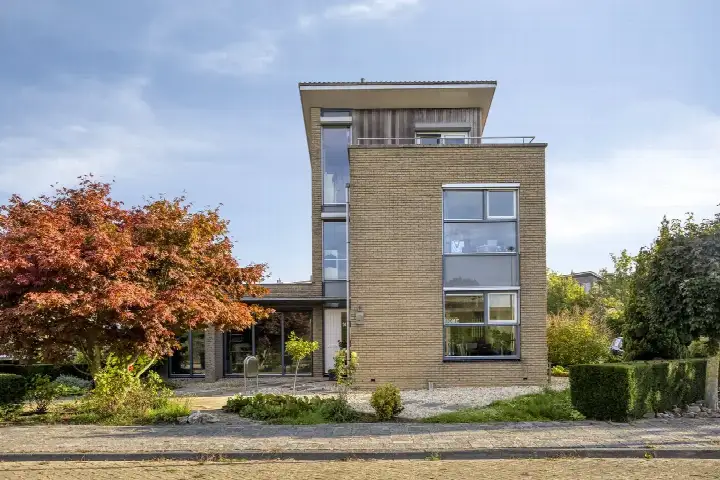
In Kampen there are 23.734 homes with an average assessed value (WOZ) of €361.000. Of these, around 97% are occupied and 3% unoccupied. Most homes are owner-occupied. This amounts to 36% rental homes and 64% owner-occupied homes. Of the homes, 63% privately owned, 25% owned by housing associations and 12% owned by other landlords. The most common construction periods in Kampen are 1970-1980 (14%) and 1900-1925 (14%).
There are currently no homes for sale in Kampen. The most recently listed home is Rondweg 158 by Meuleman Makelaardij & Taxatiebureau o.z.. No homes were sold in Kampen over the past year.
There are currently no homes for rent in Kampen. The most recent home is Veen Valckstraat 15, offered by www.dewoningzoeker.nl. No homes were let in Kampen over the past year.
No recent rental data available for Kampen.
In Kampen there are 16.107 addresses with a registered energy label. The most common labels are A (36%), C (19%) and B (16%). On average, an address in Kampen uses 2.560 kWh of electricity per year. This is 0% above the national average of 2.550 kWh. Natural gas consumption, at 850 m³ per year, is 6% above the national average of 800 m³.

Sluiter for families
Auto-translated to English by AII think Onderdijks is a very safe neighbourhood and there is a lot of attention for others. I am really good friends with my neighbours, I have never felt so safe and loved in the neighbourhood.
Auto-translated to English by AIWe really enjoy living here, united, helpful, social, cosy, spontaneous neighbourhood drinks, neighbourhood BBQ, neighbourhood app, social control, in short The neighbourhood to be!! Ditches, canals, so also a nature-rich neighbourhood. We have been living here for 12 years now, couldn't have wished for a better neighbourhood.
Auto-translated to English by AIQuiet neighbourhood to live in. Child-friendly and reasonably spacious. Several schools in the area, both primary and secondary. The maintenance of green spaces leaves something to be desired; perhaps this could be addressed with a neighbourhood initiative? Downside: traffic driving much too fast on the Silene.
Auto-translated to English by AIMy experience of the neighbourhood is not yet extensive because I moved recently, but so far it is very nice, peaceful and cosy.
Auto-translated to English by AII enjoy living there
Auto-translated to English by AIIt's a fairly nice neighbourhood. New houses, young families, playgrounds everywhere and very small parks (could be a bit bigger in my opinion). Almost everyone has a video doorbell and therefore shares in the neighbourhood app (which fortunately exists) when they see strange or odd things happening. This has already solved several thefts! It's still being worked on, but the neighbourhood already feels very complete. The roads are nice and smooth, and it's conveniently located near the motorway and the supermarket. There are many rubbish bins, but sometimes some rubbish ends up next to them. The houses are well-maintained and new. There's a large shopping centre nearby. So few points for improvement except for the paving and reducing the parks.
Auto-translated to English by AIAlthough I don't have much contact with neighbours, I find this neighbourhood very pleasant. We almost never have trouble with theft, and only one house occasionally causes some noise nuisance. There are also loitering youths, but they keep to themselves. There is a good shopping area and a nice park with a petting zoo nearby, and both the public greenery and the roads are well maintained. Once a year, the Zoddefestival takes place in this neighbourhood. This could be organised a bit better, as the festival grounds border a flat for the elderly. There are plenty of major roads in this neighbourhood, and there is also a train station. The neighbourhood is also suitable for children, as there is a primary school and a playground within walking distance, and other schools are readily available within a radius of up to two kilometres.
Auto-translated to English by AIOver the past year a home for sale in Kampen was listed for an average of €444,969 (€3,669 per m²). That is 16% below the Dutch national average.
A rental home in Kampen cost an average of €1,030 per month (€21 per m²). That is 52% below the national average.
Residents give Kampen a 8.2 out of 10 based on 24 reviews. Safety stands out with a 8.6; nature and greenery lags behind with a 7.8.
Gemeente Kampen has 56,547 residents. Many families: 38% of the households have children.
The housing supply in Kampen is remarkably efficient: 54% has an A, A+ or B label. The average natural gas consumption per household is 850 m³ per year.
From Kampen you can on average reach a supermarket at 1.1 km, a GP at 1.5 km, a railway station at 2.3 km, a primary school at 0.7 km (as the crow flies, source: CBS).
Right now you will find 235 homes for sale and 17 homes for rent in Kampen.