Municipality in Limburg
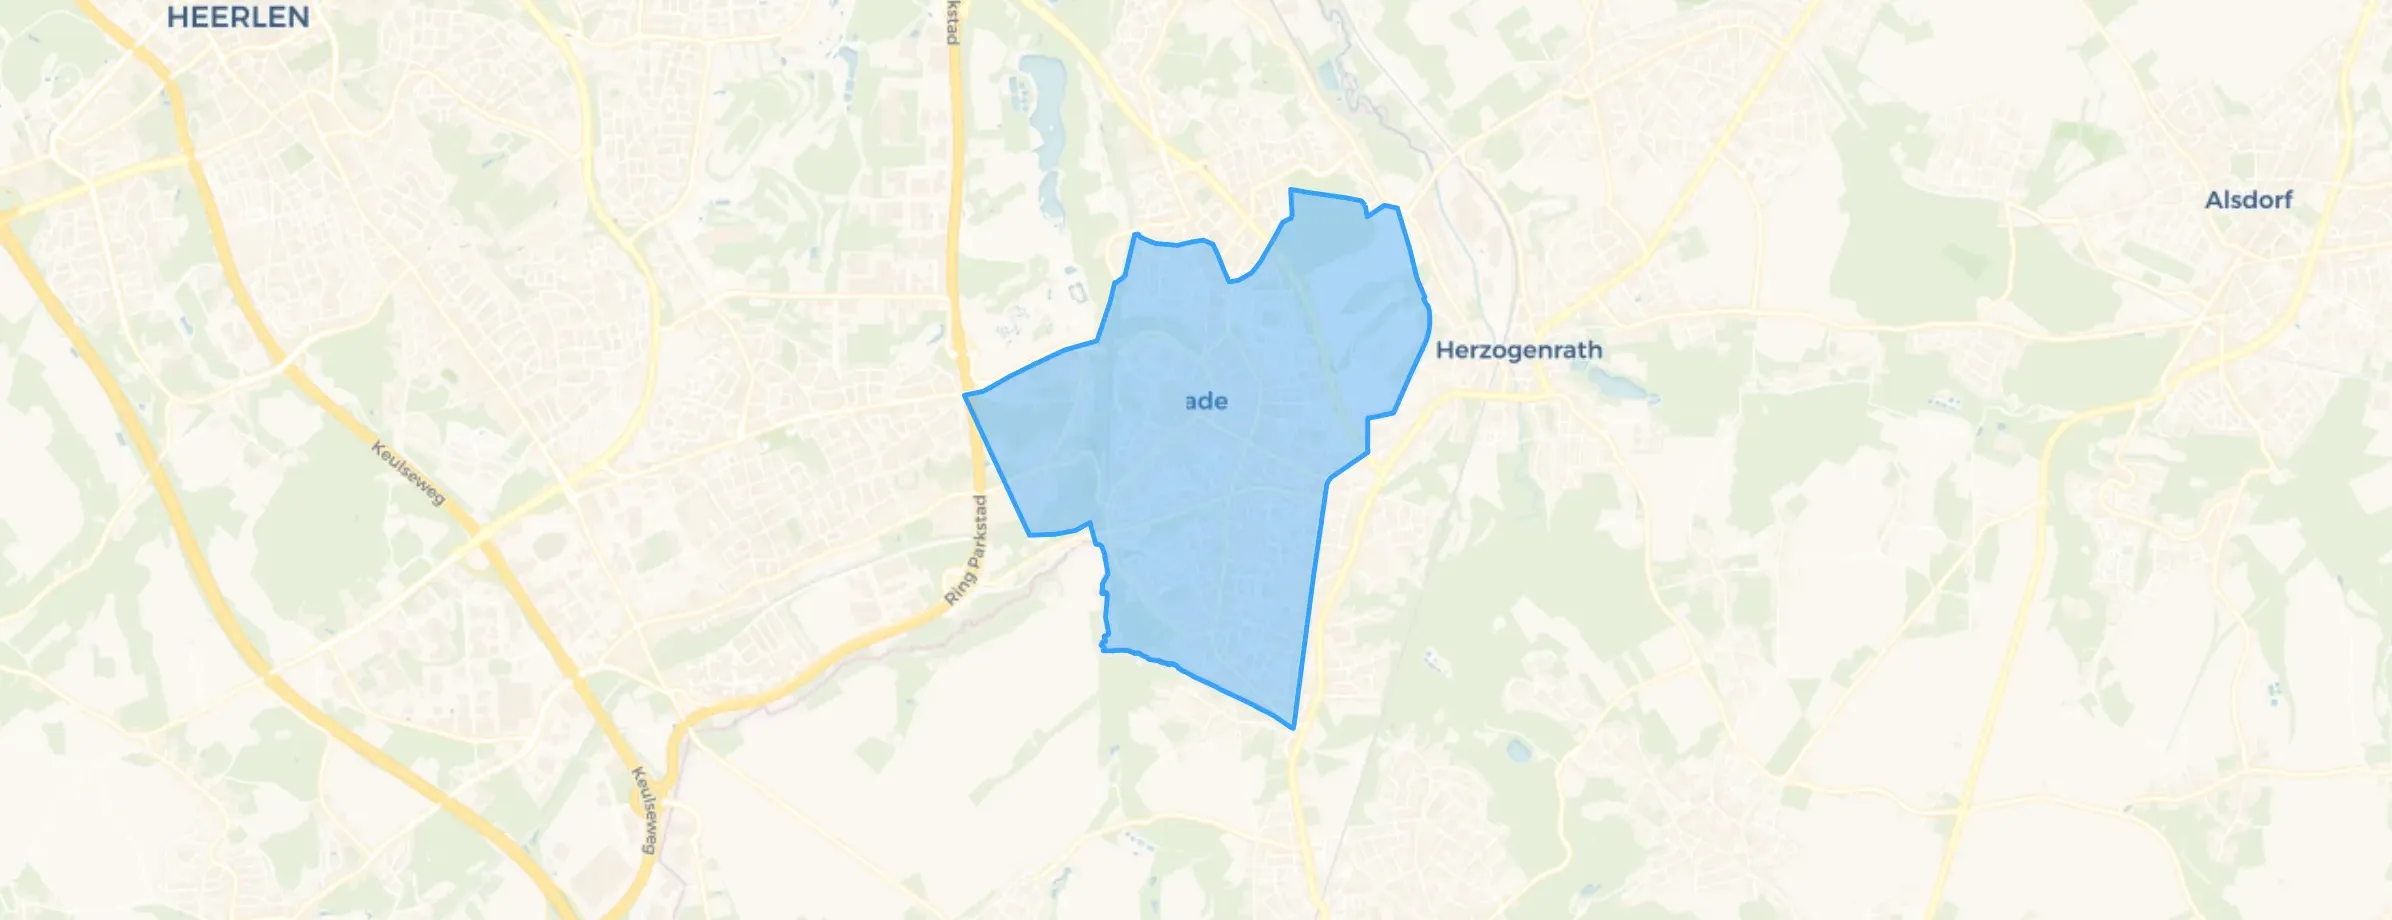
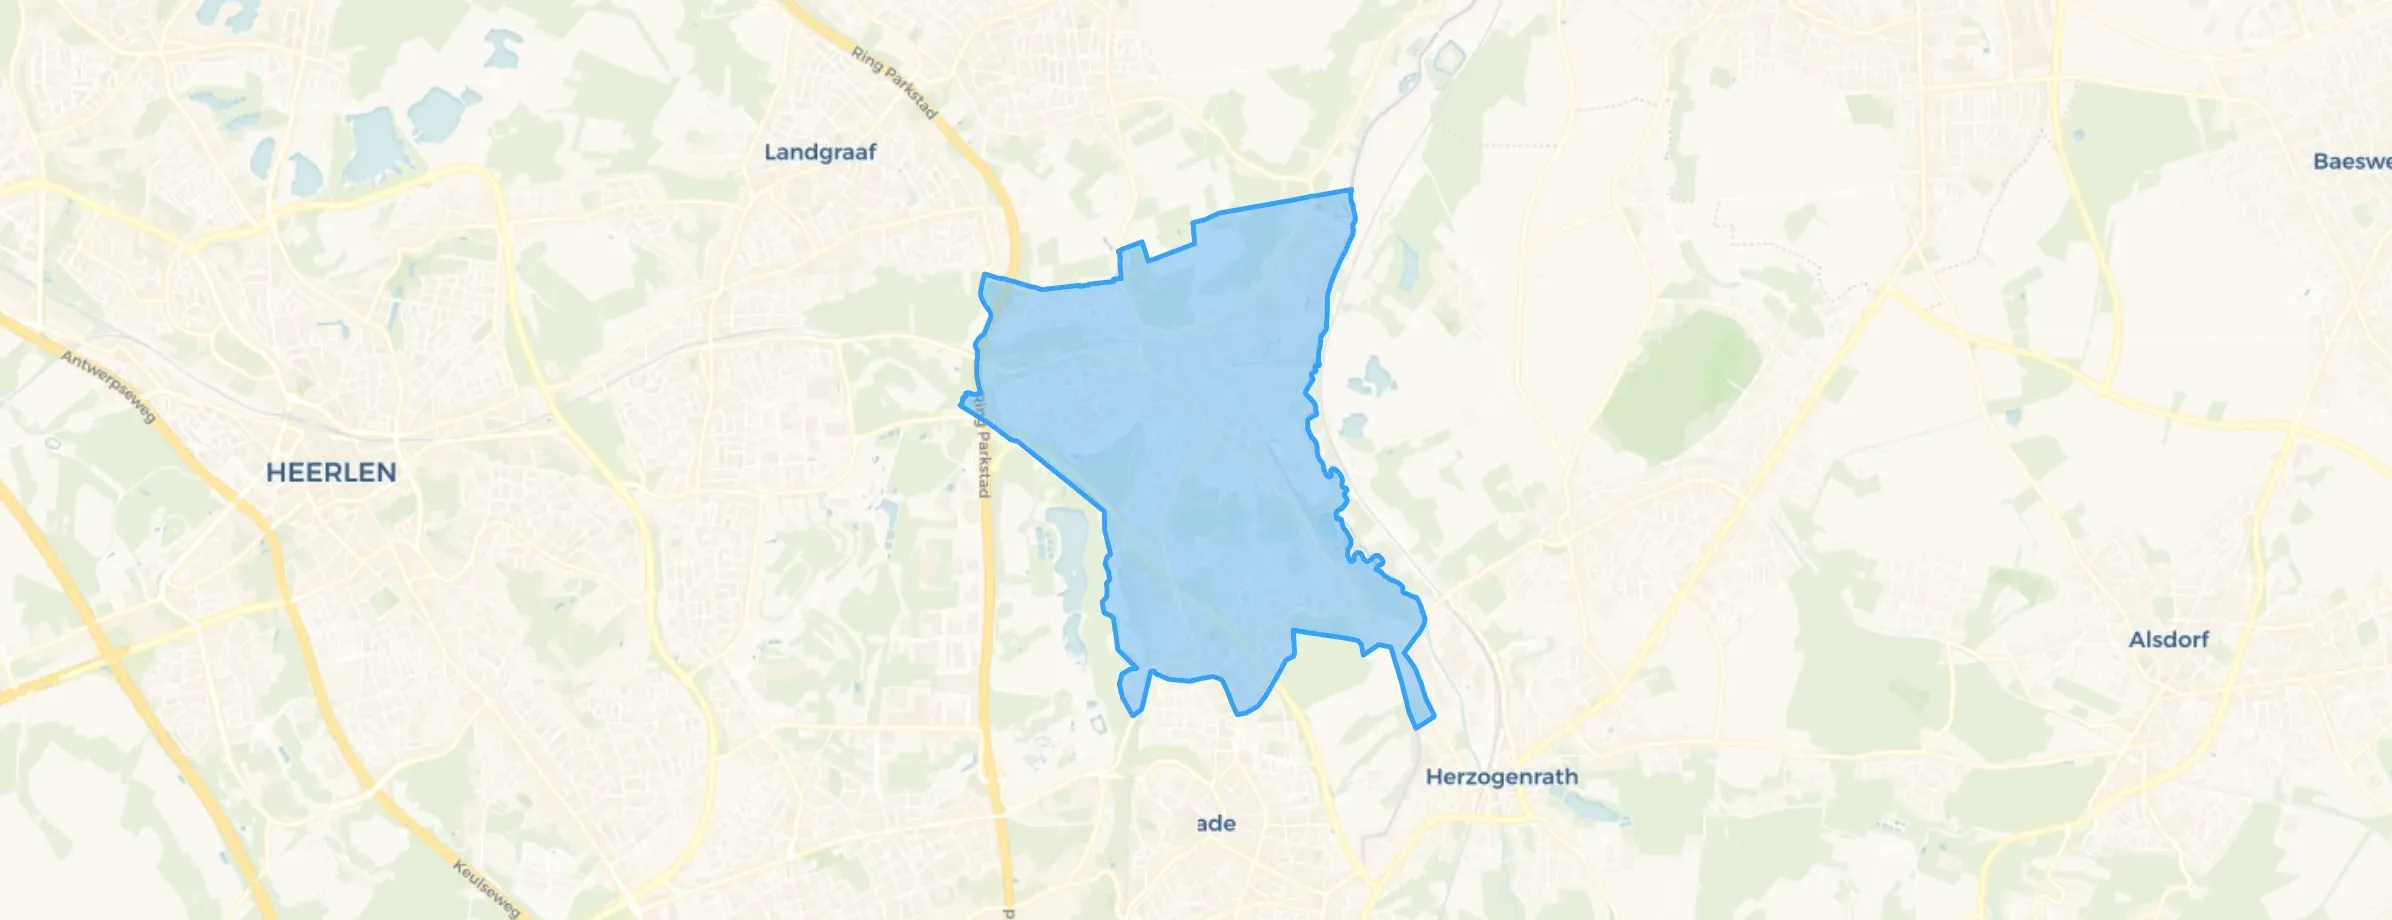
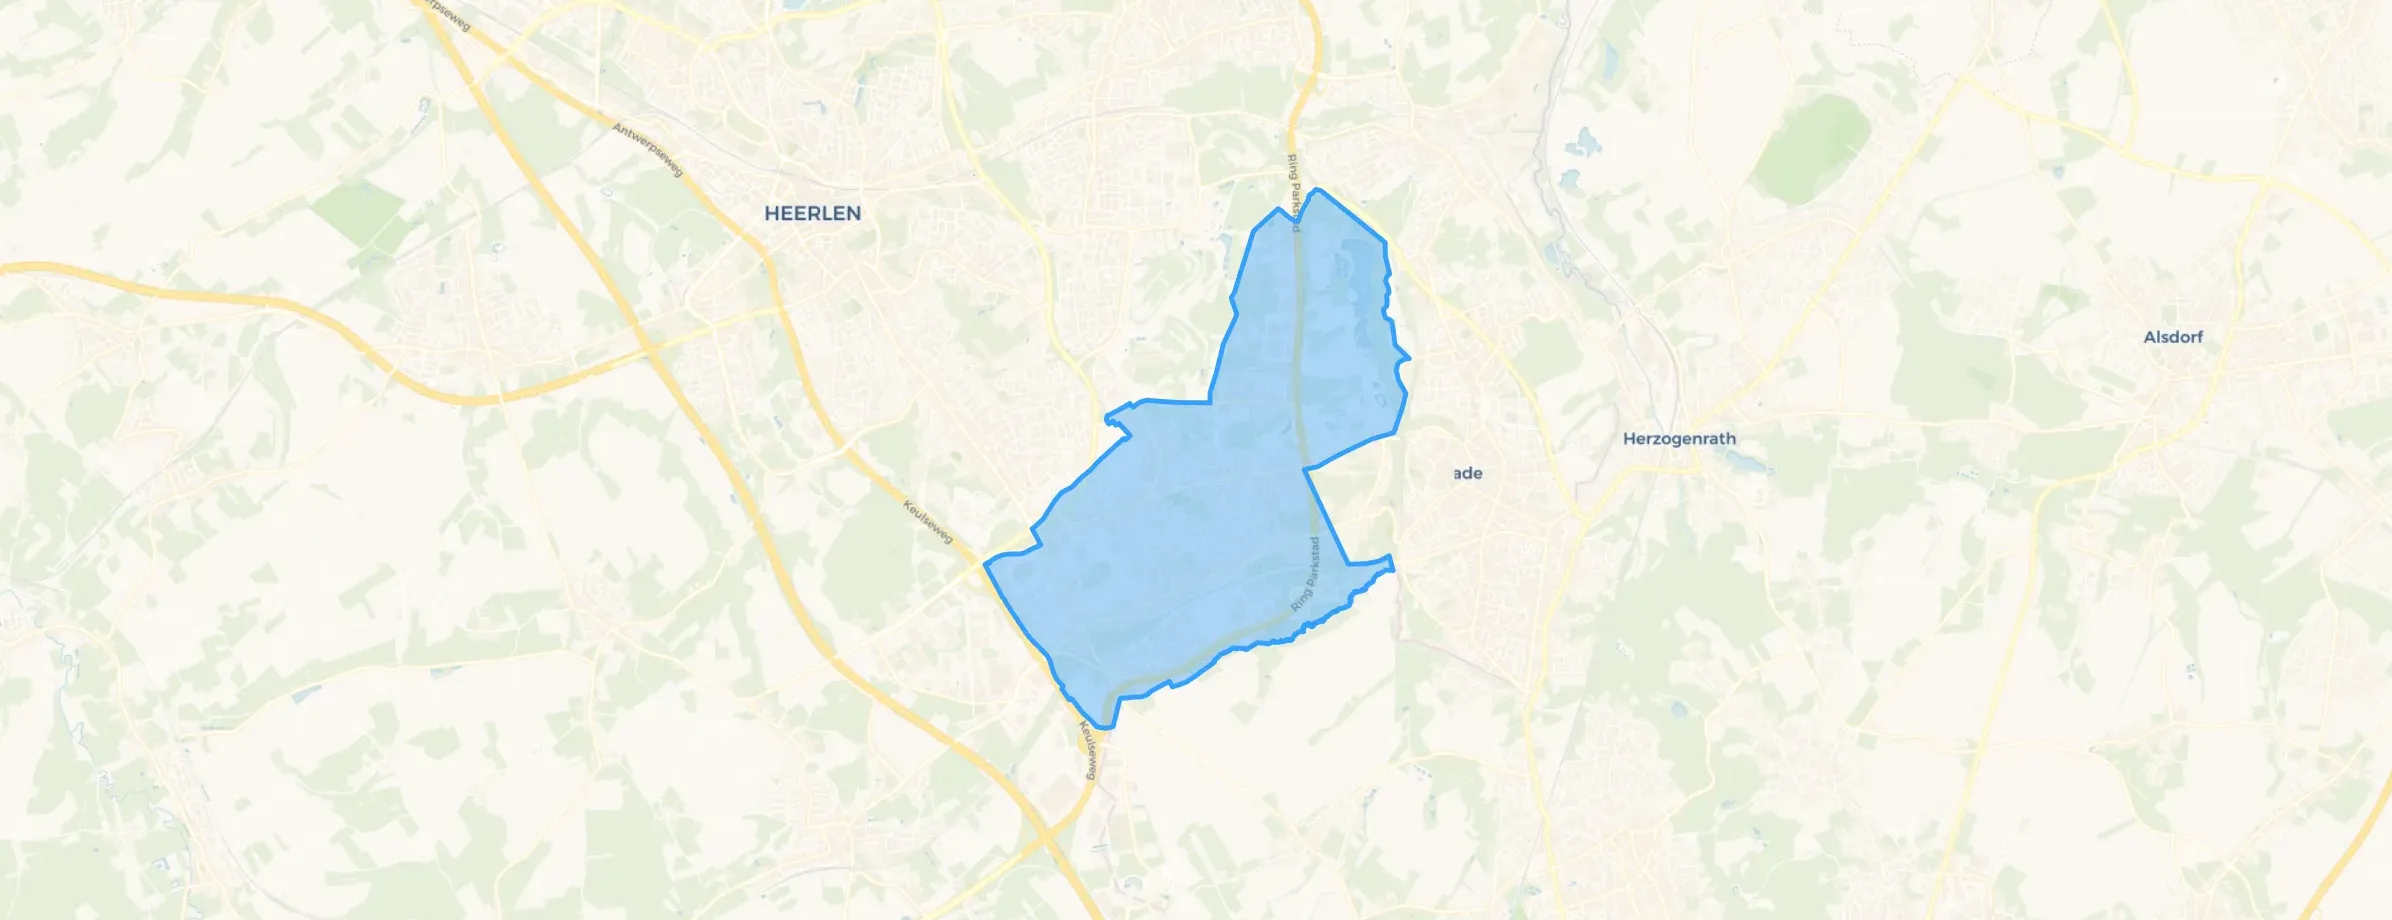
Kerkrade is located in the province of Limburg The municipality has a total area of 2.215 hectares, of which 2.191 hectares are land and 24 hectares are water. The municipality is coded as GM0928. The postcode area is 6461AA-6471XZ.
Kerkrade has 45.311 residents. Of these, 50,1% are men and 49,9% are women. Most residents are 45 to 65 years (29,0%). The other age groups are 27,1% for '65 years or older', 22,7% for '25 to 45 years', 12,4% for '0 to 15 years' and 8,8% for '15 to 25 years'. Of the residents, 42,0% is unmarried, 39,5% is married, 11,0% is divorced and 7,4% is widowed. 30.016 residents originate from the Netherlands, 10.535 come from Europe and 4.760 come from countries outside Europe.
There are 23.005 households in Kerkrade. 42,5% of these are single-person households, 30,6% households without children and 26,9% households with children. The average household size is 1,9 persons.
In Kerkrade there are 37.400 income recipients. The average income per income recipient is €31.100, which is €4.700 (13%) lower than the national average of €35.800. Per resident, the average income is €26.300, which is €2.900 (10%) lower than the national average of €29.200. Most residents of Kerkrade are educated to an intermediate level. 46,6% have an intermediate education (HAVO, VWO or MBO 2-4), 34,8% have a lower education (VMBO or MBO 1) and 18,7% have a university or higher professional education (HBO/WO).
Of the 45.311 residents, around 55% are in paid employment, which amounts to 24.921 people. This is 10% lower than the national average of 65%. The majority of workers are in salaried employment (88%), while 12% are self-employed. In Kerkrade, 36% of residents receive a benefit. The largest group is those receiving a state pension (AOW). 10.500 people receive this benefit.
In Kerkrade there are 24.167 homes with an average assessed value (WOZ) of €199.000. Of these, around 94% are occupied and 6% unoccupied. In Kerkrade there are roughly as many rental as owner-occupied homes. This amounts to 47% rental homes and 53% owner-occupied homes. Of the homes, 52% privately owned, 32% owned by housing associations, 15% owned by other landlords and 1% of unknown ownership. The most common construction periods in Kerkrade are 1950-1970 (23%) and 1970-1980 (18%).
There are currently no homes for sale in Kerkrade. The most recently listed home is Gulperstraat 7 by House Hunting Parkstad op Funda. No homes were sold in Kerkrade over the past year.
There are currently no homes for rent in Kerkrade. The most recent home is Lindenhof 2, offered by www.thuisinlimburg.nl. No homes were let in Kerkrade over the past year.
No recent rental data available for Kerkrade.
In Kerkrade there are 24.774 addresses with a registered energy label. The most common labels are C (27%), A (17%) and B (14%). On average, an address in Kerkrade uses 2.560 kWh of electricity per year. This is 9% below the national average of 2.810 kWh. With an annual consumption of 1.070 m³ per address, natural gas consumption is 16% below the national average of 1.280 m³.
I've never really had any problems in the mentioned areas, hence I gave everything at least a 7. Although I think the problems that exist are more problems that are the same throughout the Netherlands.
Auto-translated to English by AIIn reports there is mention of theft from cars. At weekends sometimes fireworks from LHC. The municipality does a lot of maintenance on greenery, truly fantastic.
Auto-translated to English by AINever any trouble and always quiet on the street
Auto-translated to English by AILots of nature, beautiful surroundings, quiet living
Auto-translated to English by AIIt was once a nice neighbourhood but not anymore. Nothing is being fixed in the apartment, it's draughty everywhere and damp, nothing is done about it, yet paying almost 800 euros. At the front, rats are running around, people have had rats on their balcony, the weeds are very high, almost up to the balcony.
Auto-translated to English by AIWe all know each other... and everyone keeps an eye on each other's house when you go on holiday
Auto-translated to English by AILived here for 34 years, the area has deteriorated, gardens etc. are very dirty, not a tidy neighbourhood, what could be improved in this area is that more maintenance is done on greenery and the streets.
Auto-translated to English by AINice, very quiet neighbourhood with nice houses
Auto-translated to English by AIThe housing stock is mainly post-war — 54% was built between 1945 and 1990.
Over the past year a home for sale in Kerkrade was listed for an average of €298,999 (€2,076 per m²).
A rental home in Kerkrade cost an average of €1,138 per month (€13 per m²).
Residents give Kerkrade a 7.0 out of 10 based on 17 reviews. Nature and greenery stands out with a 8.2; cleanliness lags behind with a 6.2.
From Kerkrade you can on average reach a supermarket at 0.8 km, a GP at 0.8 km, a railway station at 1.9 km, a primary school at 0.6 km (as the crow flies, source: CBS).
Right now you will find 241 homes for sale and 20 homes for rent in Kerkrade. A home for sale here is listed for an average of 81 days — relatively long for the current market.