Neighbourhood in Kerkrade
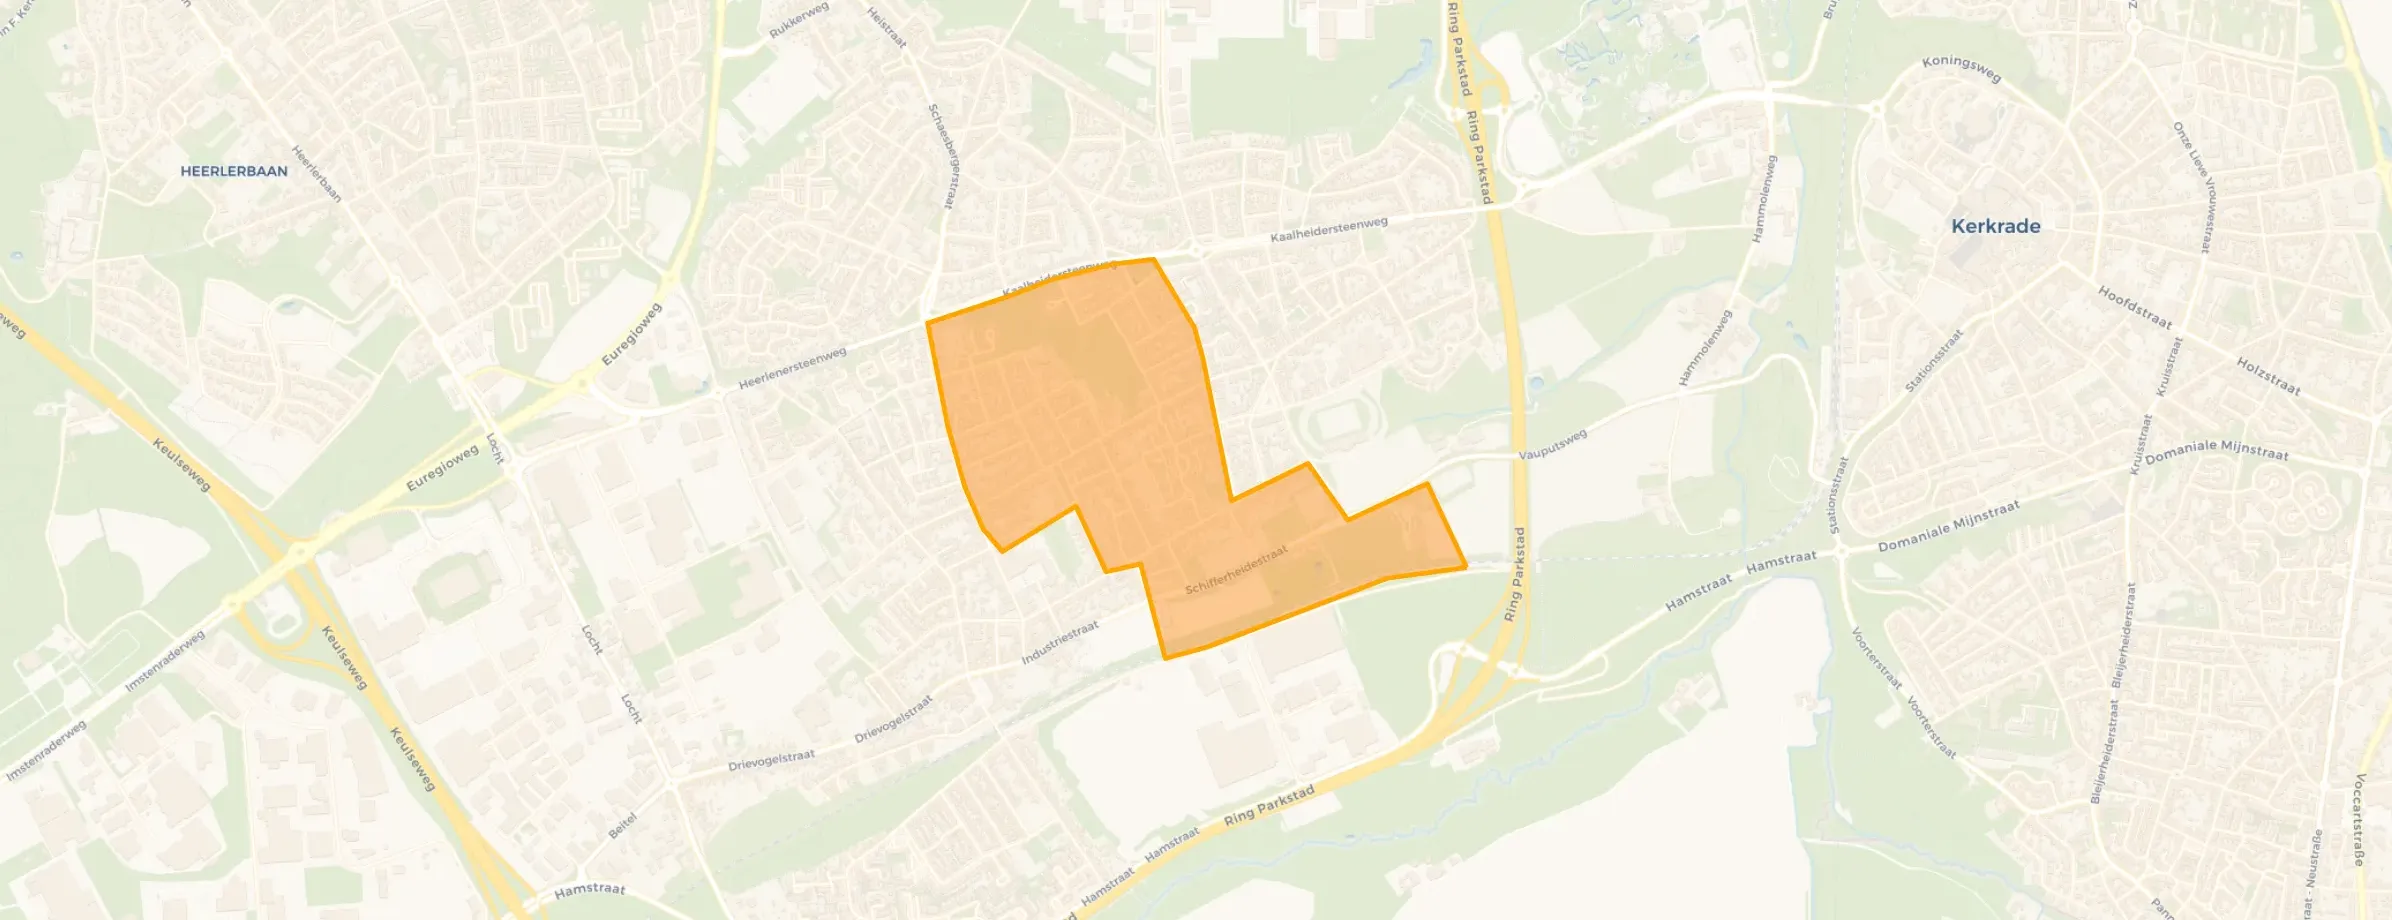
Heilust is located in the province of Limburg, in the municipality of Kerkrade, in the district Kerkrade-West The neighbourhood has a total area of 68 hectares, of which 68 hectares are land and 0 hectares are water. The neighbourhood is coded as BU09280001. The postcode area is 6466AE-6466VT.
Three residents rate the neighbourhood as satisfactory with a score of 5.7. They describe it as 'Nice quiet neighbourhood', 'The neighbourhood is beautiful' and 'Polluted, restless neighbourhood!'. Aspects such as amenities, accessibility, greenery are rated well in this neighbourhood, while cleanliness and community score less well.
Heilust has 2.560 residents. Of these, 48,6% are men and 51,2% are women. Most residents are 45 to 65 years (29,1%). The other age groups are 25,0% for '65 years or older', 22,1% for '25 to 45 years', 13,7% for '0 to 15 years' and 10,0% for '15 to 25 years'. Of the residents, 46,3% is unmarried, 33,8% is married, 12,7% is divorced and 7,2% is widowed. 1.695 residents originate from the Netherlands, 475 come from Europe and 395 come from countries outside Europe.
There are 1.290 households in Heilust. 43,4% of these are single-person households, 25,6% households without children and 31,0% households with children. The average household size is 1,9 persons. The national average is 2,1 persons.
In Heilust there are 2.100 income recipients. The average income per income recipient is €28.500, which is €13.700 (32%) lower than the national average of €42.200. Per resident, the average income is €23.800, which is €11.100 (32%) lower than the national average of €34.900. Most residents of Heilust are educated to a lower level. 49,0% have a lower education (VMBO or MBO 1), 38,4% have an intermediate education (HAVO, VWO or MBO 2-4) and 12,6% have a university or higher professional education (HBO/WO).
Of the 2.560 residents, around 53% are in paid employment, which amounts to 1.357 people. This is 19% lower than the national average of 72%. The majority of workers are in salaried employment (89%), while 11% are self-employed. In Heilust, 41% of residents receive a benefit. The largest group is those receiving a state pension (AOW). 540 people receive this benefit.
In Heilust there are 1.363 homes with an average assessed value (WOZ) of €208.000. Of these, around 97% are occupied and 3% unoccupied. Most homes are rental properties. This amounts to 66% rental homes and 34% owner-occupied homes. Of the homes, 34% privately owned, 60% owned by housing associations and 6% owned by other landlords. The most common construction periods in Heilust are 1950-1970 (35%) and 1980-1990 (21%).
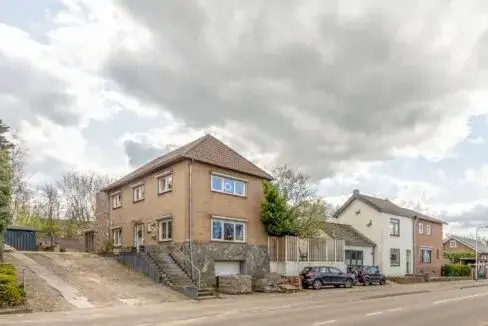
There are currently 6 homes for sale in Heilust. The most recently listed home is Schifferheidestraat 25 by A New Home Makelaardij op Funda. Over the past year, 24 homes were sold in Heilust. On average, a home was sold within 75 days.
The average asking price for a home for sale in Heilust over the past year was €357.250. This is 72% higher than the average assessed value (WOZ) of €208.000. The average asking price per m² of plot is €2.178.
There are currently no homes for rent in Heilust. The most recent home is Spireastraat 120, offered by www.thuisinlimburg.nl. Over the past year, 1 homes were let in Heilust. On average, a listing was let within 25 days.
No recent rental data available for Heilust.
In Heilust there are 1.014 addresses with a registered energy label. The most common labels are A (45%), B (21%) and C (11%). On average, an address in Heilust uses 2.380 kWh of electricity per year. This is 7% below the national average of 2.550 kWh. With an annual consumption of 770 m³ per address, natural gas consumption is 4% below the national average of 800 m³.
Never any trouble and always quiet on the street
Auto-translated to English by AIMy experience is quiet and not too many problems
Auto-translated to English by AIPeople with a low level of education who are on welfare and may or may not earn extra cash under the table. They have no understanding for people with a disability. People who swear at you and have a big mouth, and rubbish is dumped, making the street dirty. Not a neighbourhood for people with autism, Down syndrome, etc., because if you have that, you're made out to be crazy while they don't even really get to know you. And a lot of antisocial behaviour here, which creates an unsafe living environment. The housing association should be honest about the fact that Heilust is known as a deprived area. I was told this by mental health services when I already lived there. I would have liked to know about the situation before I moved in, because now, as a woman with autism, I'm stuck in a hopeless situation that I can no longer cope with. Heemwonen is very unfriendly to customers. That should be much better.
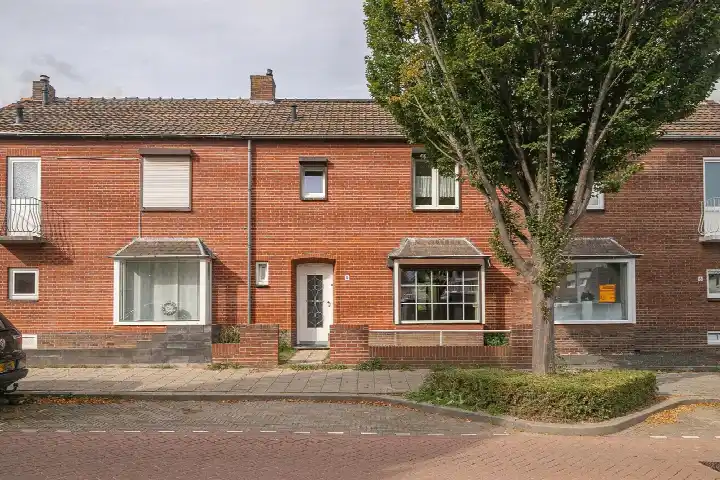
Auto-translated to English by AIThe housing stock is mainly post-war — 50% was built between 1945 and 1990. In addition, the most common type is terraced houses (44%).
Over the past year a home for sale in Heilust was listed for an average of €356,478 (€2,050 per m²). That is 33% below the Dutch national average.
Residents give Heilust a 5.7 out of 10 based on 3 reviews. Especially amenities (7.0) scores well; community (4.3) receives the lowest rating.
The housing supply in Heilust is remarkably efficient: 65% has an A, A+ or B label. The average natural gas consumption per household is 770 m³ per year.
From Heilust you can on average reach a supermarket at 0.8 km, a GP at 0.4 km, a railway station at 2.5 km, a primary school at 0.8 km (as the crow flies, source: CBS).