Municipality in Zuid-Holland
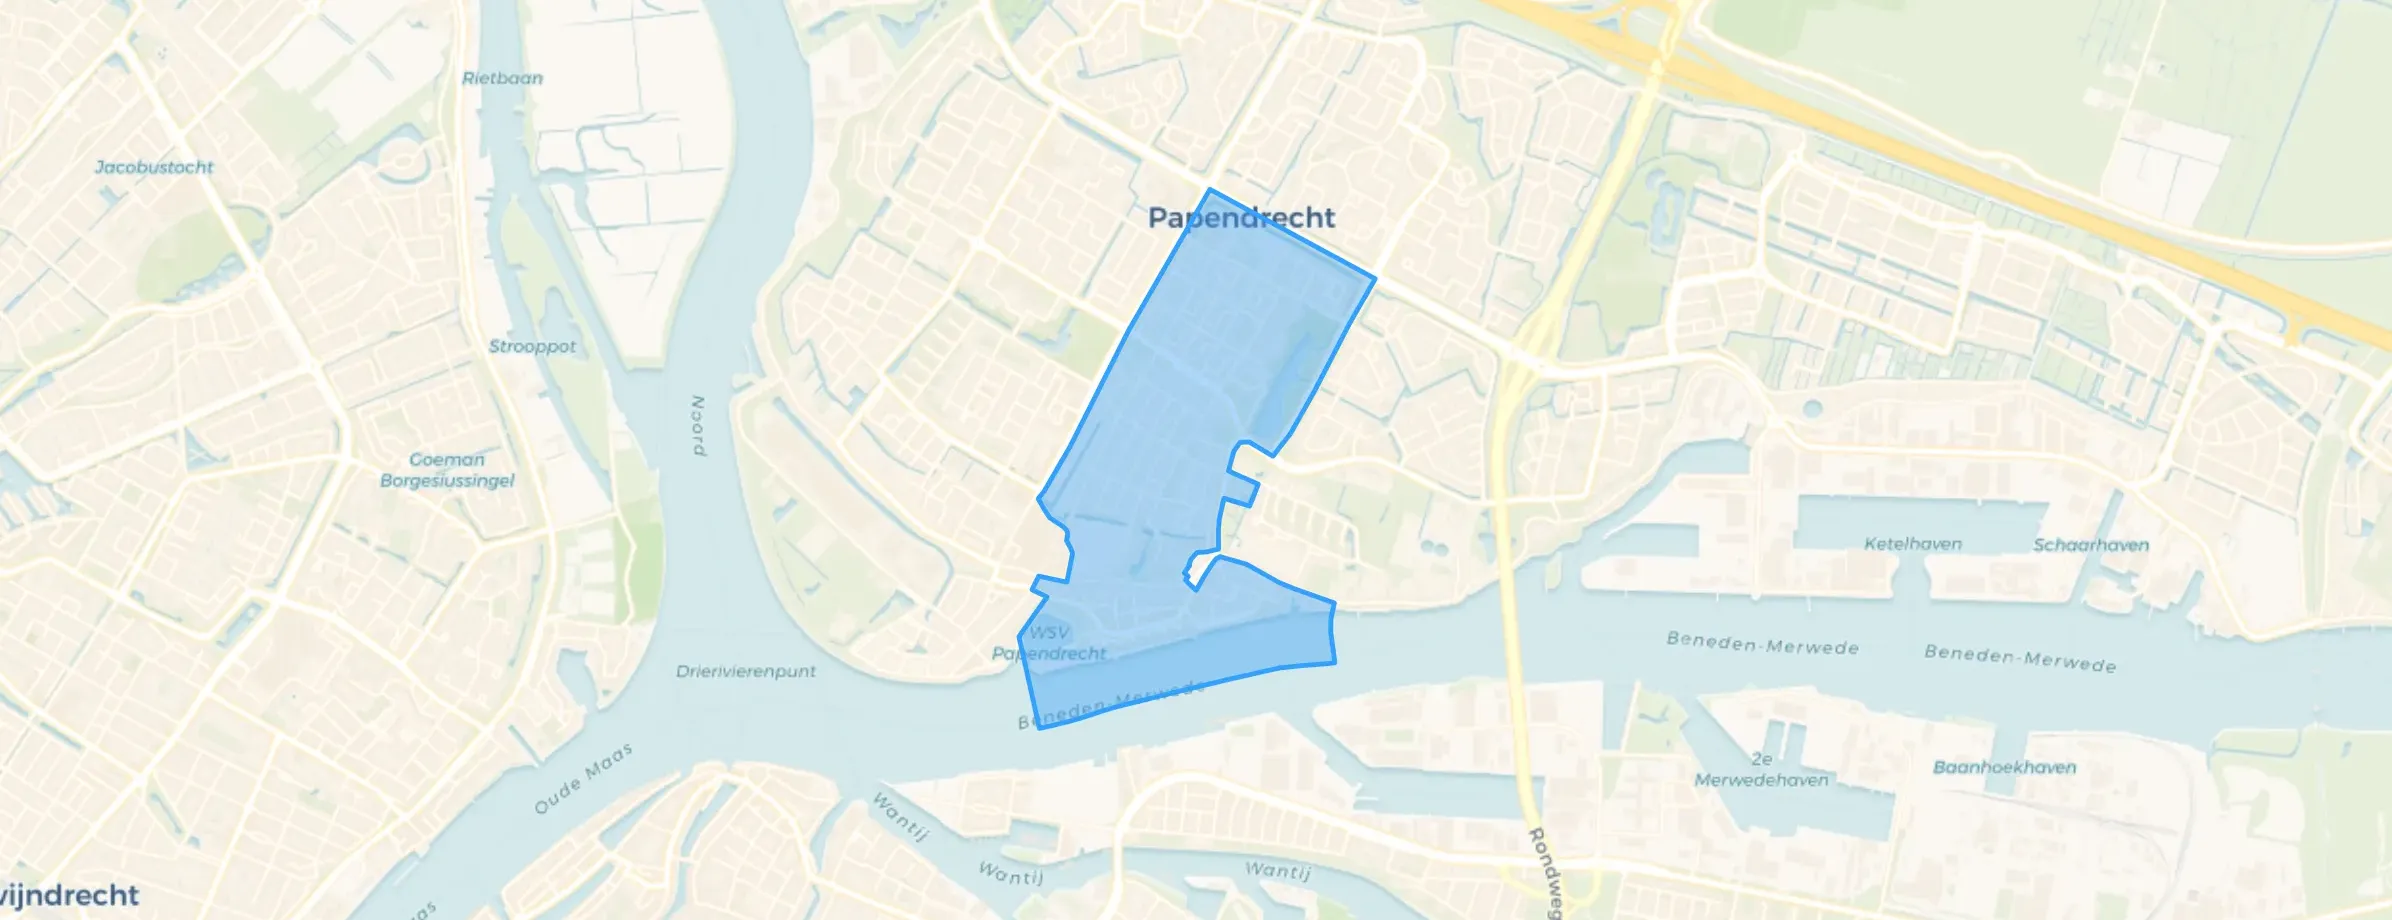
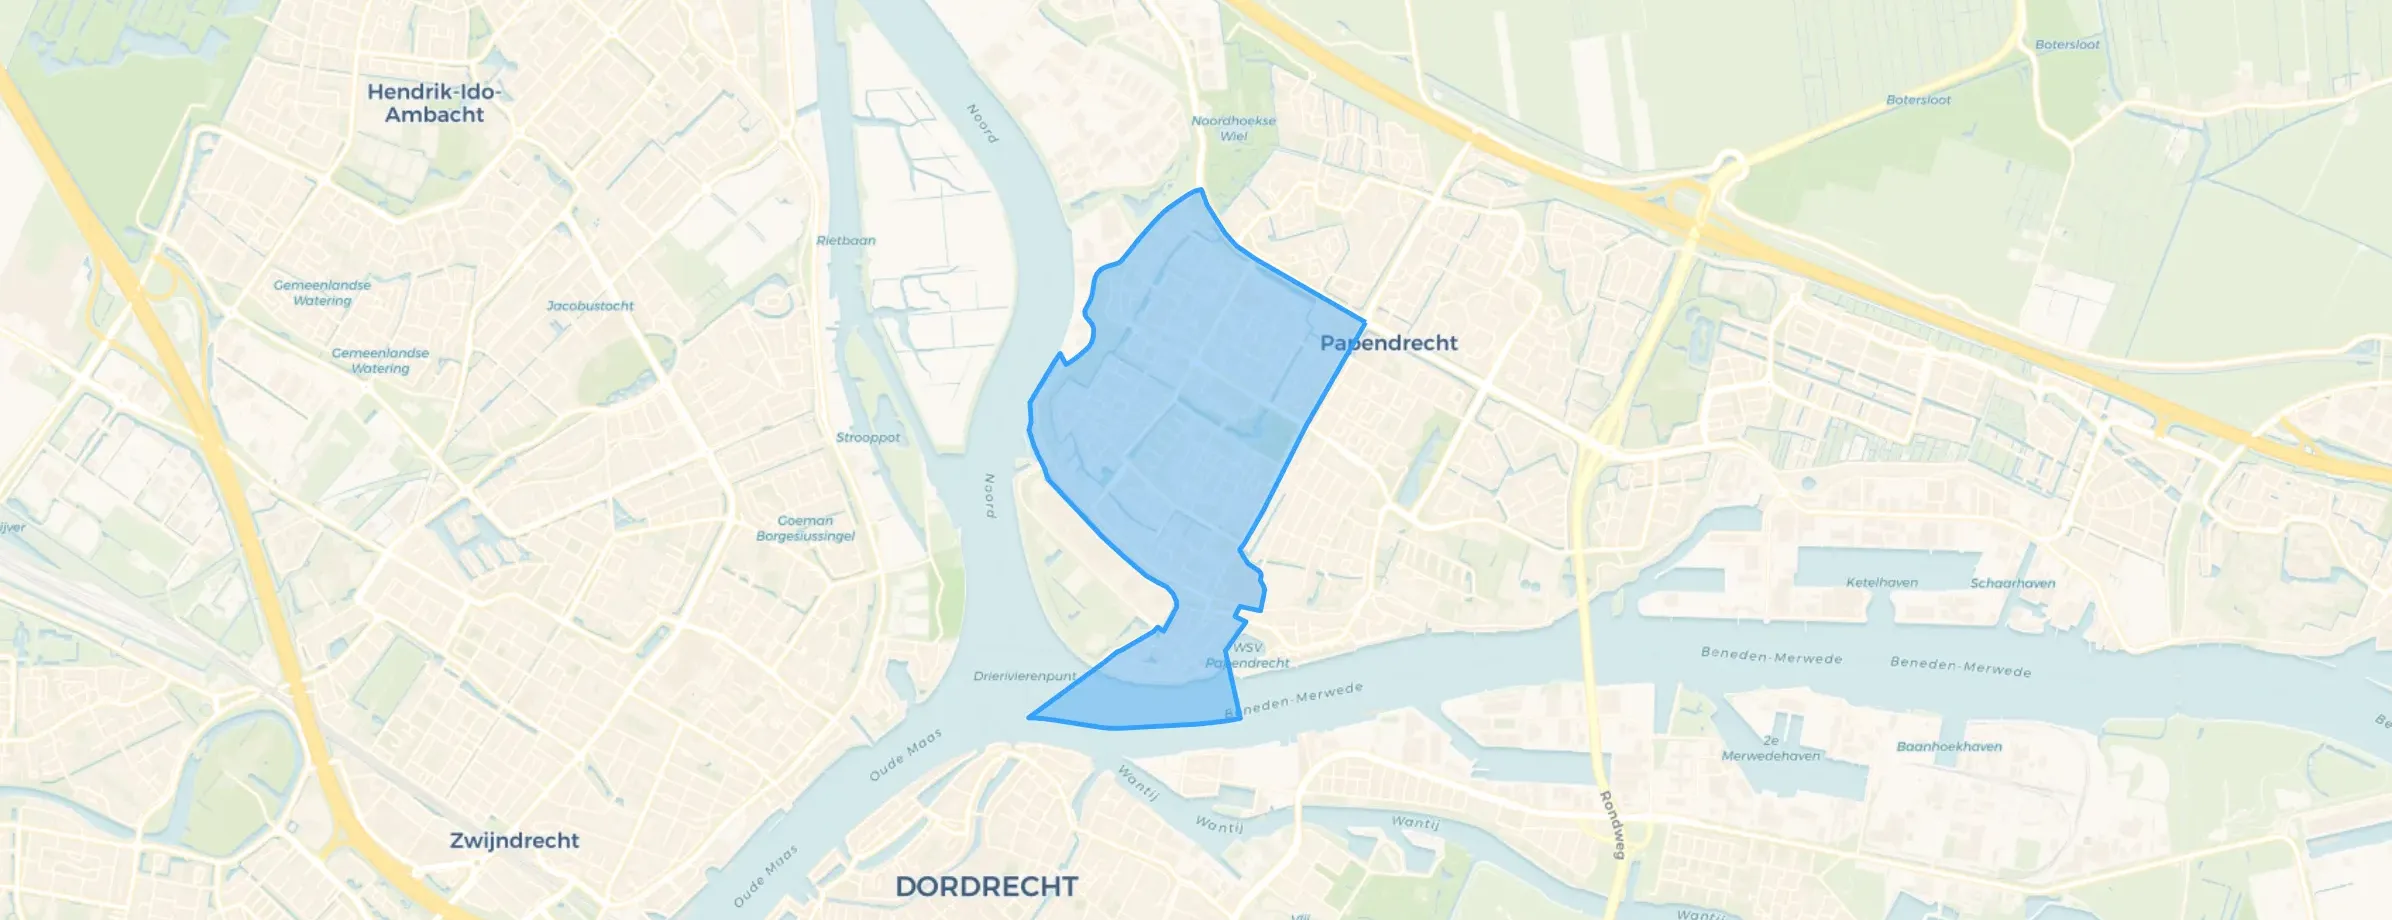
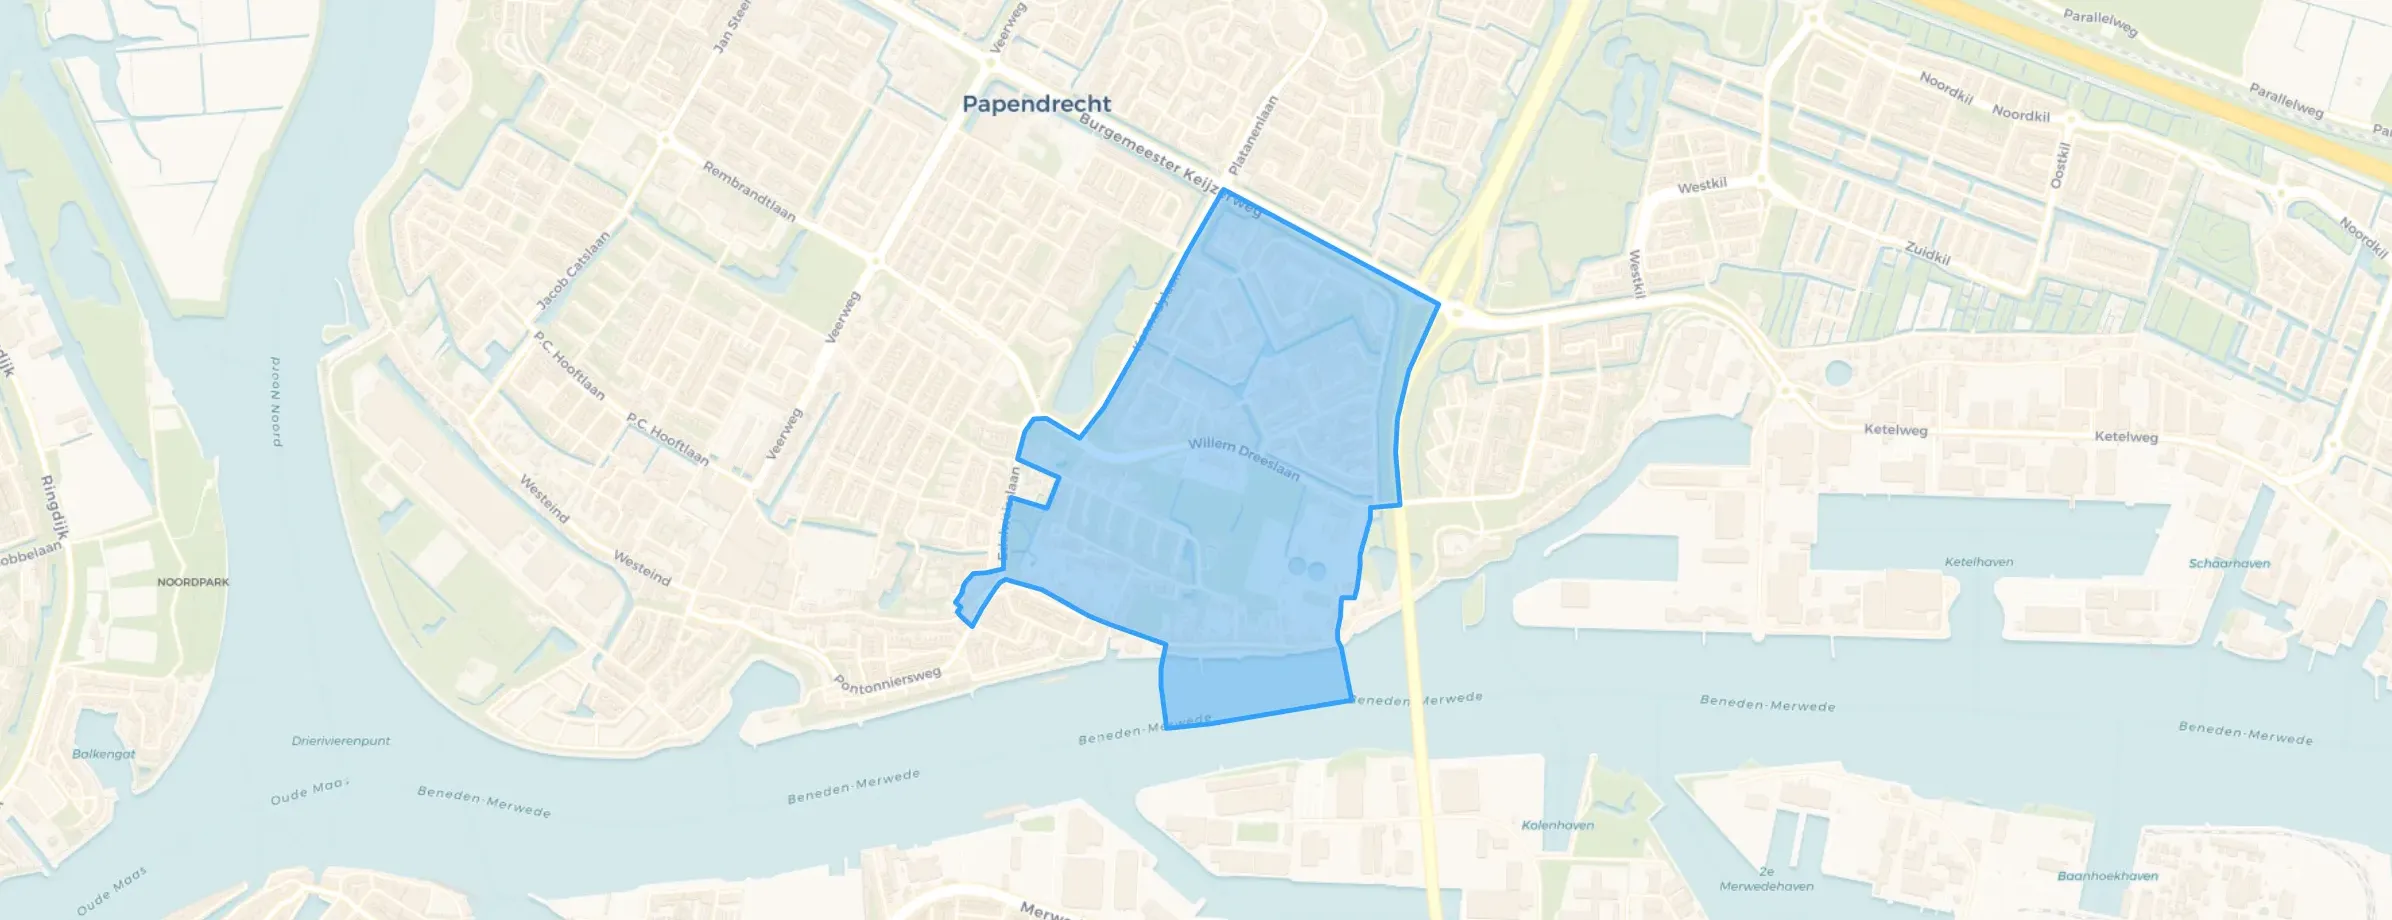
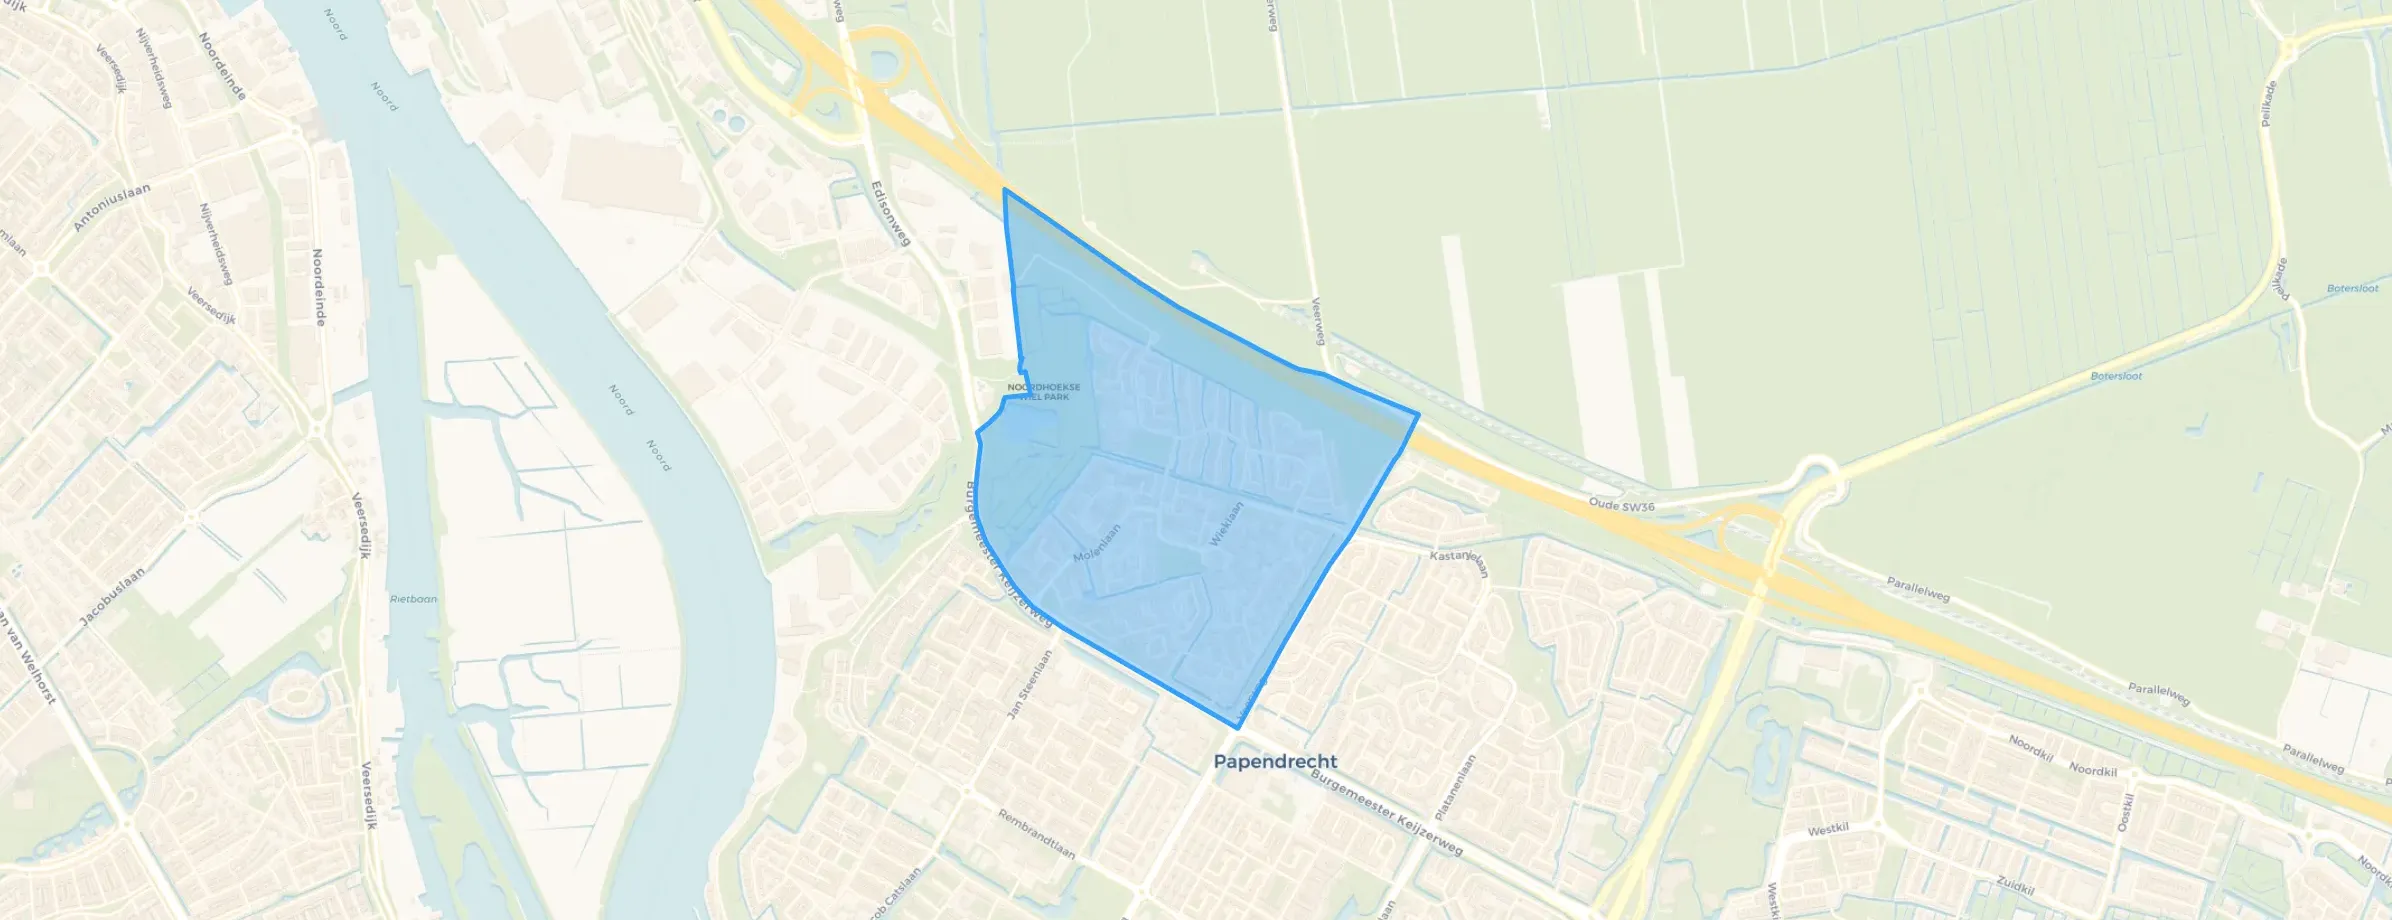
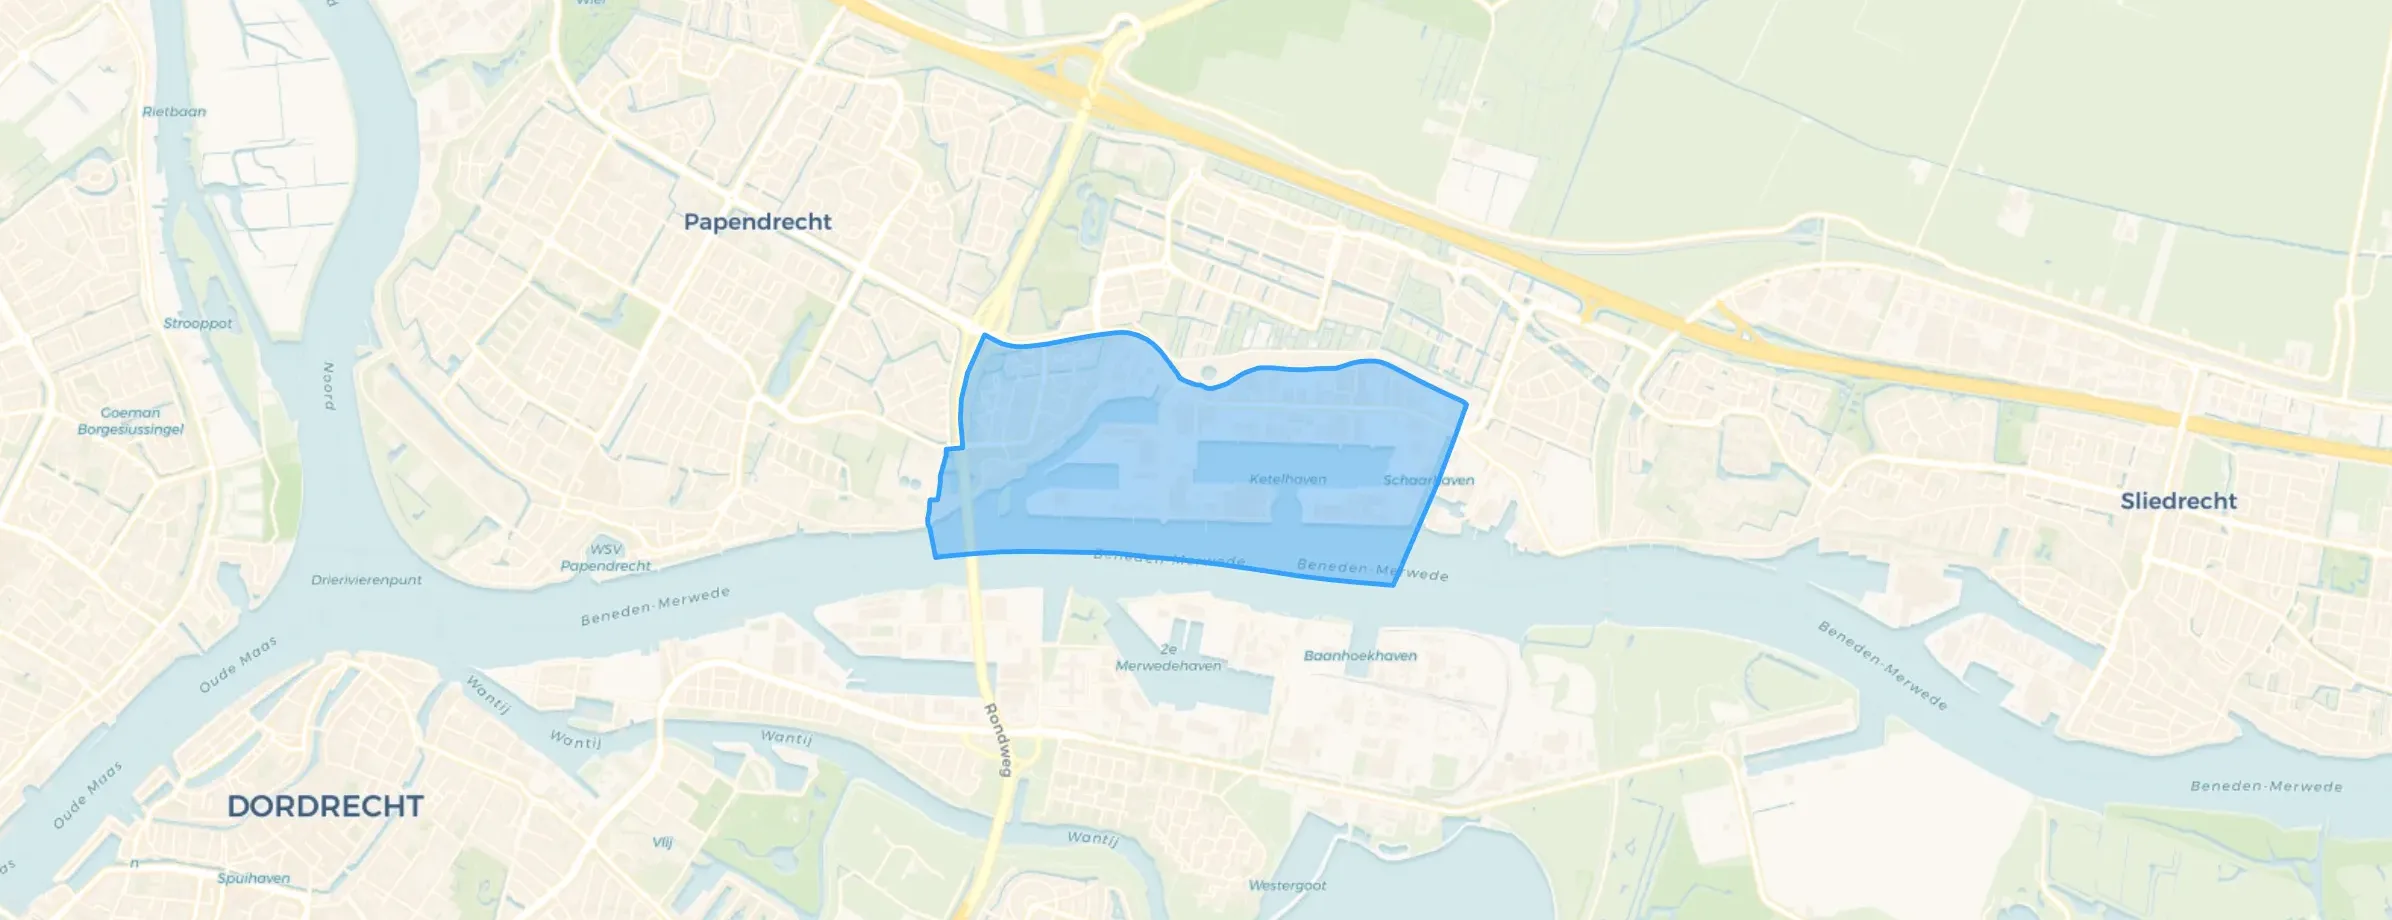
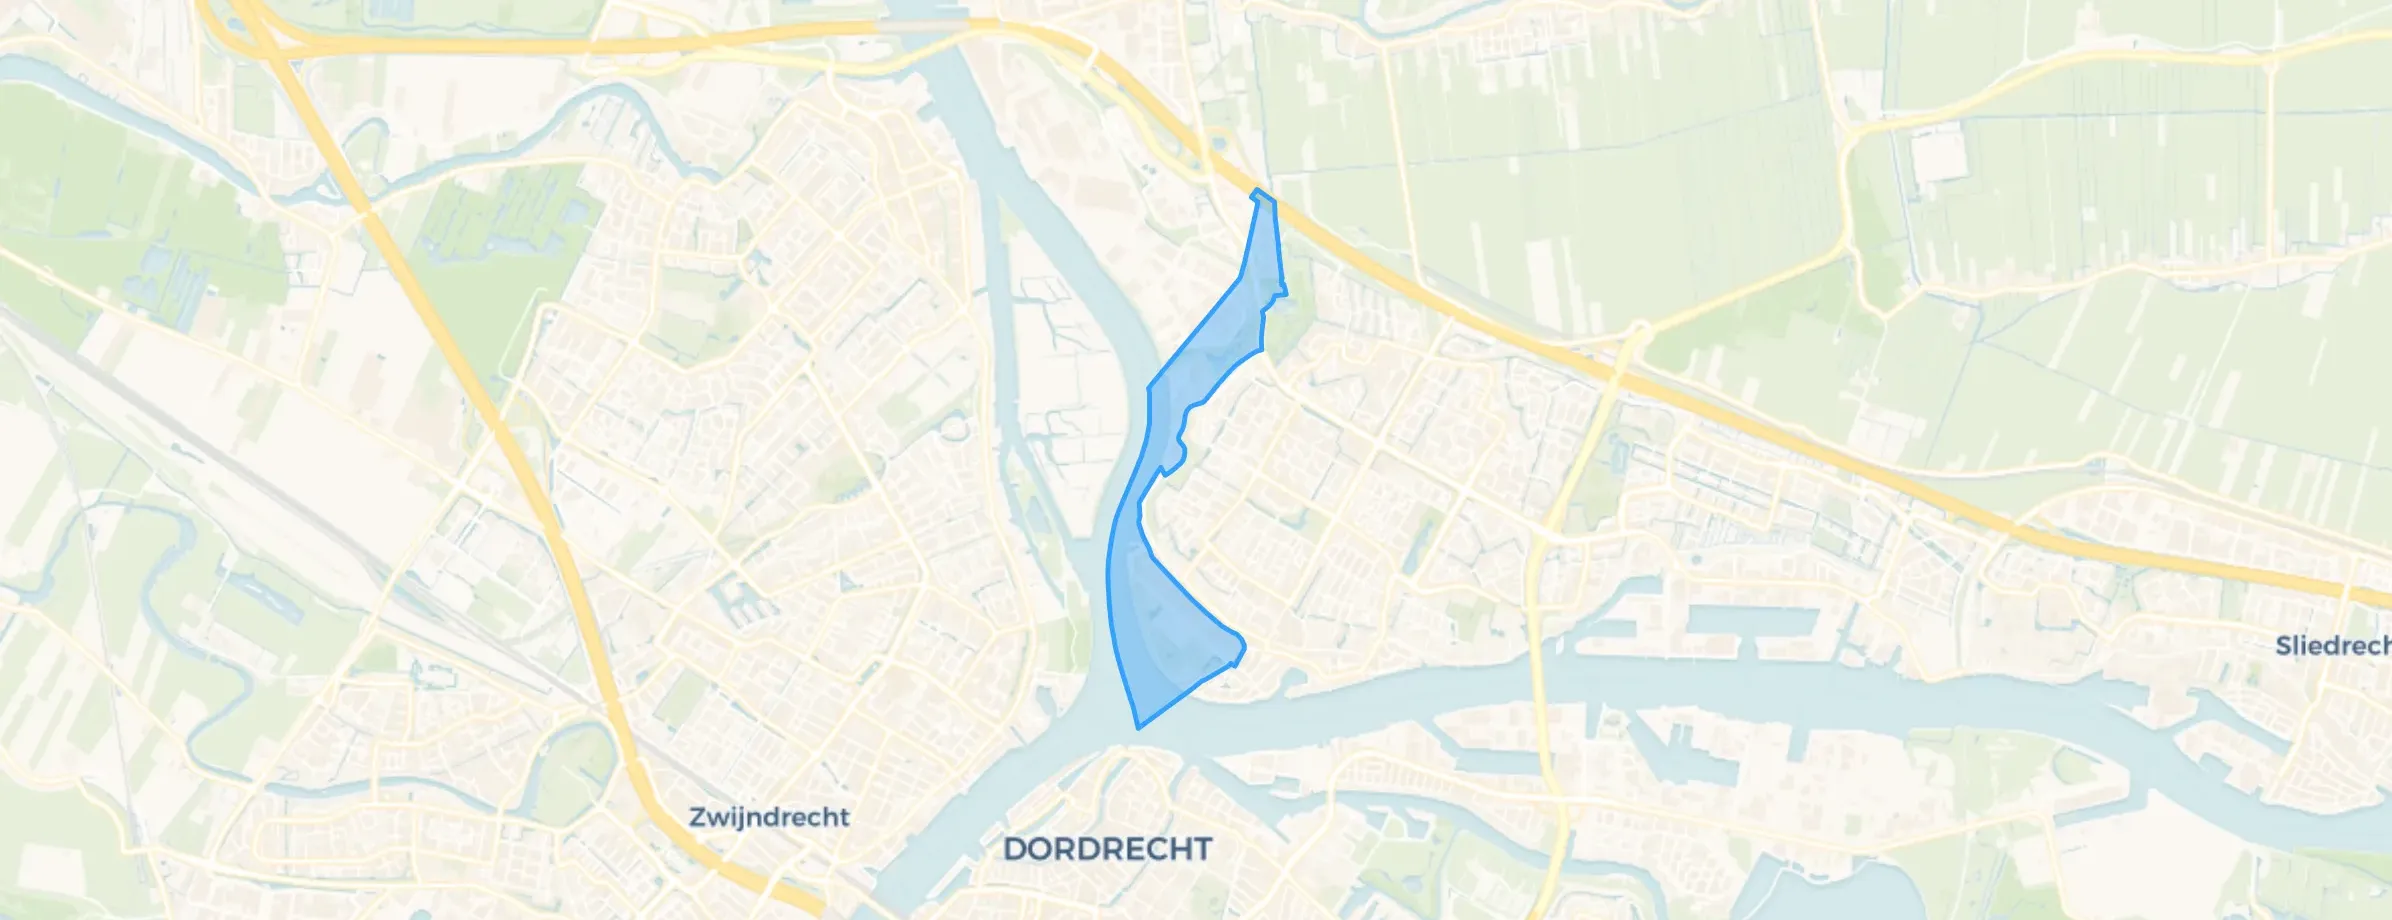
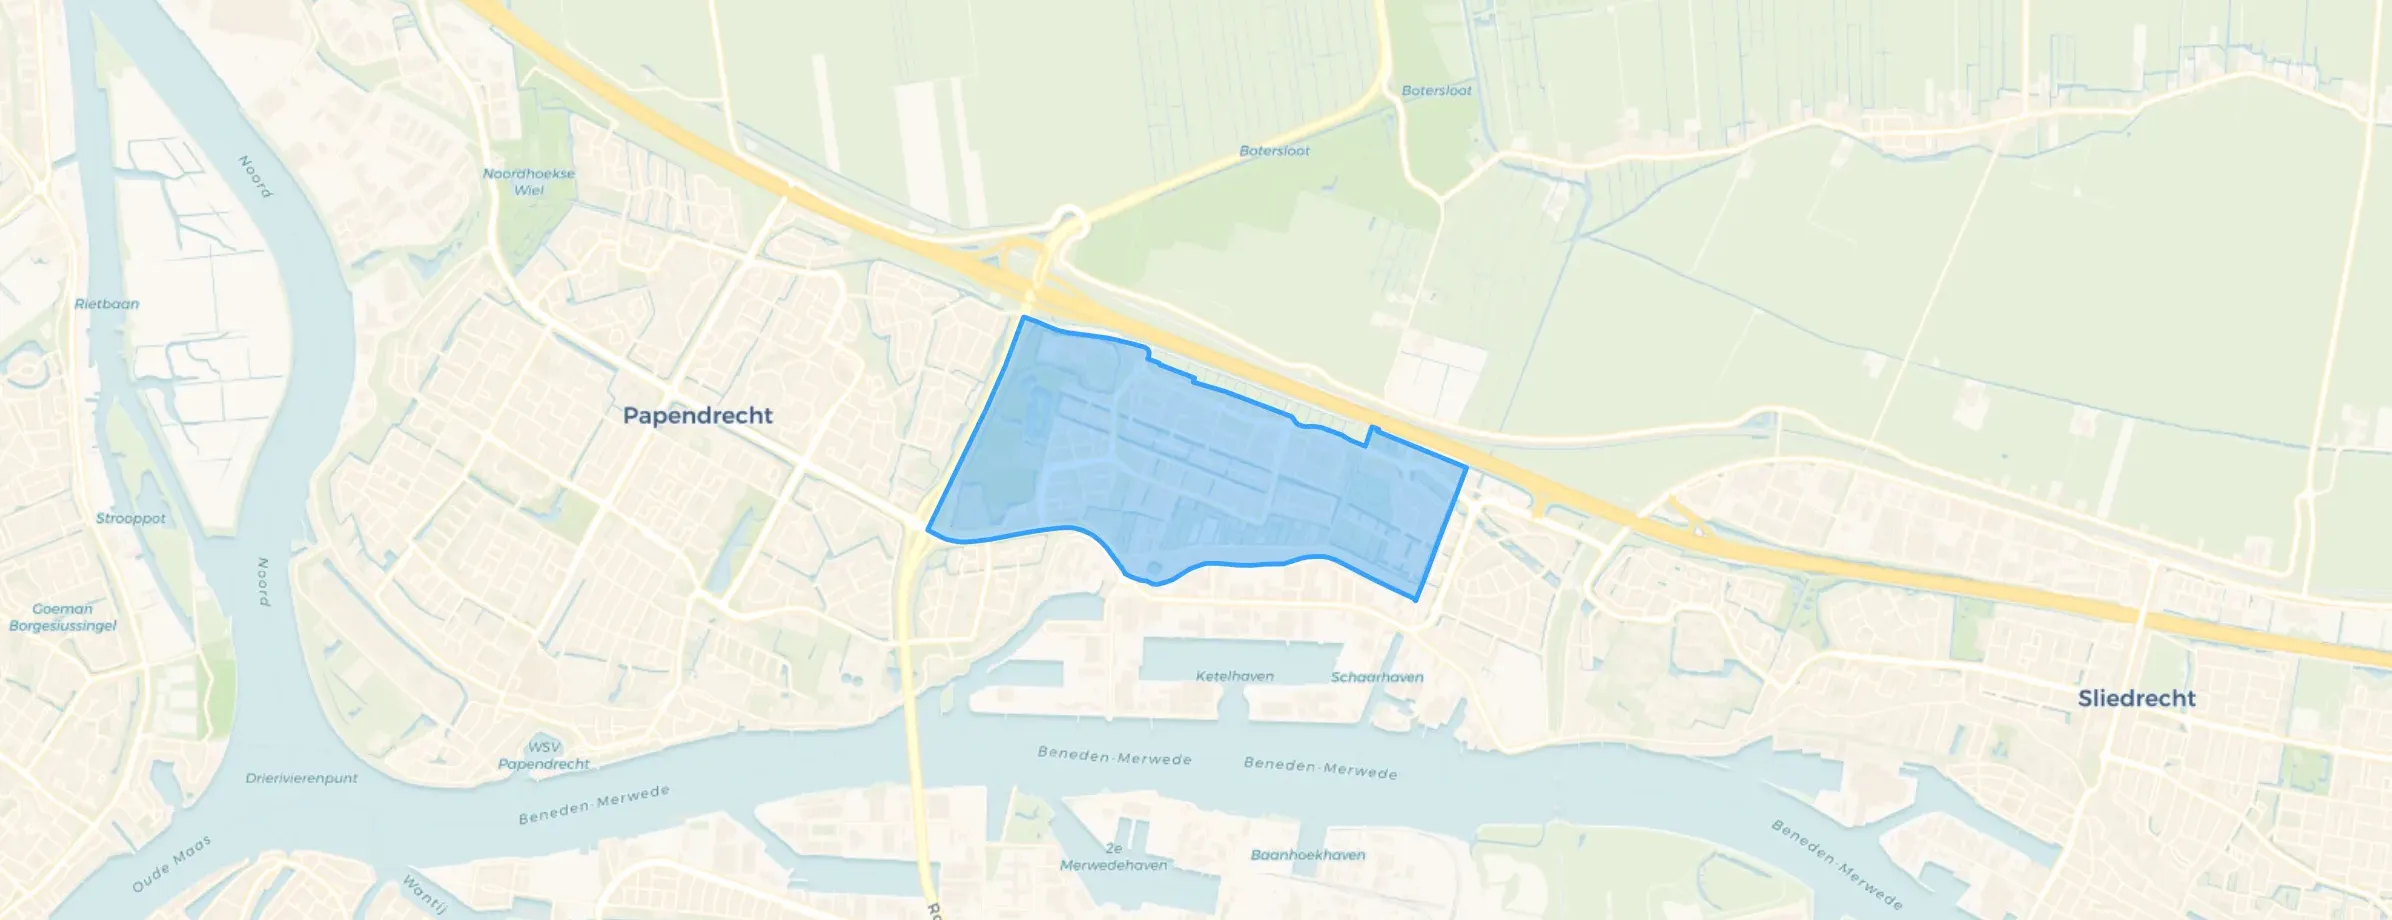
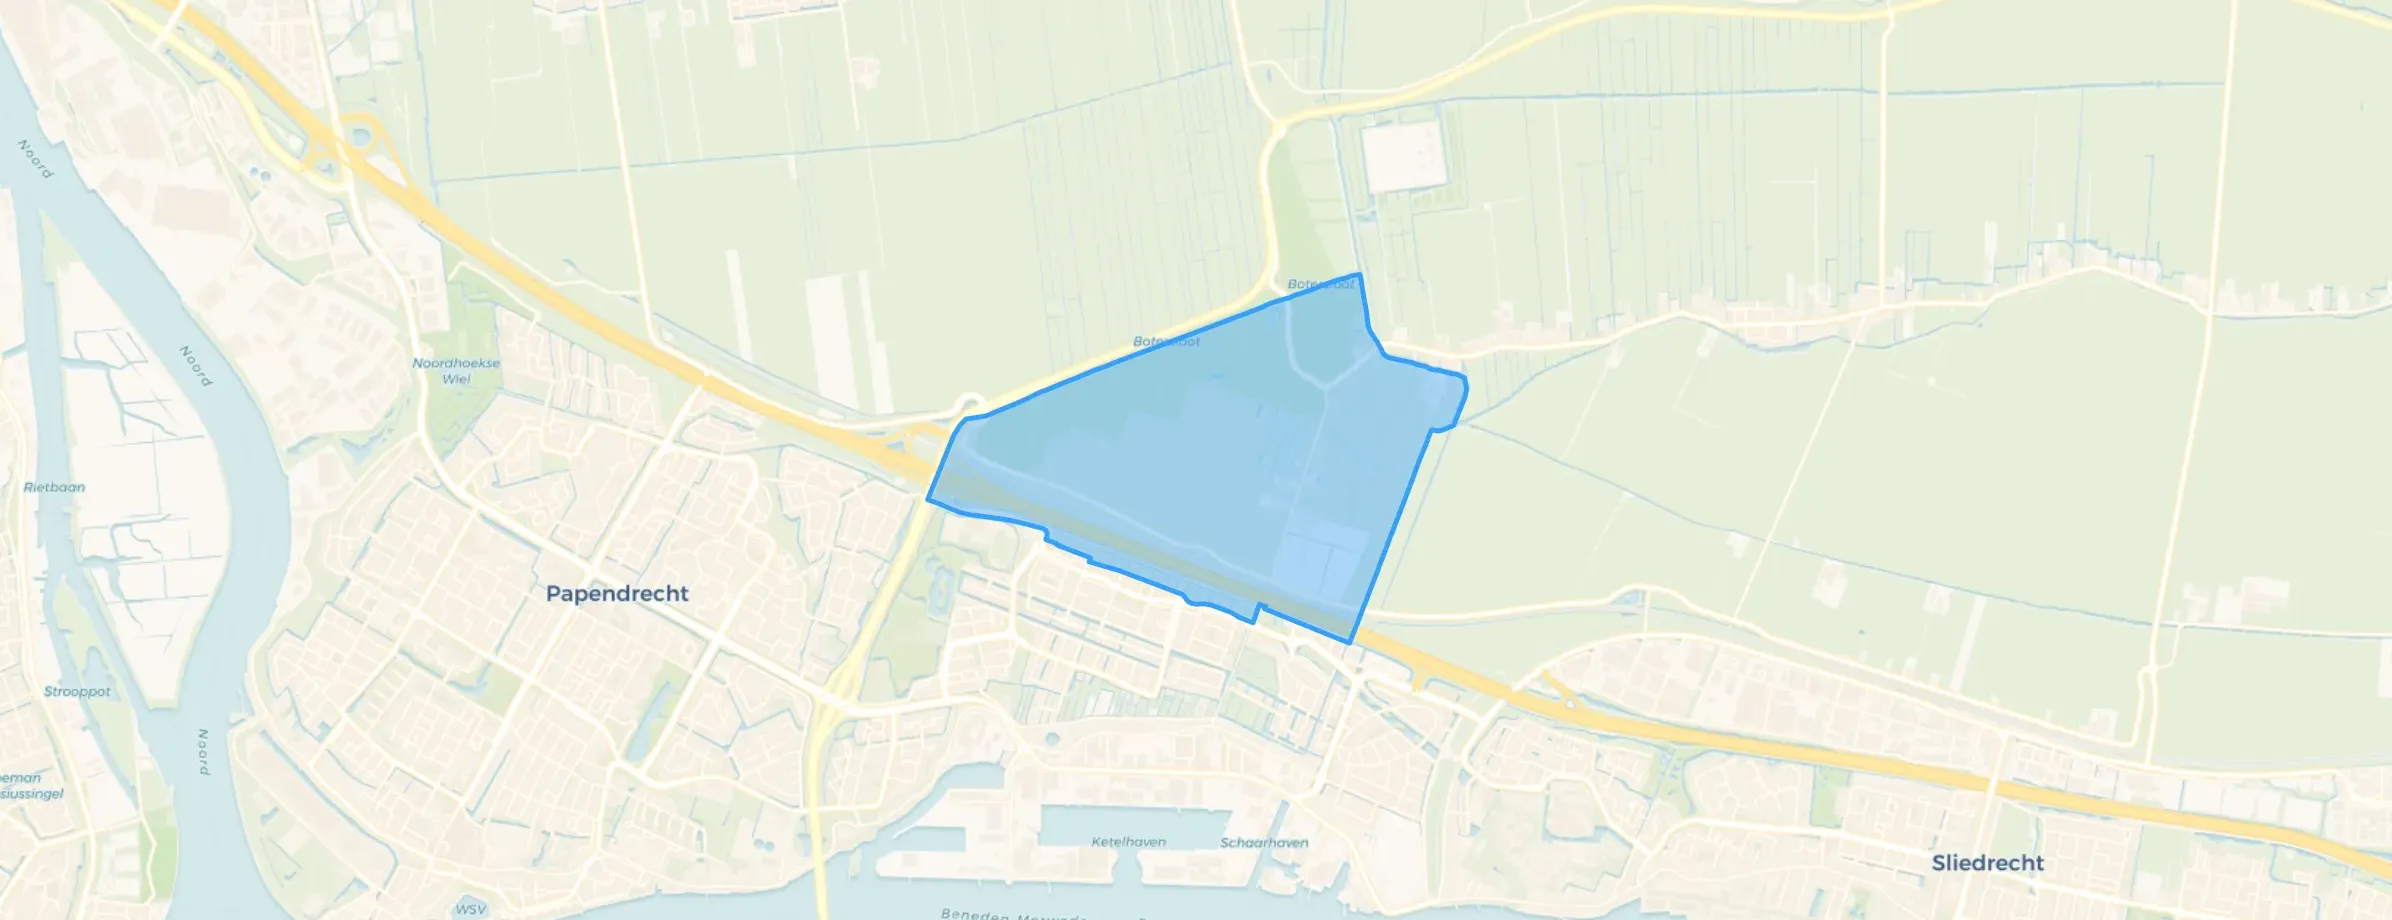
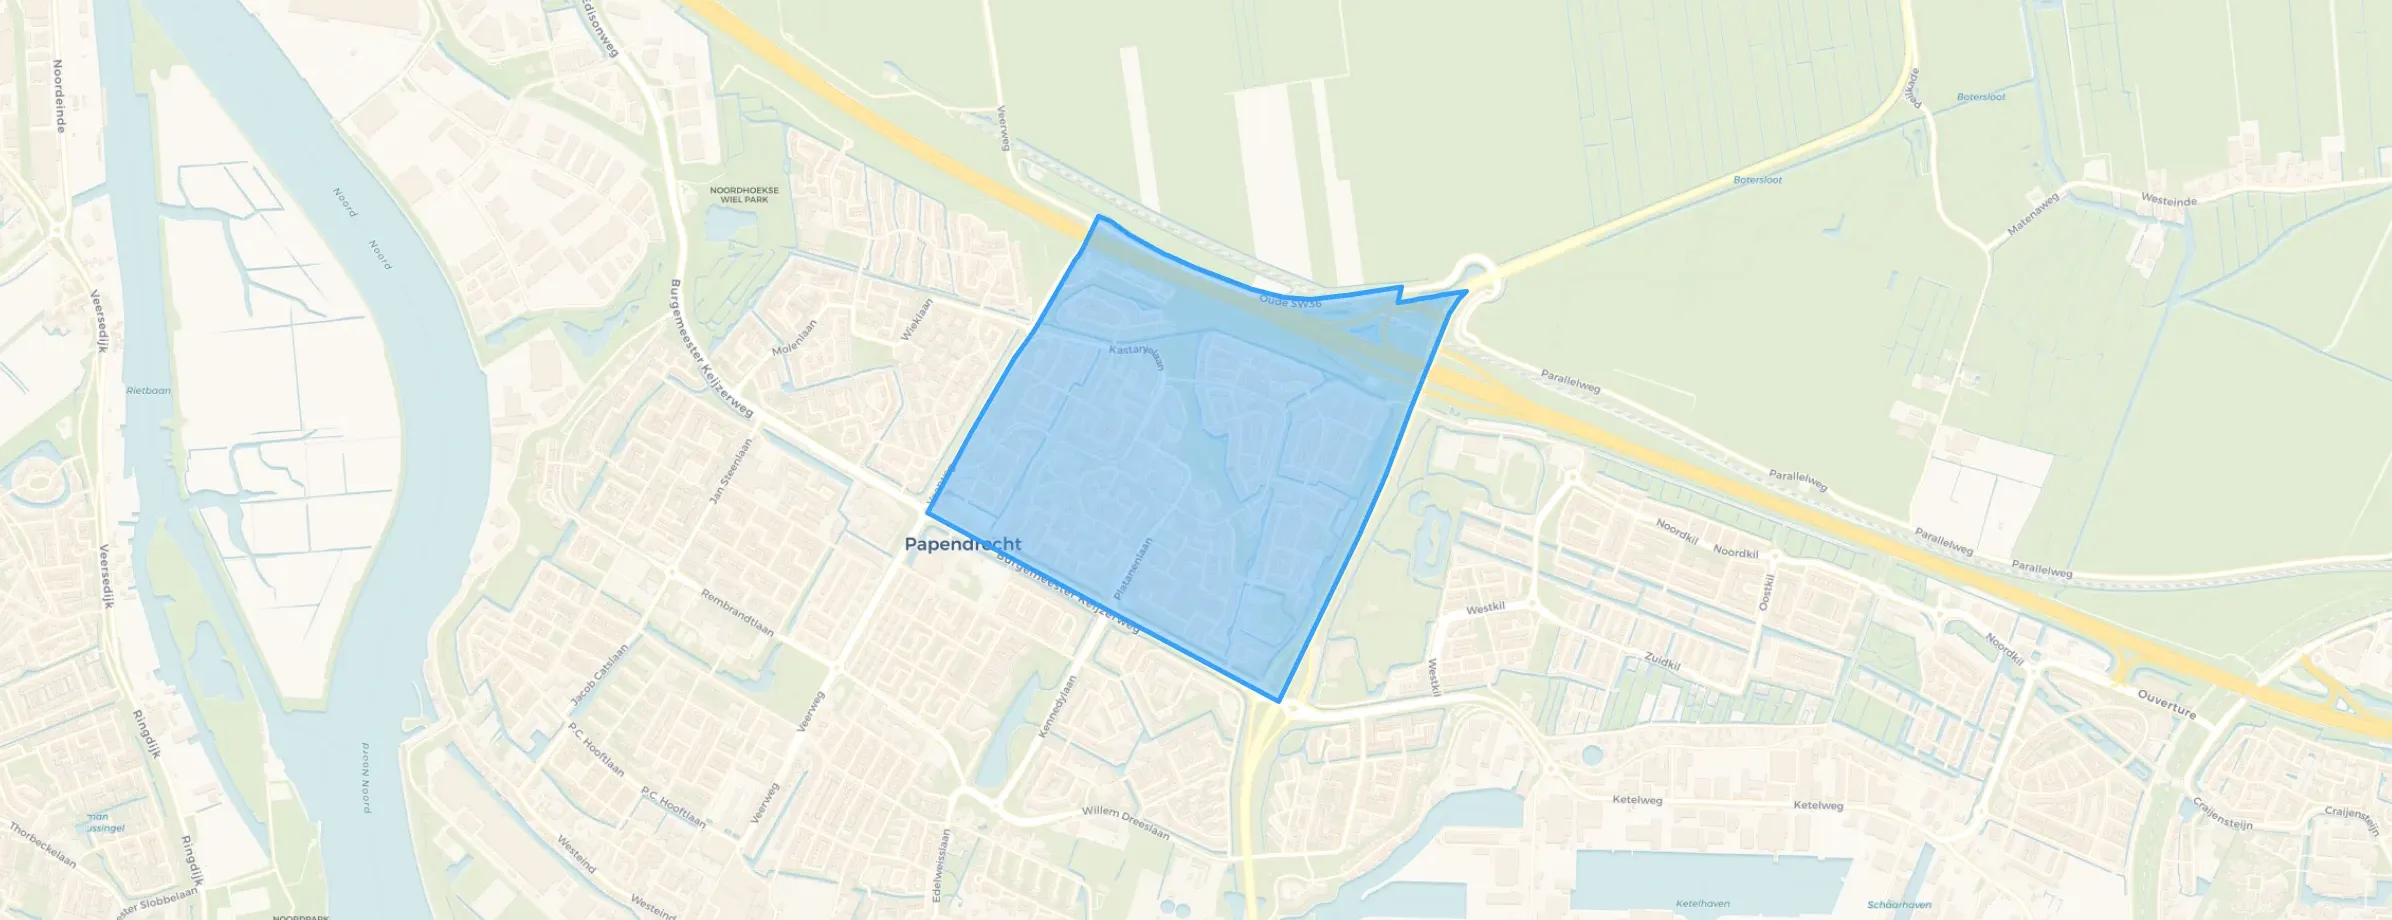
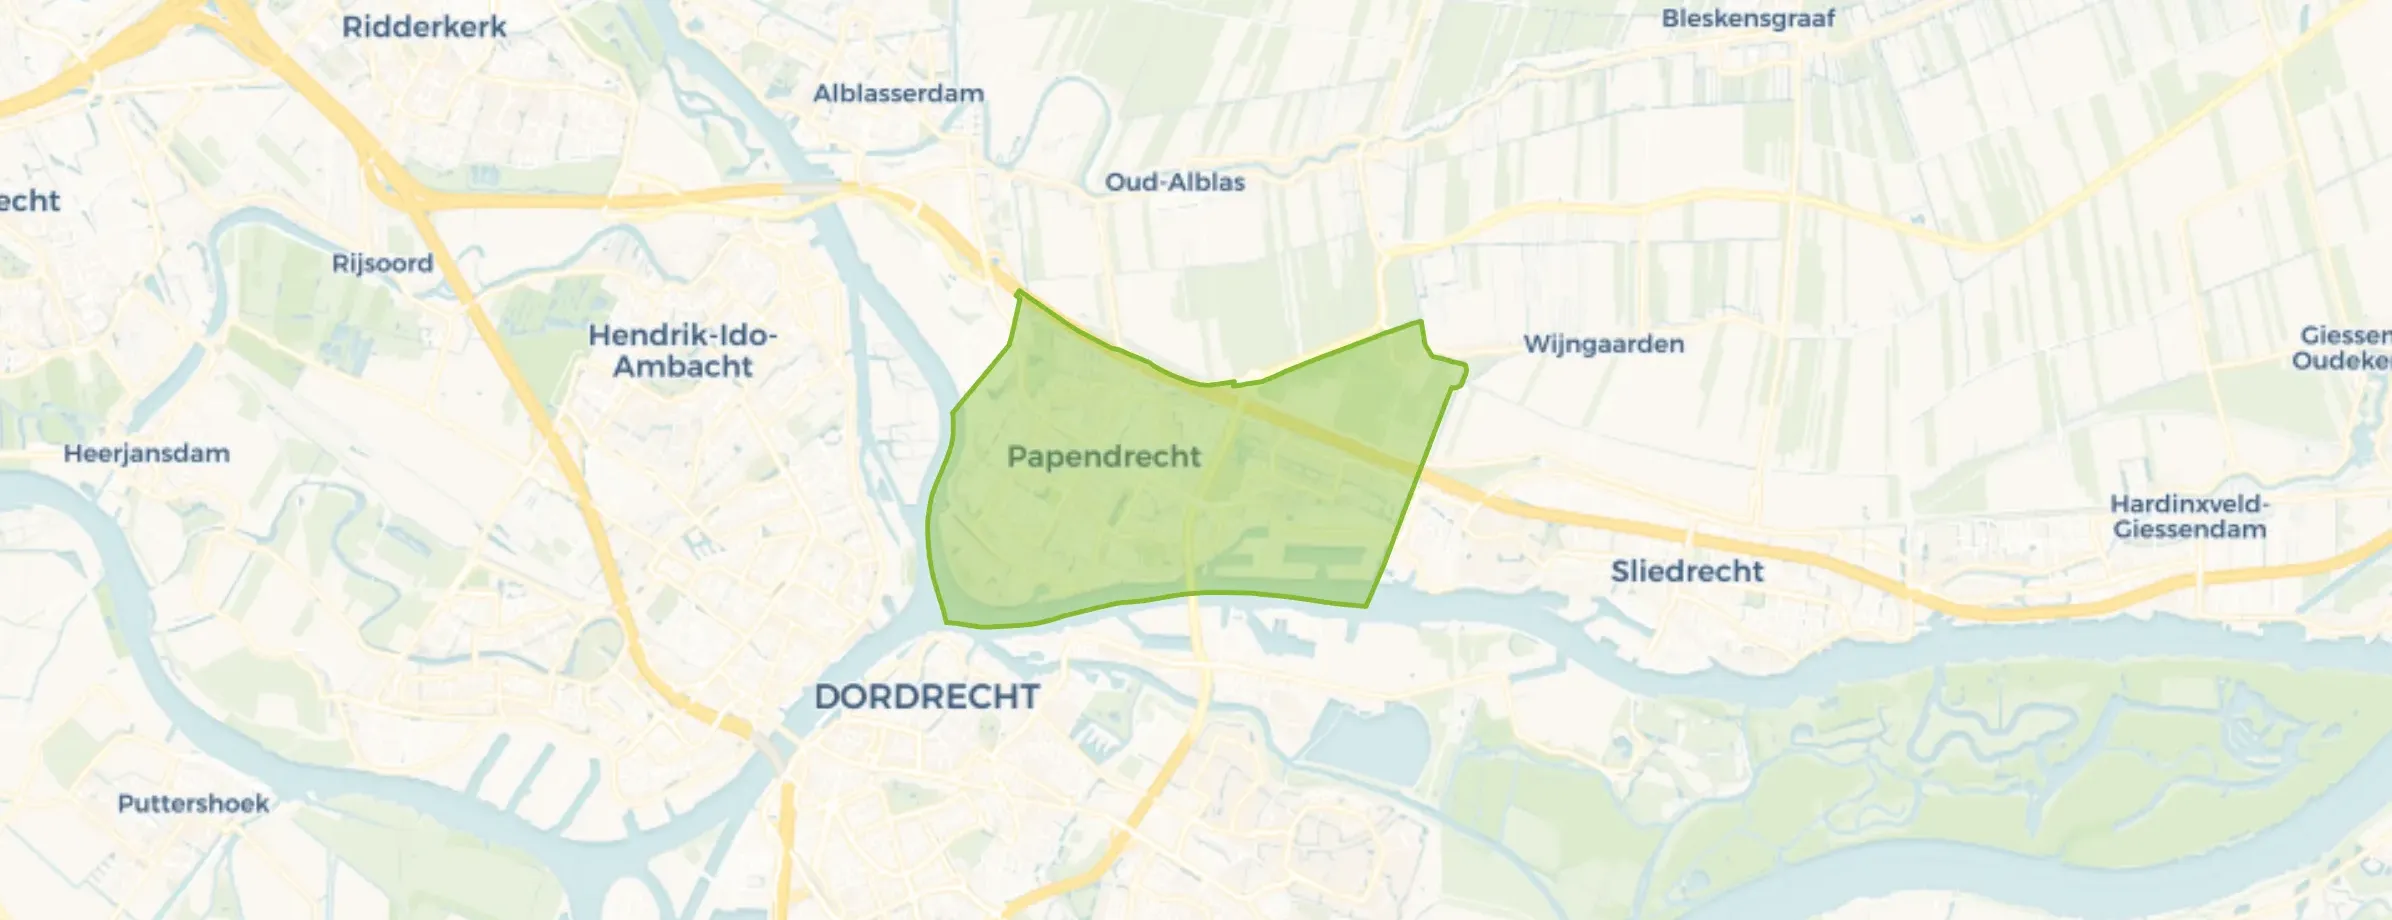
Papendrecht is located in the province of Zuid-Holland The municipality has a total area of 1.079 hectares, of which 941 hectares are land and 138 hectares are water. The municipality is coded as GM0590. The postcode area is 3351AA-3356XV.
Papendrecht has 32.299 residents. Of these, 49,4% are men and 50,6% are women. Most residents are 45 to 65 years (26,5%). The other age groups are 23,3% for '25 to 45 years', 23,2% for '65 years or older', 15,4% for '0 to 15 years' and 11,6% for '15 to 25 years'. Of the residents, 43,1% is unmarried, 43,1% is married, 8,2% is divorced and 5,6% is widowed. 25.092 residents originate from the Netherlands, 2.123 come from Europe and 5.084 come from countries outside Europe.
There are 14.318 households in Papendrecht. 33,3% of these are single-person households, 30,9% households without children and 35,7% households with children. The average household size is 2,2 persons. The national average is 2,1 persons.
In Papendrecht there are 26.300 income recipients. The average income per income recipient is €42.200, which is €0 (0%) lower than the national average of €42.200. Per resident, the average income is €34.800, which is €100 (0%) lower than the national average of €34.900. Most residents of Papendrecht are educated to an intermediate level. 49,4% have an intermediate education (HAVO, VWO or MBO 2-4), 25,8% have a lower education (VMBO or MBO 1) and 24,7% have a university or higher professional education (HBO/WO).
Of the 32.299 residents, around 73% are in paid employment, which amounts to 23.578 people. This is 1% higher than the national average of 72%. The majority of workers are in salaried employment (86%), while 14% are self-employed. In Papendrecht, 27% of residents receive a benefit. The largest group is those receiving a state pension (AOW). 6.770 people receive this benefit.
In Papendrecht there are 14.553 homes with an average assessed value (WOZ) of €368.000. Of these, around 97% are occupied and 3% unoccupied. Most homes are owner-occupied. This amounts to 34% rental homes and 66% owner-occupied homes. Of the homes, 66% privately owned, 28% owned by housing associations and 6% owned by other landlords. The most common construction periods in Papendrecht are 1950-1970 (25%) and 1970-1980 (24%).
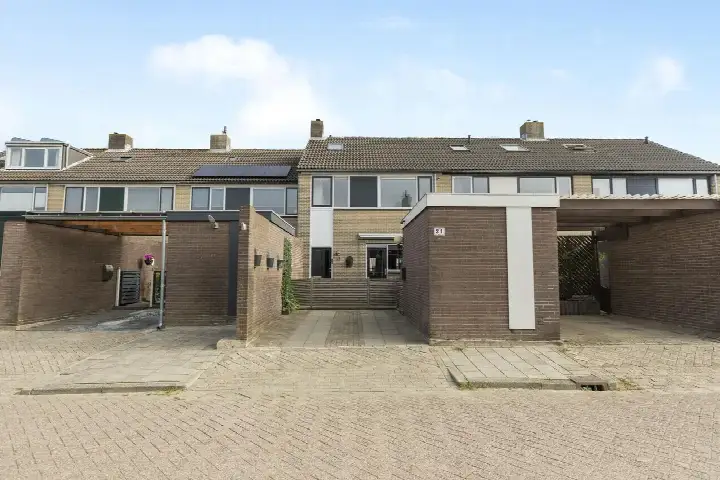
There are currently no homes for sale in Papendrecht. The most recently listed home is Rembrandtlaan 81 by Kooyman Eigen Huis B.V. op Funda. No homes were sold in Papendrecht over the past year.
There are currently no homes for rent in Papendrecht. The most recent home is Zonnedauw 60, offered by Schep Vastgoedmakelaars. No homes were let in Papendrecht over the past year.
No recent rental data available for Papendrecht.
In Papendrecht there are 9.882 addresses with a registered energy label. The most common labels are A (27%), C (27%) and B (19%). On average, an address in Papendrecht uses 2.560 kWh of electricity per year. This is 0% above the national average of 2.550 kWh. With an annual consumption of 700 m³ per address, natural gas consumption is 13% below the national average of 800 m³.
Heel veel drugsgebruikers in deze wijk met veel overlast van vervelende hangjongeren. Handhaving doet te weinig om wijk beter te maken. Wijk is een bouwput weinig groen, scholen doen maar wat. In de wijk vind je her en daar wietzakjes, hondenpoep op stoepen, hele vieze huizen vanaf buitenkant te zien, scholen staan niet open voor verbeteringen of suggesties. Voorzieningen is weinig keus en veel leegstand, ov rijdt maar twee keer per uur in de wijk, momenteel vrijwel onmogelijk om naar dordrecht te gaan
Auto-translated to English by AIDo what Marius does, come and remove weeds and nuisance from drug users
Auto-translated to English by AINot good at the moment with a dealer among us in the building
Auto-translated to English by AII live in my dream neighbourhood
Auto-translated to English by AIIt's a good neighbourhood, the neighbours are very friendly and we keep the neighbourhood clean together.
Auto-translated to English by AII live here fine, I never have any problems. Only I think everything is poorly paved and way too many weeds between the tiles.
Auto-translated to English by AINever had any problems, everyone accepts each other.
Auto-translated to English by AIPeople keep to themselves and there are few problems.
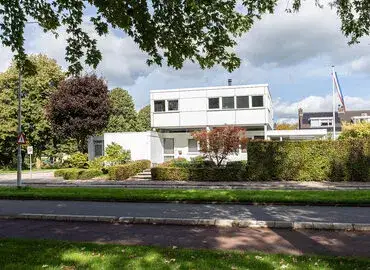
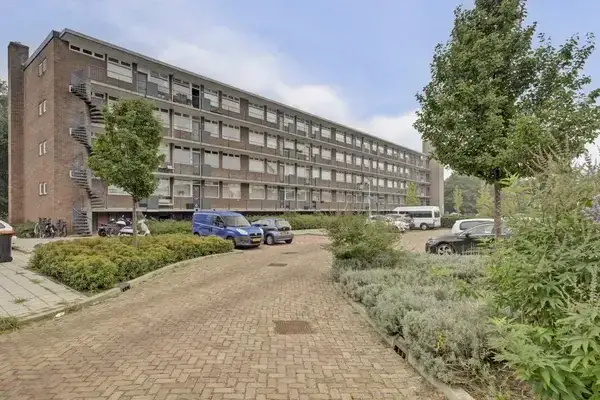
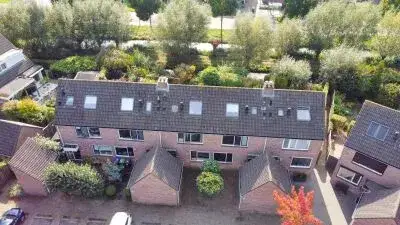
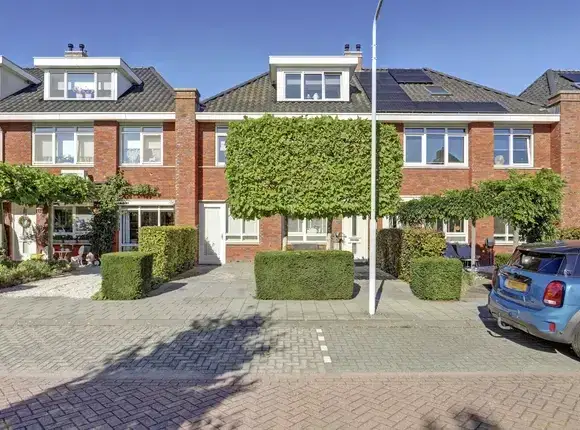
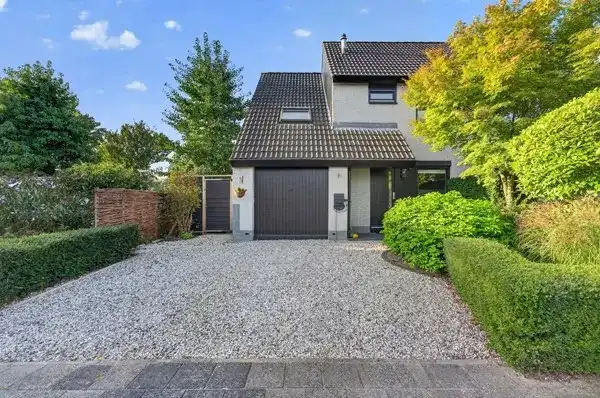
Auto-translated to English by AIThe housing stock is mainly post-war — 65% was built between 1945 and 1990. In addition, the most common type is terraced houses (41%).
Over the past year a home for sale in Papendrecht was listed for an average of €461,846 (€3,909 per m²). That is 13% below the Dutch national average.
A rental home in Papendrecht cost an average of €1,221 per month (€15 per m²). That is 43% below the national average.
Residents give Papendrecht a 7.1 out of 10 based on 15 reviews. Especially accessibility (7.7) scores well; education (6.6) receives the lowest rating.
Gemeente Papendrecht has 32,299 residents. Many families: 36% of the households have children.
The housing supply in Papendrecht is remarkably efficient: 51% has an A, A+ or B label. The average natural gas consumption per household is 700 m³ per year.
From Papendrecht you can on average reach a supermarket at 0.9 km, a GP at 1.0 km, a railway station at 4.0 km, a primary school at 0.6 km (as the crow flies, source: CBS).
Right now you will find 146 homes for sale in Papendrecht.