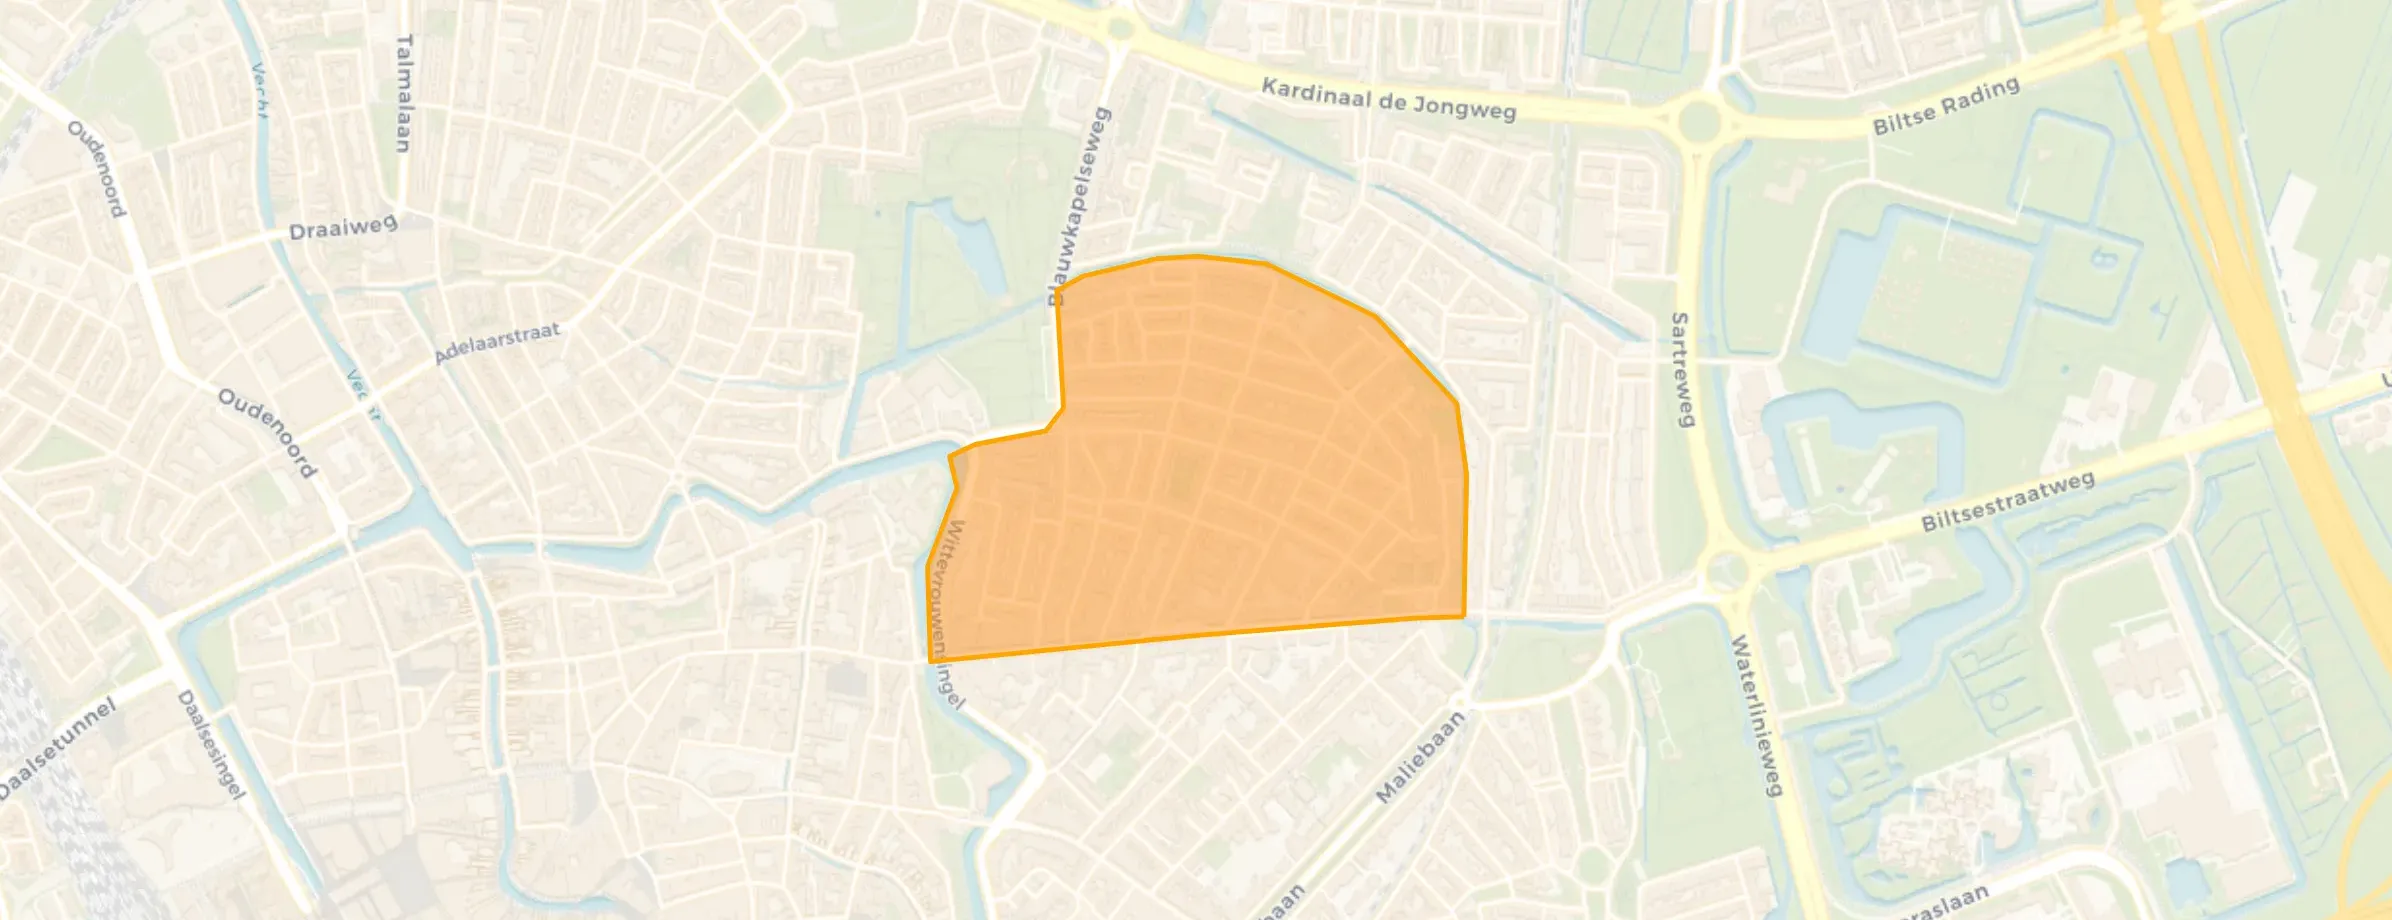
Neighbourhood in Utrecht
Wittevrouwen is located in the province of Utrecht, in the municipality of Utrecht, in the district Noordoost The neighbourhood has a total area of 37 hectares, of which 37 hectares are land and 0 hectares are water. The neighbourhood is coded as BU03440433. The postcode area is 3572BA-3572VZ.
One resident rates the neighbourhood as well below par with a score of 2.1. The resident describes this neighbourhood as 'Too expensive, dilapidated white neighbourhood,'. Based on a limited number of reviews, no clear trends are visible yet in this neighbourhood.
Wittevrouwen has 6.615 residents. Of these, 47,2% are men and 52,8% are women. Most residents are 25 to 45 years (36,7%). The other age groups are 21,4% for '45 to 65 years', 18,9% for '15 to 25 years', 12,2% for '0 to 15 years' and 10,8% for '65 years or older'. Of the residents, 72,5% is unmarried, 21,6% is married, 4,8% is divorced and 1,1% is widowed. 4.720 residents originate from the Netherlands, 870 come from Europe and 1.020 come from countries outside Europe.
There are 3.895 households in Wittevrouwen. 58,9% of these are single-person households, 22,2% households without children and 18,9% households with children. The average household size is 1,7 persons. The national average is 2,1 persons.
In Wittevrouwen there are 5.700 income recipients. The average income per income recipient is €53.400, which is €11.200 (27%) higher than the national average of €42.200. Per resident, the average income is €45.700, which is €10.800 (31%) higher than the national average of €34.900. Most residents of Wittevrouwen are highly educated. 71,4% have a university or higher professional education (HBO/WO), 22,4% have an intermediate education (HAVO, VWO or MBO 2-4) and 6,2% have a lower education (VMBO or MBO 1).
Of the 6.615 residents, around 79% are in paid employment, which amounts to 5.226 people. This is 7% higher than the national average of 72%. The majority of workers are in salaried employment (82%), while 18% are self-employed. In Wittevrouwen, 13% of residents receive a benefit. The largest group is those receiving a state pension (AOW). 610 people receive this benefit.
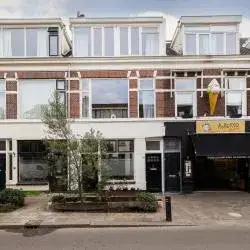
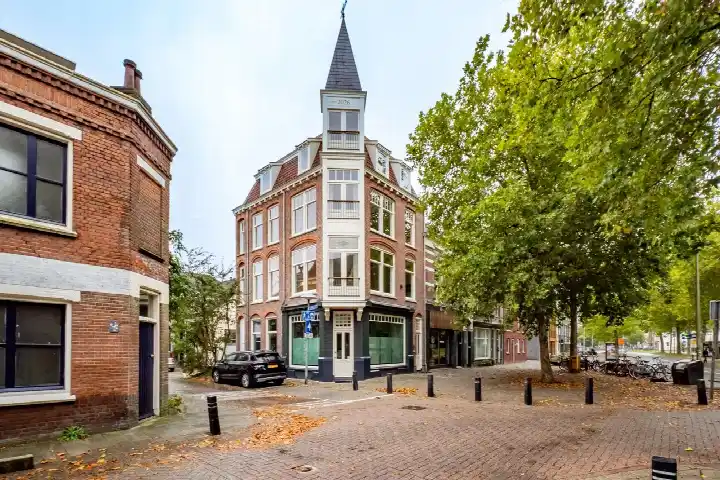
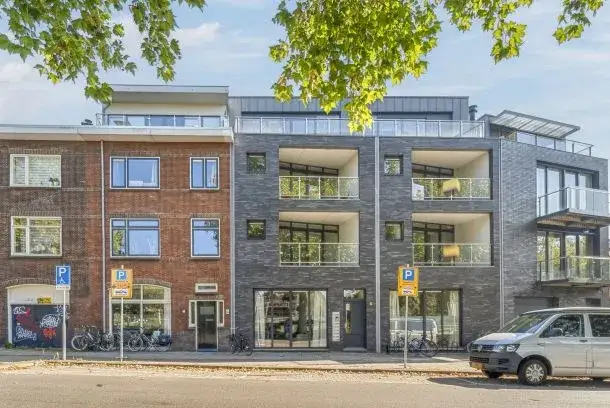
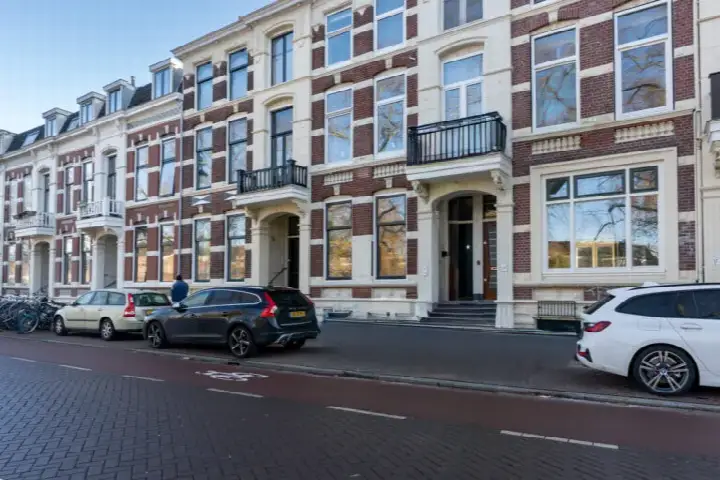
In Wittevrouwen there are 3.026 homes with an average assessed value (WOZ) of €586.000. Of these, around 95% are occupied and 5% unoccupied. Most homes are owner-occupied. This amounts to 37% rental homes and 63% owner-occupied homes. Of the homes, 63% privately owned, 12% owned by housing associations and 25% owned by other landlords. The most common construction periods in Wittevrouwen are 1700-1900 (63%) and 1900-1925 (20%).
There are currently 40 homes for sale in Wittevrouwen. The most recently listed home is Poortstraat 95 by Rosenberg & Van Leusden Makelaars Utrecht op Funda. Over the past year, 217 homes were sold in Wittevrouwen. On average, a home was sold within 46 days.
The average asking price for a home for sale in Wittevrouwen over the past year was €571.237. This is 3% lower than the average assessed value (WOZ) of €586.000. The average asking price per m² of plot is €7.140.
There are 16 homes for rent in Wittevrouwen. The most recent home is Kleinesingel 43B, offered by Interhouse makelaars Utrecht op Funda. Over the past year, 121 homes were let in Wittevrouwen. On average, a listing was let within 45 days.
The average rent for a rental home in Wittevrouwen over the past year was €2.663 per month. Per m² of plot area that is €15 per month.
In Wittevrouwen there are 2.023 addresses with a registered energy label. The most common labels are C (26%), D (16%) and A (14%). On average, an address in Wittevrouwen uses 2.090 kWh of electricity per year. This is 18% below the national average of 2.550 kWh. Natural gas consumption in this neighbourhood, at 800 m³ per year, exactly matches the national average.
A fascist neighbourhood that claims to be left-wing. Poorly maintained streets. Everywhere there is vomit, glass, and rubbish. Dirty pavements, graffiti everywhere, every street suffers from a huge nuisance of students. Students overpopulate the area. No diversity, too expensive shops. Only rich white people. Social inequality is clearly visible here. 1000 metres away in Overvecht people have nothing, here in abundance. Full of snobs. Social housing is only 6 percent, deliberately sold off, all homes are being split: unliveable, too much noise, and expanded with extra floors. People earn an average of 6-10,000 per month and look like tramps. There is no cohesion, people are focused on themselves, all islands. The atmosphere is gone. It was once a beautiful neighbourhood, but yuppies, damn students and damn expats have turned it into a white enclave of coke-sniffing egotrippers.
Auto-translated to English by AIThe housing stock is predominantly pre-war — 96% of the homes date from before 1945. In addition, the most common type is terraced houses (48%).
Over the past year a home for sale in Wittevrouwen was listed for an average of €572,902 (€6,831 per m²).
A rental home in Wittevrouwen cost an average of €2,433 per month (€29 per m²). That is 13% above the national average.
Buurt Wittevrouwen has 6,615 residents. The largest age group is 25 to 45 years (37%). Notably, 59% of the households are single-person households.
From Wittevrouwen you can on average reach a supermarket at 0.5 km, a GP at 0.6 km, a railway station at 1.9 km, a primary school at 0.4 km (as the crow flies, source: CBS).
Right now you will find 46 homes for sale and 17 homes for rent in Wittevrouwen.