Neighbourhood in Venlo
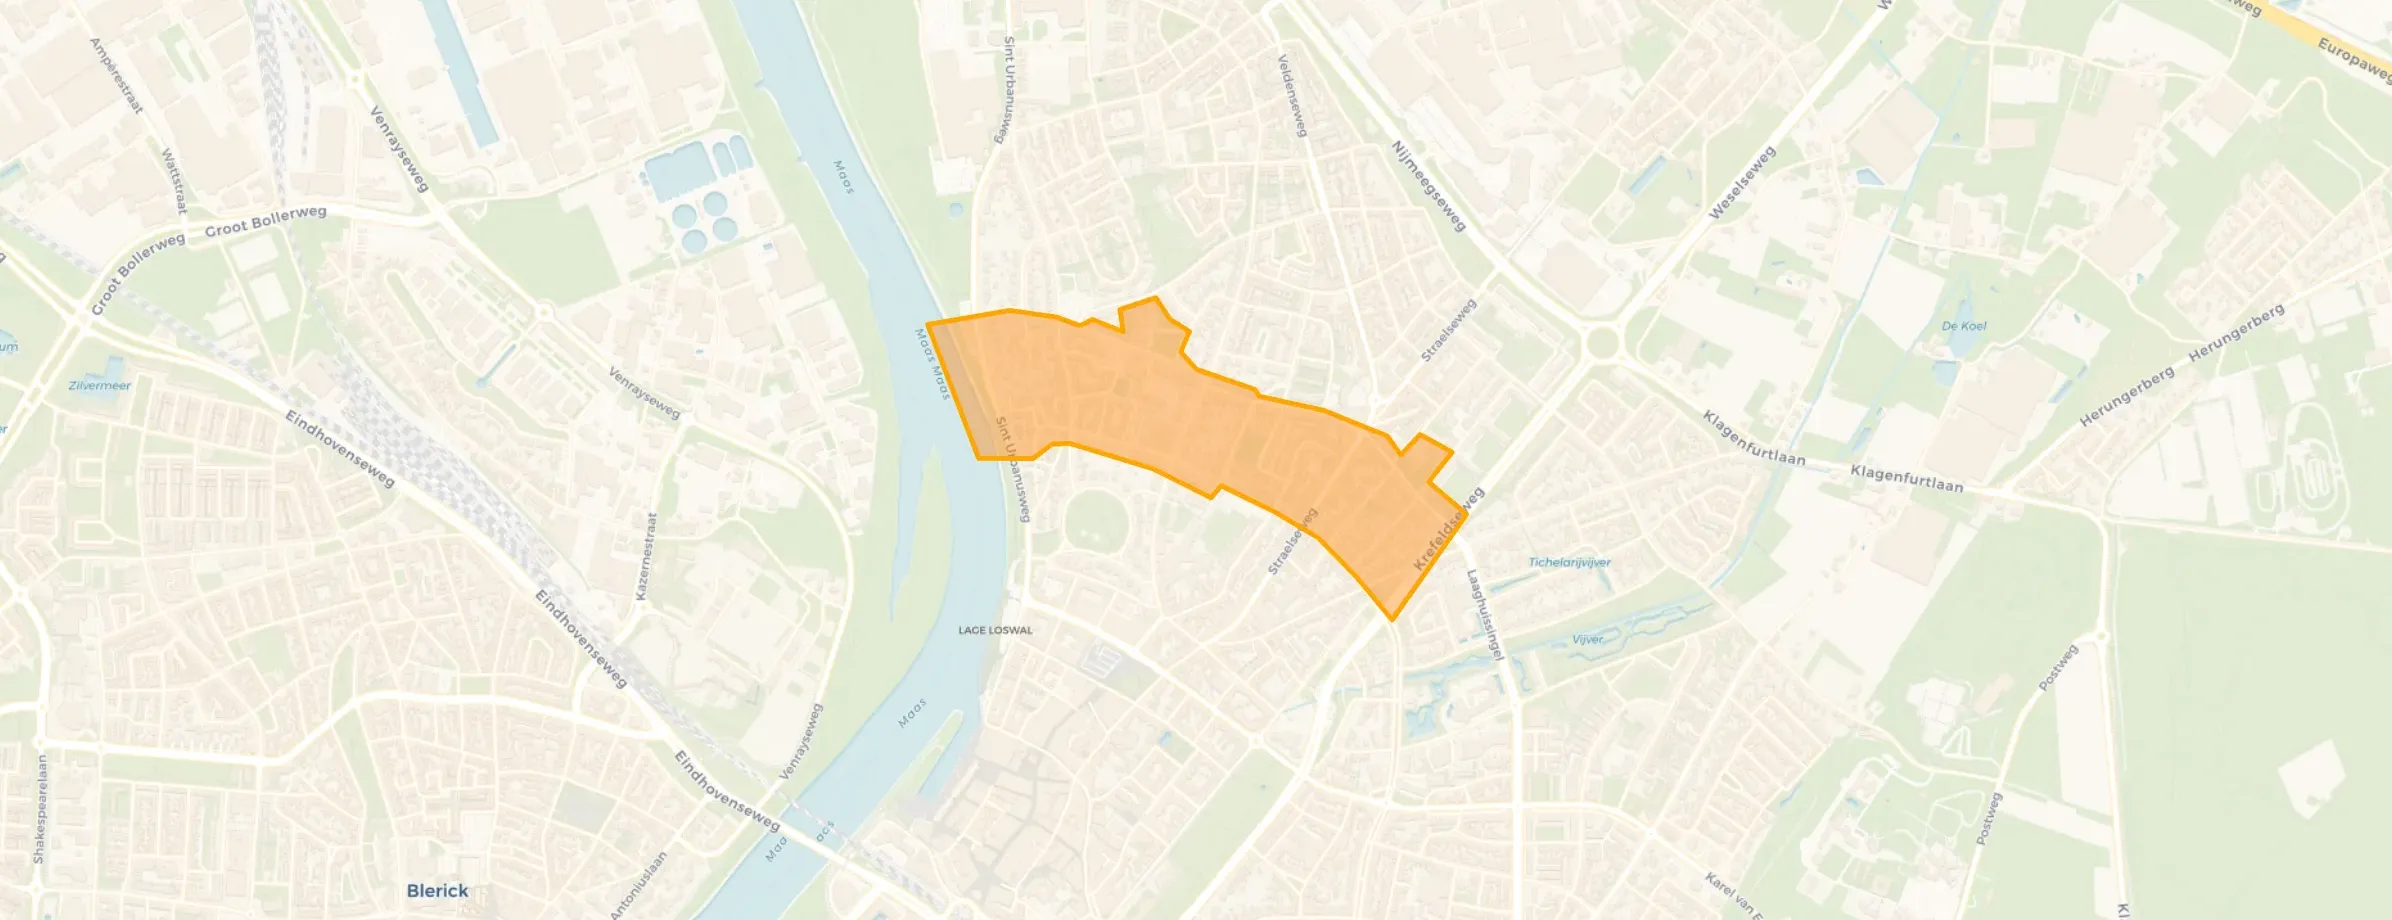
Craneveld is located in the province of Limburg, in the municipality of Venlo, in the district Venlo-Noord The neighbourhood has a total area of 37 hectares, of which 35 hectares are land and 2 hectares are water. The neighbourhood is coded as BU09831401. The postcode area is 5911EB-5914XZ.
Three residents rate the neighbourhood as good with a score of 7.7. They describe it as 'Venlo without the crowds.', 'Nice distance and tidy neighbourhood' and 'Cosy and nice'. Aspects such as safety, accessibility, amenities are rated well in this neighbourhood, while education and greenery score less well.
Craneveld has 2.040 residents. Of these, 49,0% are men and 50,7% are women. Most residents are 65 years or older (30,4%). The other age groups are 24,3% for '25 to 45 years', 22,3% for '45 to 65 years', 12,7% for '15 to 25 years' and 10,5% for '0 to 15 years'. Of the residents, 49,5% is unmarried, 29,4% is married, 11,5% is divorced and 10,0% is widowed. 1.415 residents originate from the Netherlands, 380 come from Europe and 250 come from countries outside Europe.
There are 1.135 households in Craneveld. 58,1% of these are single-person households, 23,8% households without children and 18,1% households with children. The average household size is 1,7 persons. The national average is 2,1 persons.
In Craneveld there are 1.600 income recipients. The average income per income recipient is €34.000, which is €8.200 (19%) lower than the national average of €42.200. Per resident, the average income is €29.900, which is €5.000 (14%) lower than the national average of €34.900. Most residents of Craneveld are educated to an intermediate level. 46,6% have an intermediate education (HAVO, VWO or MBO 2-4), 28,4% have a university or higher professional education (HBO/WO) and 25,0% have a lower education (VMBO or MBO 1).
Of the 2.040 residents, around 68% are in paid employment, which amounts to 1.387 people. This is 4% lower than the national average of 72%. The majority of workers are in salaried employment (84%), while 16% are self-employed. In Craneveld, 36% of residents receive a benefit. The largest group is those receiving a state pension (AOW). 550 people receive this benefit.
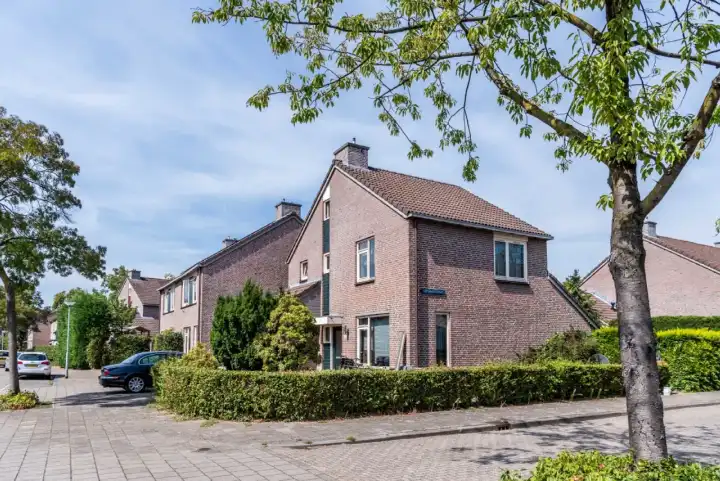
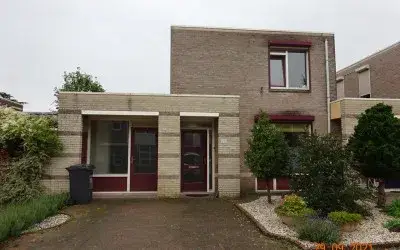
In Craneveld there are 1.117 homes with an average assessed value (WOZ) of €271.000. Of these, around 96% are occupied and 4% unoccupied. Most homes are rental properties. This amounts to 56% rental homes and 44% owner-occupied homes. Of the homes, 44% privately owned, 28% owned by housing associations, 28% owned by other landlords and 1% of unknown ownership. The most common construction periods in Craneveld are 1980-1990 (45%) and 1950-1970 (26%).
There are currently no homes for sale in Craneveld. The most recently listed home is Craneveldstraat 125 by Uiting Makelaars op Funda. No homes were sold in Craneveld over the past year.
There are currently no homes for rent in Craneveld. The most recent home is Straelseweg 167, offered by www.thuisinlimburg.nl. No homes were let in Craneveld over the past year.
No recent rental data available for Craneveld.
In Craneveld there are 687 addresses with a registered energy label. The most common labels are C (31%), A (24%) and B (18%). On average, an address in Craneveld uses 2.220 kWh of electricity per year. This is 13% below the national average of 2.550 kWh. Natural gas consumption, at 830 m³ per year, is 4% above the national average of 800 m³.
I experience a lot of safety here. Never felt like I had to watch out for my safety and the roads are nicely built. I rarely experience a car driving too fast here and I never hear anything bad from neighbours about burglaries or theft. You can easily chat with people on the street that you see often because they walk their dogs, and I was even helped once with my bike when the chain came off. It is generally clean, only sometimes there are extra bags of rubbish and furniture by the containers. Houses are fine, nothing to complain about. They all look neat inside and out. Internet works well, fibre optic and electricity never go out. There are many playgrounds. Walking opportunities along the Maas and several supermarkets within walking distance. Also several bus stops and a fitness centre. You can easily get there on foot, by bike or by car. There is only a secondary school in the neighbourhood.
Auto-translated to English by AIMany different nationalities that treat each other with respect. Close to the city and within walking/cycling distance
Auto-translated to English by AIThe neighbourhood has a favourable location relative to the city, nature and amenities. The immediate neighbours are lovely. There is a lot of diversity in this neighbourhood, but it goes well together. Occasionally there is theft in the neighbourhood, which reduces safety. There is a staircase down to walk to the Maas and towards the city. I enjoy living here!
Auto-translated to English by AIThe housing stock is mainly post-war — 76% was built between 1945 and 1990. In addition, the most common type is flats (61%).
Over the past year a home for sale in Craneveld was listed for an average of €391,125 (€3,049 per m²). That is 26% below the Dutch national average. Last quarter prices rose by 13%.
Residents give Craneveld a 7.7 out of 10 based on 3 reviews. Especially safety (8.3) scores well; nature and greenery (6.3) receives the lowest rating.
Buurt Craneveld has 2,040 residents. The largest age group is 65+ years (30%). Notably, 58% of the households are single-person households.
From Craneveld you can on average reach a supermarket at 0.5 km, a GP at 0.4 km, a railway station at 1.9 km, a primary school at 0.3 km (as the crow flies, source: CBS).
Right now you will find 16 homes for sale and 5 homes for rent in Craneveld.