Neighbourhood in Doetinchem
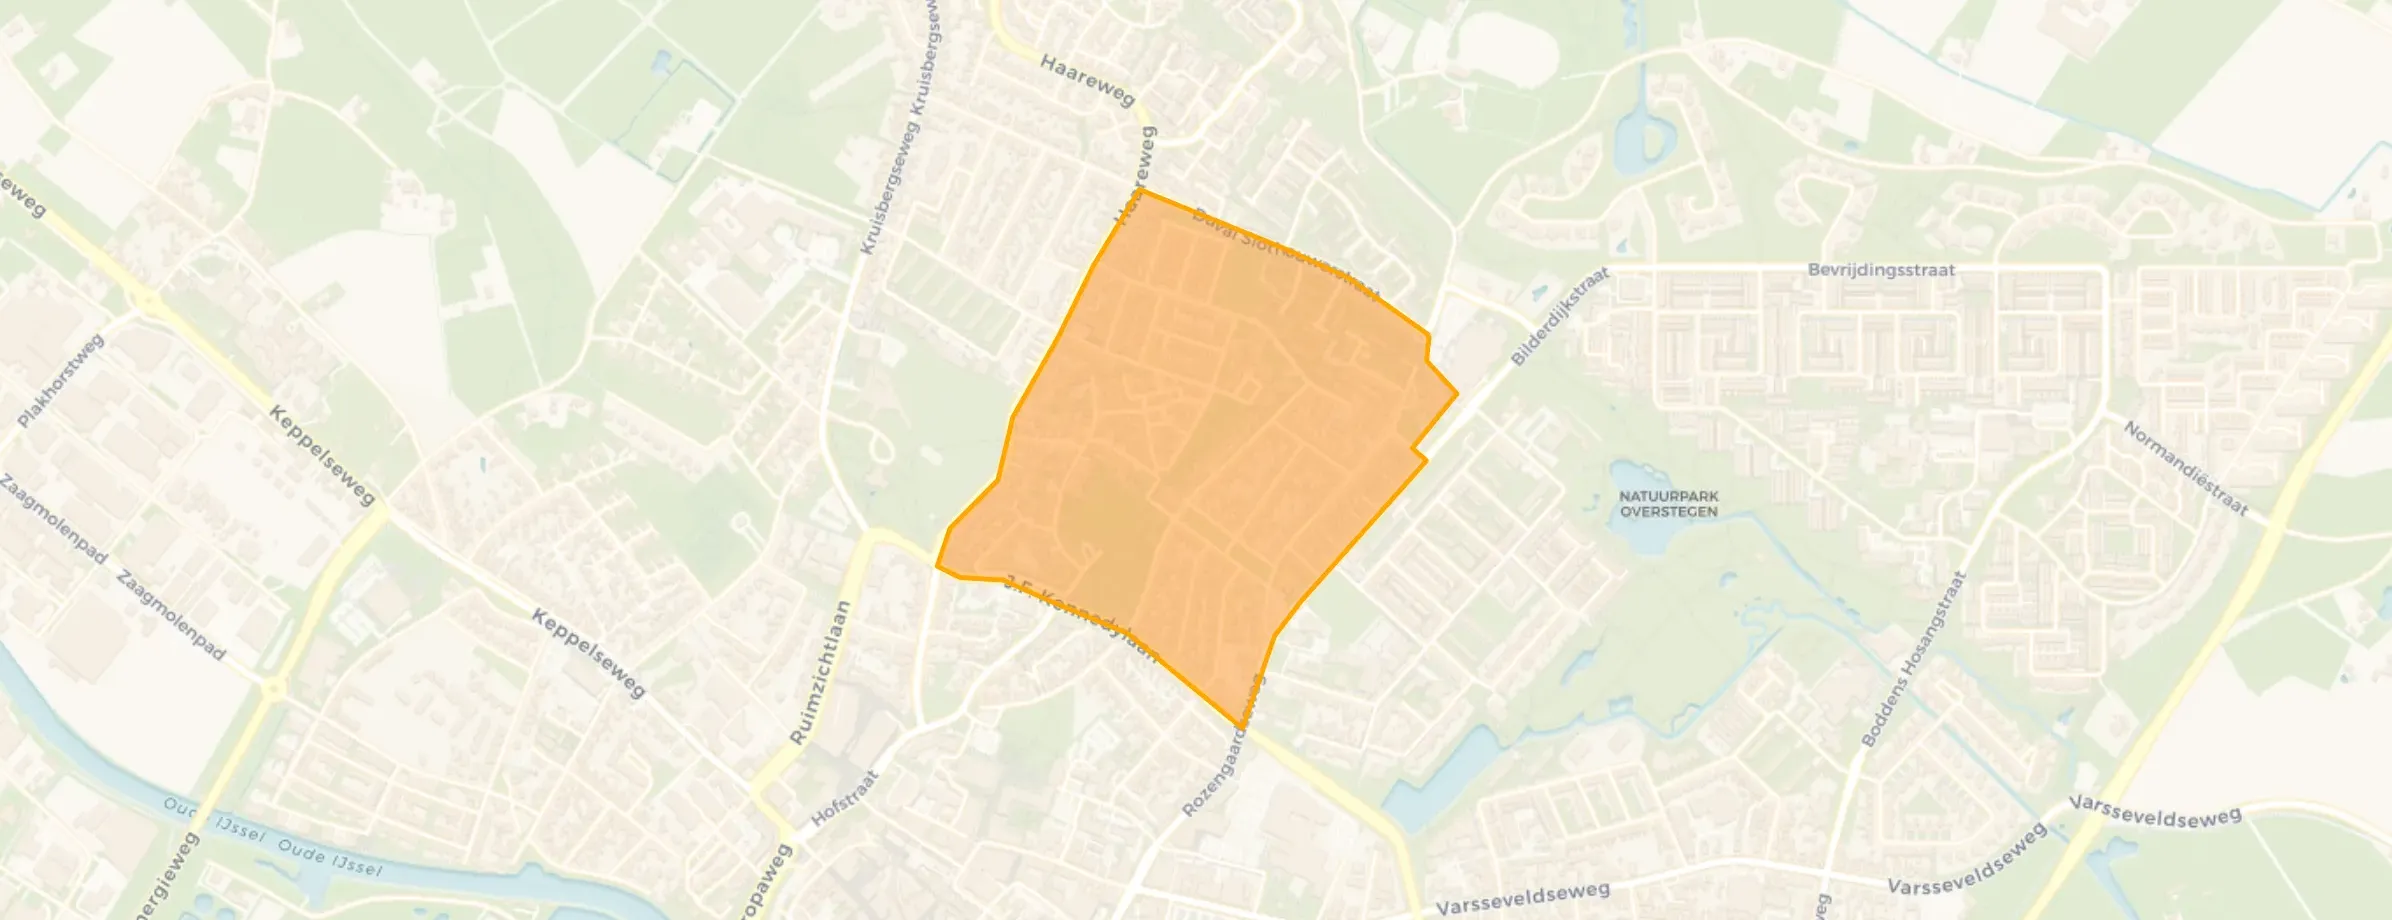
De IJkenberg is located in the province of Gelderland, in the municipality of Doetinchem, in the district Bezelhorst / De Kruisberg / Ijkenberg The neighbourhood has a total area of 42 hectares, of which 42 hectares are land and 0 hectares are water. The neighbourhood is coded as BU02220905. The postcode area is 7009ED-7009ND.
Three residents rate the neighbourhood as more than satisfactory with a score of 6.3. They describe it as 'A good neighbourhood, I have something for', 'Good neighbourhood but little to do' and 'Bad neighbourhood'. Aspects such as greenery, accessibility, safety are rated well in this neighbourhood, while amenities and education score less well.
De IJkenberg has 2.500 residents. Of these, 49,6% are men and 50,6% are women. Most residents are 25 to 45 years (26,4%). The other age groups are 25,4% for '45 to 65 years', 17,4% for '0 to 15 years', 16,6% for '65 years or older' and 14,2% for '15 to 25 years'. Of the residents, 55,2% is unmarried, 30,8% is married, 9,6% is divorced and 4,6% is widowed. 1.575 residents originate from the Netherlands, 190 come from Europe and 735 come from countries outside Europe.
There are 1.090 households in De IJkenberg. 37,6% of these are single-person households, 24,3% households without children and 38,1% households with children. The average household size is 2,3 persons. The national average is 2,1 persons.
In De IJkenberg there are 1.900 income recipients. The average income per income recipient is €26.700, which is €15.500 (37%) lower than the national average of €42.200. Per resident, the average income is €21.000, which is €13.900 (40%) lower than the national average of €34.900. Most residents of De IJkenberg are educated to a lower level. 54,8% have a lower education (VMBO or MBO 1), 36,7% have an intermediate education (HAVO, VWO or MBO 2-4) and 8,5% have a university or higher professional education (HBO/WO).
Of the 2.500 residents, around 58% are in paid employment, which amounts to 1.450 people. This is 14% lower than the national average of 72%. The majority of workers are in salaried employment (84%), while 16% are self-employed. In De IJkenberg, 32% of residents receive a benefit. The largest group is those receiving a state pension (AOW). 370 people receive this benefit.
In De IJkenberg there are 1.081 homes with an average assessed value (WOZ) of €238.000. Of these, around 98% are occupied and 2% unoccupied. Most homes are rental properties. This amounts to 80% rental homes and 20% owner-occupied homes. Of the homes, 20% privately owned, 76% owned by housing associations and 4% owned by other landlords. The most common construction periods in De IJkenberg are 1950-1970 (32%) and 1970-1980 (24%).
There are currently 3 homes for sale in De IJkenberg. The most recently listed home is Volbedastraat 48 by Thoma van Dijk Siebelink Makelaars Doetinchem op Funda. Over the past year, 18 homes were sold in De IJkenberg. On average, a home was sold within 23 days.
The average asking price for a home for sale in De IJkenberg over the past year was €384.818. This is 62% higher than the average assessed value (WOZ) of €238.000. The average asking price per m² of plot is €2.938.
There are currently no homes for rent in De IJkenberg. The most recent home is Sumatraplein 72, offered by www.thuisindeachterhoek.nl. No homes were let in De IJkenberg over the past year.
No recent rental data available for De IJkenberg.
In De IJkenberg there are 885 addresses with a registered energy label. The most common labels are C (32%), A (28%) and B (21%). On average, an address in De IJkenberg uses 2.330 kWh of electricity per year. This is 9% below the national average of 2.550 kWh. Natural gas consumption, at 850 m³ per year, is 6% above the national average of 800 m³.
They are friendly people, they kindly say hello and also have a chat
Auto-translated to English by AICosy
Auto-translated to English by AILots of crime and little police. The Tokkies can do whatever they want. On benefits and causing trouble all day long. Setting off fireworks, playing loud music and antisocial behaviour.
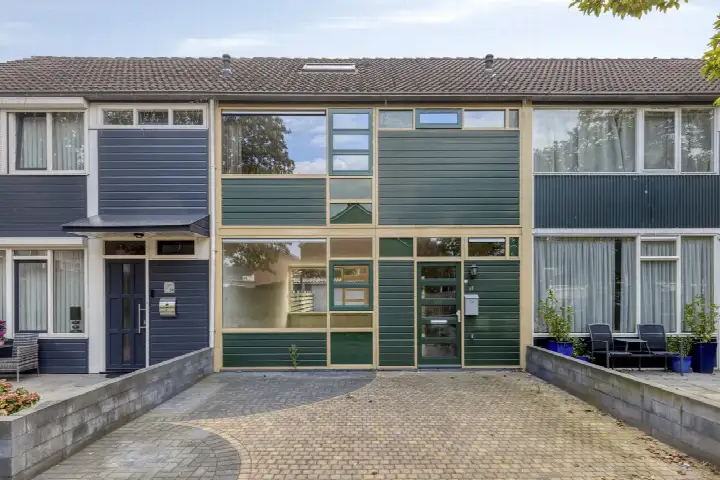
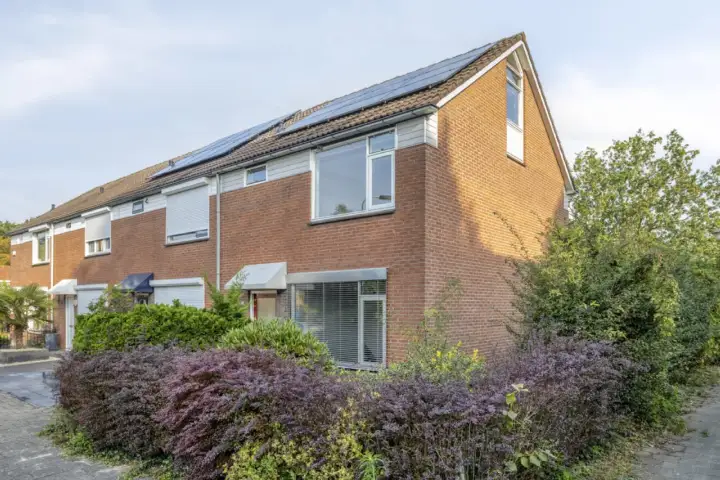
Auto-translated to English by AIThe housing stock is mainly post-war — 74% was built between 1945 and 1990. In addition, the most common type is terraced houses (46%).
Over the past year a home for sale in De IJkenberg was listed for an average of €463,648 (€3,264 per m²). That is 12% below the Dutch national average.
Residents give De IJkenberg a 6.3 out of 10 based on 3 reviews. The strongest score is for nature and greenery (7.7), the weakest for education (5.5).
Buurt De IJkenberg has 2,500 residents. Many families: 38% of the households have children.
From De IJkenberg you can on average reach a supermarket at 0.4 km, a GP at 0.5 km, a railway station at 2.2 km, a primary school at 0.8 km (as the crow flies, source: CBS).