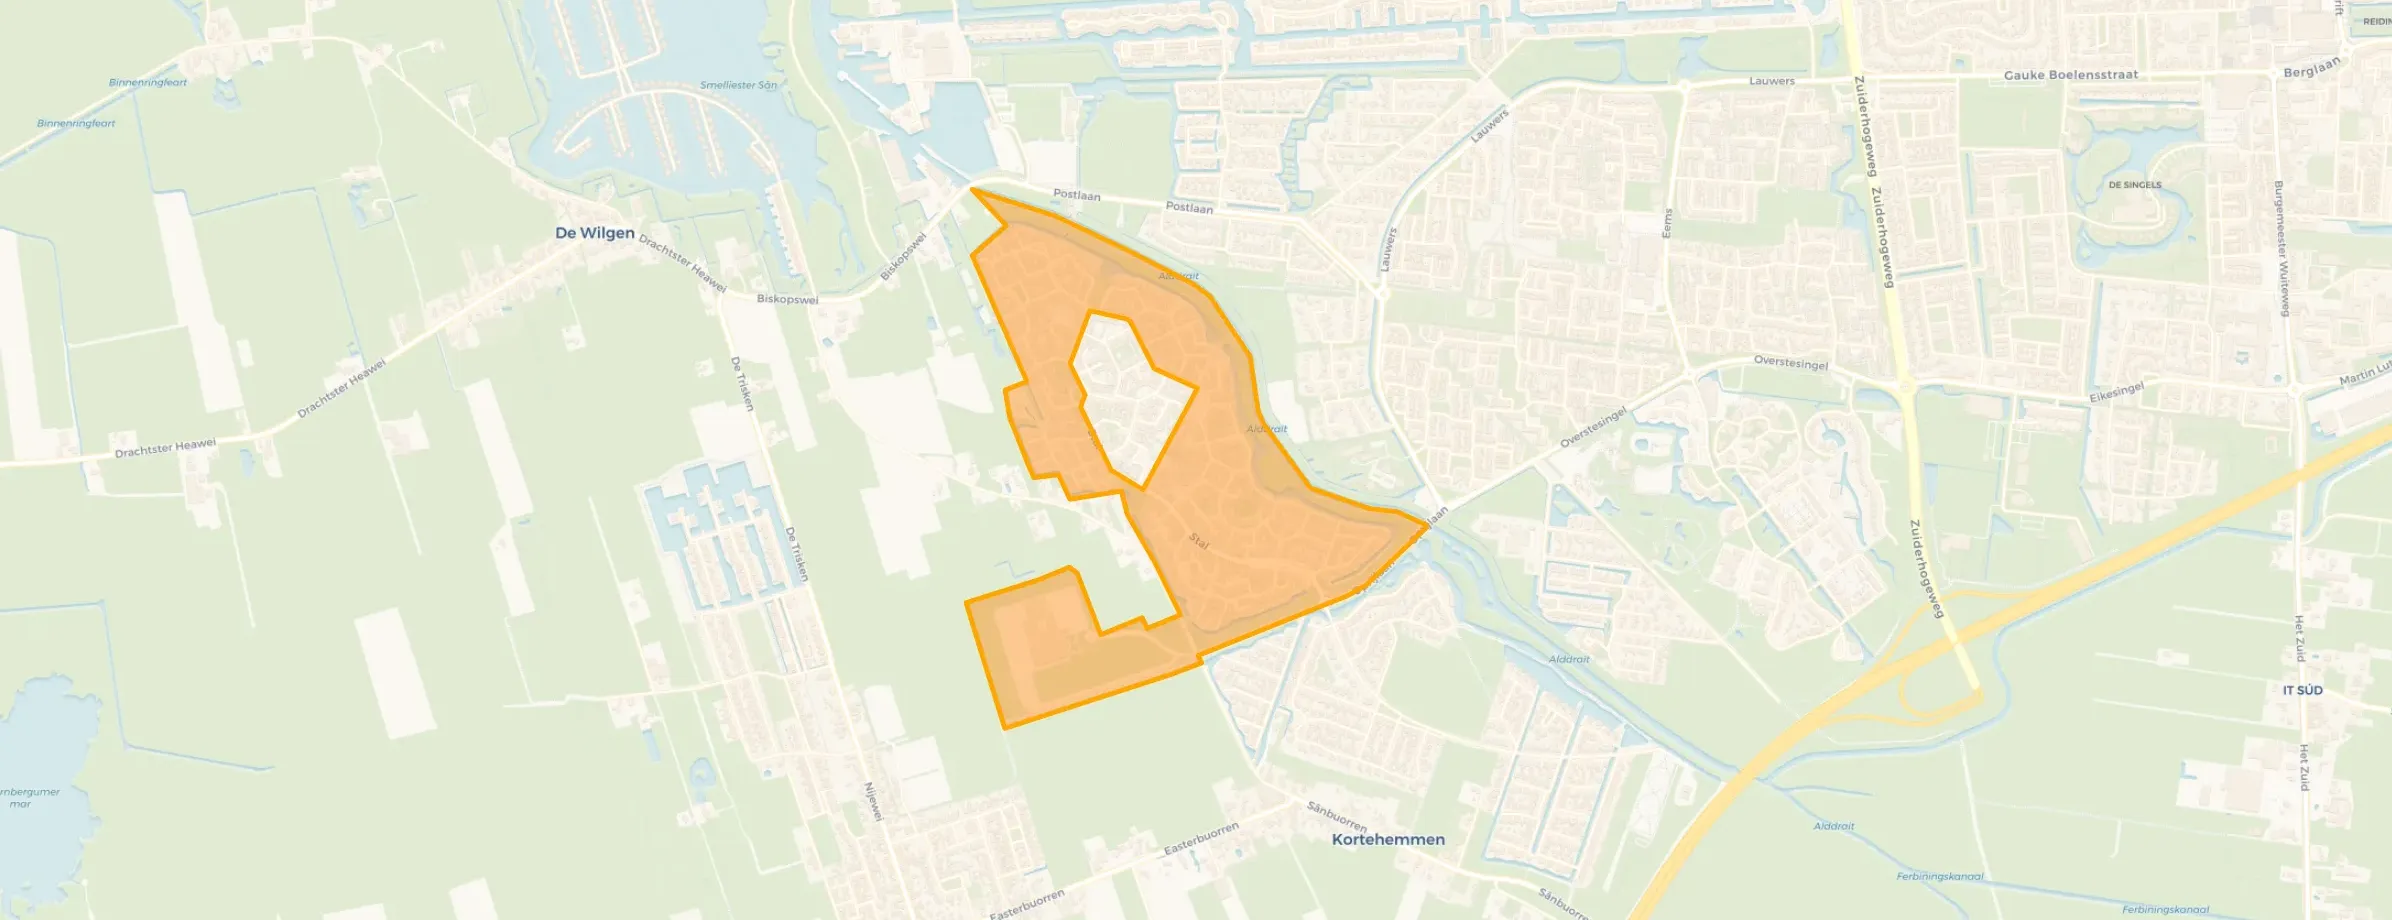
Neighbourhood in Smallingerland
De Trisken rondom is located in the province of Friesland, in the municipality of Smallingerland, in the district De Trisken The neighbourhood has a total area of 67 hectares, of which 63 hectares are land and 4 hectares are water. The neighbourhood is coded as BU00901302. The postcode area is 9205AA-9205CZ.
Four residents rate the neighbourhood as good with a score of 7.6. They describe it as 'Quiet, safe and green neighbourhood', 'Nice family-friendly neighbourhood' and 'Fine'. Residents experience big differences in this neighbourhood: greenery, education, housing receive high ratings, while cleanliness and accessibility are mentioned as weak points.
De Trisken rondom has 2.500 residents. Of these, 50,4% are men and 49,6% are women. Most residents are 45 to 65 years (27,8%). The other age groups are 24,8% for '25 to 45 years', 18,4% for '65 years or older', 16,0% for '0 to 15 years' and 13,0% for '15 to 25 years'. Of the residents, 47,4% is unmarried, 40,6% is married, 8,8% is divorced and 3,2% is widowed. 1.950 residents originate from the Netherlands, 115 come from Europe and 435 come from countries outside Europe.
There are 1.080 households in De Trisken rondom. 35,2% of these are single-person households, 31,0% households without children and 33,8% households with children. The average household size is 2,2 persons. The national average is 2,1 persons.
In De Trisken rondom there are 1.900 income recipients. Most residents of De Trisken rondom are educated to an intermediate level. 50,8% have an intermediate education (HAVO, VWO or MBO 2-4), 26,9% have a lower education (VMBO or MBO 1) and 22,3% have a university or higher professional education (HBO/WO).
Of the 2.500 residents, around 71% are in paid employment, which amounts to 1.775 people. This is 1% lower than the national average of 72%. The majority of workers are in salaried employment (89%), while 11% are self-employed. In De Trisken rondom, 24% of residents receive a benefit. The largest group is those receiving a state pension (AOW). 400 people receive this benefit.
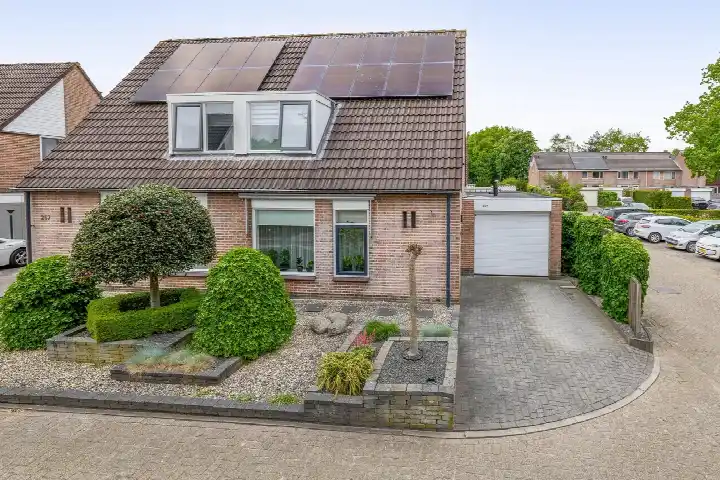
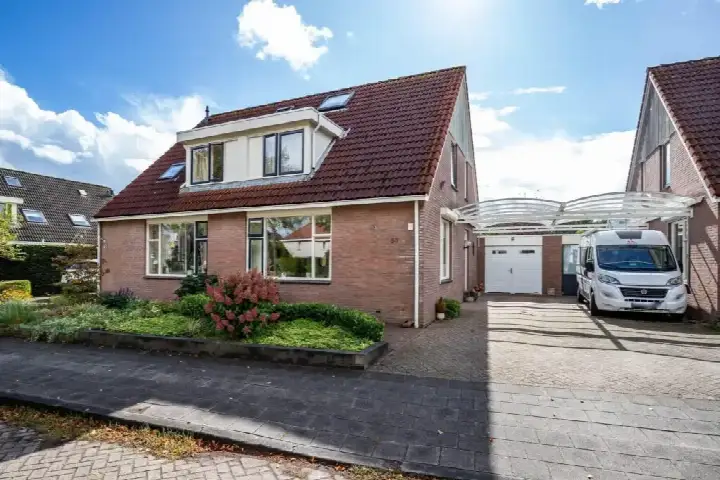
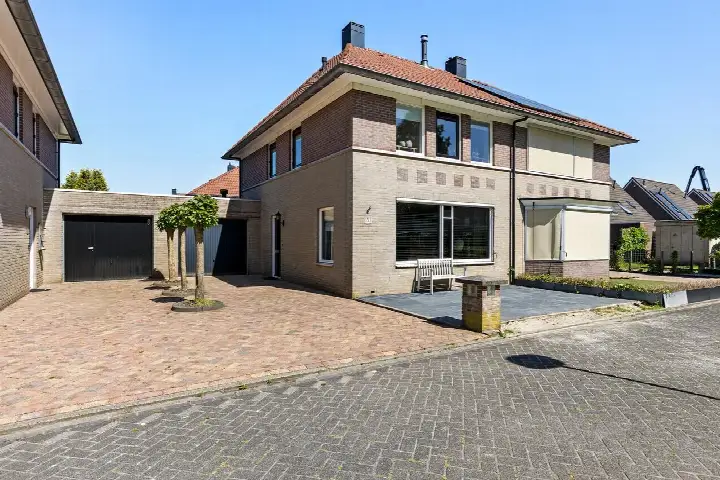
In De Trisken rondom there are 1.102 homes with an average assessed value (WOZ) of €242.000. Of these, around 97% are occupied and 3% unoccupied. Most homes are owner-occupied. This amounts to 27% rental homes and 73% owner-occupied homes. Of the homes, 73% privately owned, 17% owned by housing associations and 10% owned by other landlords. The most common construction periods in De Trisken rondom are 1980-1990 (82%) and 1990-2000 (17%).
There are currently 12 homes for sale in De Trisken rondom. The most recently listed home is Stal 235 by Makelaardij Friesland | Qualis op Funda. Over the past year, 70 homes were sold in De Trisken rondom. On average, a home was sold within 36 days.
The average asking price for a home for sale in De Trisken rondom over the past year was €314.425. This is 30% higher than the average assessed value (WOZ) of €242.000. The average asking price per m² of plot is €2.758.
There are currently no homes for rent in De Trisken rondom. The most recent home is Voergang 134, offered by www.frieslandhuurt.nl. Over the past year, 8 homes were let in De Trisken rondom. On average, a listing was let within 26 days.
No recent rental data available for De Trisken rondom.
In De Trisken rondom there are 644 addresses with a registered energy label. The most common labels are C (48%), B (32%) and A (16%). On average, an address in De Trisken rondom uses 2.320 kWh of electricity per year. This is 9% below the national average of 2.550 kWh. Natural gas consumption, at 880 m³ per year, is 10% above the national average of 800 m³.
On the side facing Himsterhout lies a quiet, safe and green neighbourhood in the Trisken. The streets are peaceful and surrounded by trees and green strips. It feels like a place where you can live with peace of mind, where children can play safely outside and nature is always close by. The combination of safety, tranquillity and greenery makes it a real recommendation to live. It is a pleasant neighbourhood to stay in, with plenty of space to relax and enjoy a quiet living environment. Moreover, all amenities are within walking or cycling distance.
Auto-translated to English by AIVery pleasant neighbourhood to live in. Amenities and nature are within walking distance.
Auto-translated to English by AIOccasional crazy situations but hardly ever anymore. A cosy neighbourhood with lots of nature in the area!
Auto-translated to English by AIUnsettling situations occur especially in the evenings. Lots of loud music, a lot of violence and mainly the people are not very friendly. There is also another side of the Trisken, (De Stal) where it is much quieter and safer.
Auto-translated to English by AIThe housing stock is mainly post-war — 91% was built between 1945 and 1990. In addition, the most common type is terraced houses (50%).
Over the past year a home for sale in De Trisken rondom was listed for an average of €314,282 (€2,568 per m²). That is 41% below the Dutch national average. Last quarter prices rose by 10%.
Residents give De Trisken rondom a 7.6 out of 10 based on 4 reviews. Especially nature and greenery (9.3) scores well; accessibility (6.0) receives the lowest rating.
The housing supply in De Trisken rondom is remarkably efficient: 53% has an A, A+ or B label. The average natural gas consumption per household is 880 m³ per year.
From De Trisken rondom you can on average reach a supermarket at 2.2 km, a GP at 1.0 km, a railway station at 19.7 km, a primary school at 0.5 km (as the crow flies, source: CBS).
Right now you will find 14 homes for sale in De Trisken rondom.