Neighbourhood in Leiden
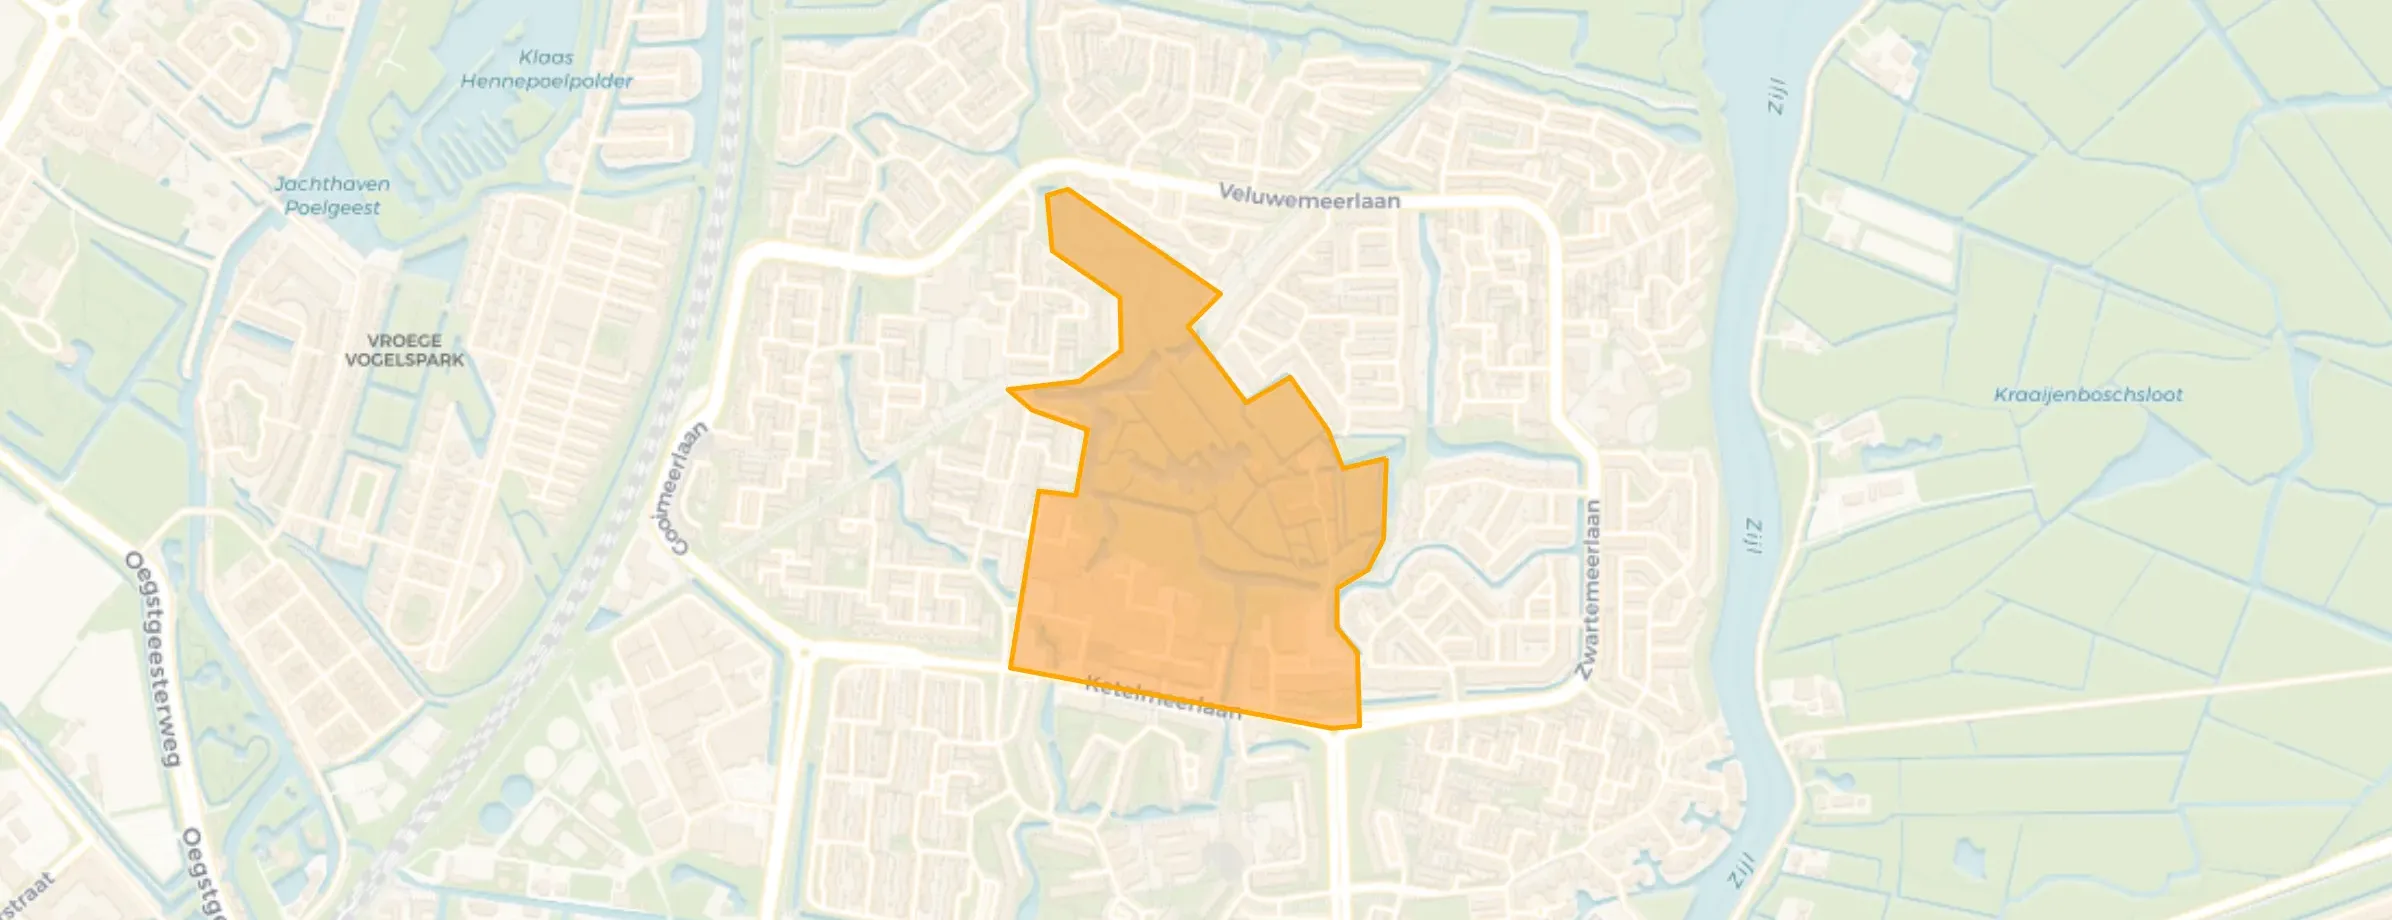
Merenwijk-Centrum is located in the province of Zuid-Holland, in the municipality of Leiden, in the district Merenwijkdistrict The neighbourhood has a total area of 21 hectares, of which 19 hectares are land and 2 hectares are water. The neighbourhood is coded as BU05460803. The postcode area is 2317NV-2317SZ.
Merenwijk-Centrum has 1.055 residents. Of these, 46,9% are men and 53,1% are women. Most residents are 65 years or older (39,8%). The other age groups are 29,9% for '25 to 45 years', 20,4% for '45 to 65 years', 5,2% for '15 to 25 years' and 4,7% for '0 to 15 years'. Of the residents, 46,4% is unmarried, 22,7% is married, 20,9% is divorced and 10,4% is widowed. 685 residents originate from the Netherlands, 150 come from Europe and 225 come from countries outside Europe.
There are 775 households in Merenwijk-Centrum. 71,0% of these are single-person households, 21,9% households without children and 7,1% households with children. The average household size is 1,4 persons. The national average is 2,1 persons.
In Merenwijk-Centrum there are 1.000 income recipients. The average income per income recipient is €35.800, which is €6.400 (15%) lower than the national average of €42.200. Per resident, the average income is €33.800, which is €1.100 (3%) lower than the national average of €34.900. Most residents of Merenwijk-Centrum are highly educated. 53,8% have a university or higher professional education (HBO/WO), 24,4% have an intermediate education (HAVO, VWO or MBO 2-4) and 21,8% have a lower education (VMBO or MBO 1).
Of the 1.055 residents, around 64% are in paid employment, which amounts to 675 people. This is 8% lower than the national average of 72%. The majority of workers are in salaried employment (90%), while 10% are self-employed. In Merenwijk-Centrum, 43% of residents receive a benefit. The largest group is those receiving a state pension (AOW). 370 people receive this benefit.
In Merenwijk-Centrum there are 787 homes with an average assessed value (WOZ) of €264.000. Of these, around 96% are occupied and 4% unoccupied. Most homes are rental properties. This amounts to 69% rental homes and 31% owner-occupied homes. Of the homes, 31% privately owned, 34% owned by housing associations and 35% owned by other landlords. The most common construction periods in Merenwijk-Centrum are 1970-1980 (88%) and 1990-2000 (11%).
There are currently 9 homes for sale in Merenwijk-Centrum. The most recently listed home is Stadzicht 9 by De Wekker Makelaardij op Funda. Over the past year, 41 homes were sold in Merenwijk-Centrum. On average, a home was sold within 42 days.
The average asking price for a home for sale in Merenwijk-Centrum over the past year was €313.927. This is 19% higher than the average assessed value (WOZ) of €264.000. The average asking price per m² of plot is €4.422.
There are 4 homes for rent in Merenwijk-Centrum. The most recent home is Poldermolen 103, offered by www.hureninhollandrijnland.nl. Over the past year, 25 homes were let in Merenwijk-Centrum. On average, a listing was let within 46 days.
The average rent for a rental home in Merenwijk-Centrum over the past year was €1.462 per month. Per m² of plot area that is €17 per month.
In Merenwijk-Centrum there are 719 addresses with a registered energy label. The most common labels are C (42%), A (23%) and B (20%). On average, an address in Merenwijk-Centrum uses 1.820 kWh of electricity per year. This is 29% below the national average of 2.550 kWh. With an annual consumption of 170 m³ per address, natural gas consumption is 79% below the national average of 800 m³.


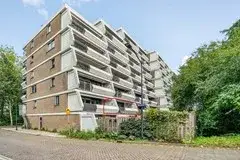
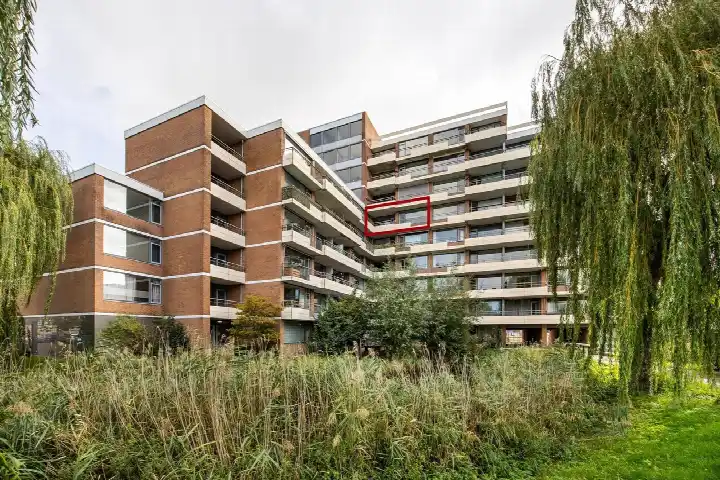
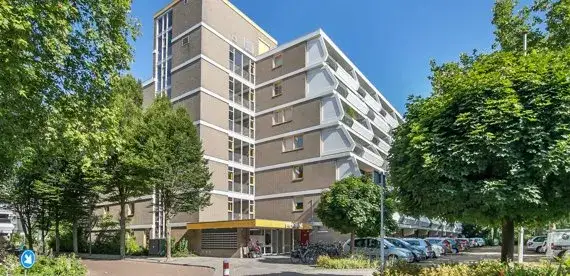
The housing stock is mainly post-war — 87% was built between 1945 and 1990. In addition, the most common type is flats (98%).
Over the past year a home for sale in Merenwijk-Centrum was listed for an average of €315,289 (€4,840 per m²). That is 40% below the Dutch national average.
A rental home in Merenwijk-Centrum cost an average of €1,290 per month (€18 per m²). That is 40% below the national average.
Buurt Merenwijk-Centrum has 1,055 residents. The largest age group is 65+ years (40%). Notably, 71% of the households are single-person households.
From Merenwijk-Centrum you can on average reach a supermarket at 0.2 km, a GP at 0.4 km, a railway station at 3.3 km, a primary school at 0.6 km (as the crow flies, source: CBS).
Right now you will find 9 homes for sale and 6 homes for rent in Merenwijk-Centrum.