Give feedback Report a problem
Neighbourhood in NederweertNederweert
Limburg›Nederweert›Nederweert›Nederweert

Neighbourhood Nederweert

Municipality of Nederweert

9.0
Residents give Nederweert a very good ratingThis score is based on 1 response
View
Nederweert has 7,440 residentsMost are 65 years or older old
There are 3,498 homes in NederweertCurrently there are 16 for sale and 4 for rent
Energy label A is the most common in NederweertBased on registered homes

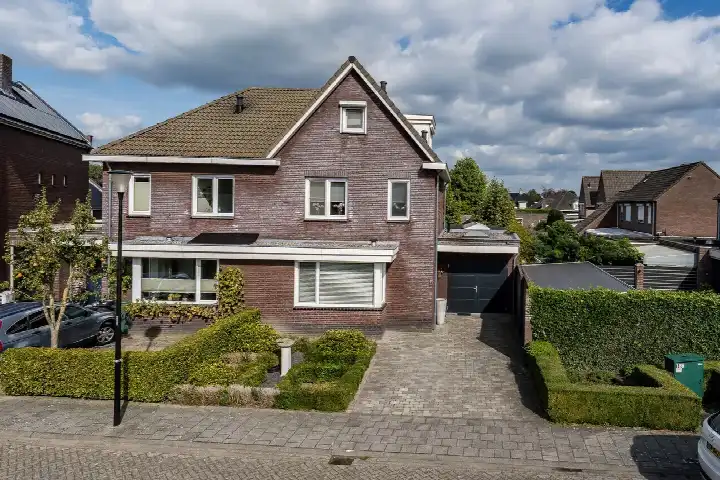
Nederweert is located in the province of Limburg, in the municipality of Nederweert, in the district Nederweert. The neighbourhood has a total area of 347 hectares, of which 332 hectares are land and 15 hectares are water. The neighbourhood is coded as BU09460101. The postcode area is 6031BK-6031XZ.

One resident rates the neighbourhood as excellent with a score of 9.0. The resident describes this neighbourhood as 'Cosy'. Based on a limited number of reviews, no clear trends are visible yet in this neighbourhood.

Residents

Nederweert has 7.440 residents. Of these, 48,9% are men and 51,1% are women. Most residents are 65 years or older (29,9%). The other age groups are 27,0% for '45 to 65 years', 20,8% for '25 to 45 years', 13,0% for '0 to 15 years' and 9,2% for '15 to 25 years'. Of the residents, 40,9% is unmarried, 44,1% is married, 7,1% is divorced and 8,1% is widowed. 6.415 residents originate from the Netherlands, 500 come from Europe and 525 come from countries outside Europe.

There are 3.460 households in Nederweert. 36,4% of these are single-person households, 35,3% households without children and 28,3% households with children. The average household size is 2,1 persons. The national average is 2,1 persons.

In Nederweert there are 6.200 income recipients. The average income per income recipient is €38.100, which is €4.100 (10%) lower than the national average of €42.200. Per resident, the average income is €32.800, which is €2.100 (6%) lower than the national average of €34.900. Most residents of Nederweert are educated to an intermediate level. 42,1% have an intermediate education (HAVO, VWO or MBO 2-4), 31,0% have a lower education (VMBO or MBO 1) and 26,9% have a university or higher professional education (HBO/WO).

Of the 7.440 residents, around 72% are in paid employment, which amounts to 5.357 people. This is 0% lower than the national average of 72%. The majority of workers are in salaried employment (87%), while 13% are self-employed. In Nederweert, 35% of residents receive a benefit. The largest group is those receiving a state pension (AOW). 2.030 people receive this benefit.

Housing

In Nederweert there are 3.498 homes with an average assessed value (WOZ) of €366.000. Of these, around 97% are occupied and 3% unoccupied. Most homes are owner-occupied. This amounts to 40% rental homes and 60% owner-occupied homes. Of the homes, 59% privately owned, 30% owned by housing associations and 11% owned by other landlords. The most common construction periods in Nederweert are 1970-1980 (22%) and 1980-1990 (18%).

Homes for sale in Nederweert

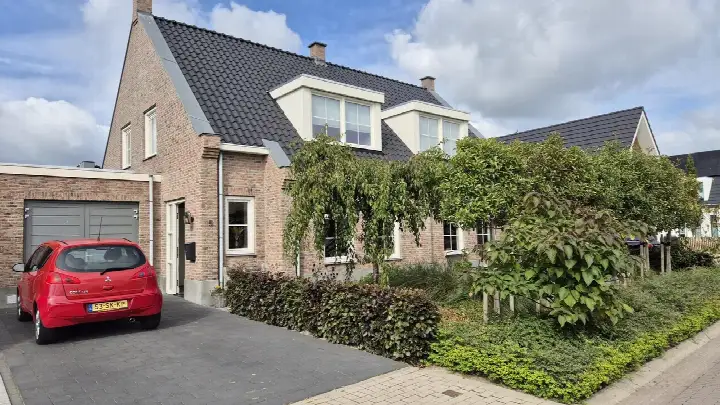
There are currently 16 homes for sale in Nederweert. The most recently listed home is tichelveld 25 by Koopklik. Over the past year, 71 homes were sold in Nederweert. On average, a home was sold within 39 days.

The average asking price for a home for sale in Nederweert over the past year was €502.570. This is 37% higher than the average assessed value (WOZ) of €366.000. The average asking price per m² of floor area is €3.190.

Rental homes in Nederweert

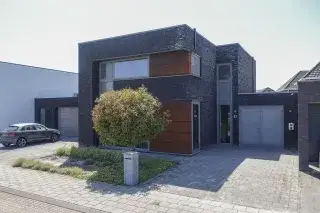
There are 4 homes for rent in Nederweert. The most recent home is Hoefsmid 5, offered by ViaDal Makelaardij, Financieel Advies & Verzekeren. Over the past year, 14 homes were let in Nederweert. On average, a listing was let within 74 days.

The average rent for a rental home in Nederweert over the past year was €1.620 per month. Per m² of floor area that is €9 per month.

Energy

In Nederweert there are 2.426 addresses with a registered energy label. The most common labels are A (35%), B (28%) and C (18%). On average, an address in Nederweert uses 2.790 kWh of electricity per year. This is 9% above the national average of 2.550 kWh. Natural gas consumption, at 880 m³ per year, is 10% above the national average of 800 m³.

Street names

  • Berkenstraat
  • Juffrouw Joostenhof
  • Heuvel
  • Randweg Zuid
  • Ast
  • Tichelveld
  • Meester Mertensstraat
  • Hovensteeg
  • Lindanusstraat
  • Plataanstraat
  • Akkerzicht
  • Raadhuisplein
  • Kerneel
  • Hoefsmid
  • Rosvelterweg
  • Molenweg
  • Lambertushof
  • Henry Hardenstraat
  • Nikkelstraat
  • Montgomerystraat
  • Imkerveld
  • Geenestraat
  • Pannenweg
  • Azaleastraat
  • Kapelaniestraat
  • Dokter Schmidtstraat
  • Vlierstraat
  • Burgemeester Spiertzplein
  • Kloostertuin
  • Kastanjestraat
  • Esdoornstraat
  • Molenberg
  • Rijksweg Zuid
  • Houtmolen
  • Nooitgedacht
  • Bezembinder
  • Monseigneur Kreijelmansstraat
  • Laurierstraat
  • Poppelkuil
  • Aluminiumstraat
  • Stepke
  • Boeket
  • Braosheuf
  • Muisven
  • Sluiswachter
  • Koperslager
  • Ouwijck
  • Rietdekker
  • Florastraat
  • Berberisstraat
  • Strateris
  • De Bengele
  • Populierenstraat
  • Burgemeester van Udenstraat
  • Sint Willibrordusstraat
  • Rijksweg Noord
  • Sint Josephstraat
  • Platinastraat
  • Franciscanessenstraat
  • Scheper
  • Hoge Notte
  • Burgemeester Greijmansstraat
  • Wilgenstraat
  • Wiel Gubbelsstraat
  • Aan Vijftien
  • Acaciastraat
  • Burgemeester Hobusstraat
  • Rooseveltstraat
  • Suffolkstraat
  • Brugstraat
  • Bronsstraat
  • Speelhuijs
  • Rosvelterzijweg
  • Blekerveld
  • Titaniumstraat
  • Bredeweg
  • Hogeweg
  • Goudenregenstraat
  • Schoolstraat
  • Lindenstraat
  • Magnesiumstraat
  • Staat
  • Beukenstraat
  • Dokter Jansenstraat
  • Vuurdoornstraat
  • Beuldersweg
  • Leerlooier
  • Hinkert
  • Dokter van de Wouwstraat
  • Thieu Gielenstraat
  • Pastorieweg
  • Beurseland
  • Ribesstraat
  • Harrie Carisstraat
  • Theo Siebenstraat
  • Burgemeester Vullersstraat
  • Hazelaarstraat
  • Pastoor van der Steenstraat
  • Achtkant
  • Kerkstraat
  • Mangaanstraat
  • Taxusstraat
  • Schummel
  • Palmstraat
  • Moesemanstraat
  • Sjeng Vaasstraat
  • Agneshof
  • Hageldor
  • Tinnegieter
  • Brugske
  • Hoebensstraat
  • Hortensiastraat
  • Toren
  • Randweg West
  • Hooghuijs
  • Loverstraat
  • Meidoornstraat
  • Eikenstraat
  • Geer
  • Mandenmaker
  • Pierre Niesstraat
  • Sjeeshuijs
  • Sint Lambertusstraat
  • Sint Antoniusplein
  • Churchillstraat
  • Seringstraat
  • Bosserstraat
  • Scheijvenwerf
  • Magnoliastraat
  • Jasmijnstraat
  • Paulus Holtenstraat
  • Staterweg
  • Eisenhowerstraat
  • Kamperfoeliestraat
  • Sint Luciastraat
  • Bremstraat

Amenities

GP
0,6 km
Pharmacy
0,8 km
Hospital
5,6 km
Supermarket
0,8 km
Railway station
6,3 km
Day nursery
0,6 km
Primary school
0,6 km
Secondary school
0,9 km
Rate Nederweert

Share your opinion and help improve the neighbourhood.

  • Takes less than 2 minutes
  • Help home seekers
  • Improve your neighbourhood
Write a review
9.0
Residents give Nederweert an excellent rating
This score is based on 1 response
Join the conversation
Safety
Housing
Cleanliness
Amenities
Education
Community
Greenery
Accessibility

Experiences of Nederweert

Join the conversation
9.0
Quirijn segers
Family · Overig
21-01-2025
Cosy

It's a very cosy neighbourhood, everyone knows each other here. When it's New Year's, we all wish each other a happy New Year.

Auto-translated to English by AI

Statistics about the residents

Ages

Residents per age category

Household composition

Households per category
1,260Single-person households
1,220Households without children
980Households with children

Gender

Residents by gender
Men
Women

Marital status

Residents by marital status
Married
Unmarried
Divorced
Widowed

Origin

Residents per category of origin
Netherlands
Europe
Outside Europe

Work & income

Labour participation and average income
€32,800 P.A.average per resident6% below the national average
€38,100 P.A.average per income recipient10% below the national average
87%of the employed are in paid employment
13%of the employed are self-employed
72%
of the residents are employed
72%
is the national average

Education level

Residents per education level
VMBO, MBO 1
HAVO/VWO, MBO 2-4
HBO/WO

Wealth

Median wealth per household
Nederweert
Netherlands

Benefits

Residents per benefit type
Social assistance
Disability
Unemployment

Housing market in Nederweert

Sale price · Q4 2026
€511.529
average▲ 6,0%
€539.000
median▲ 22,8%
17 sales · vs. Q3 2026
€/m² for sale · Q4 2026
€3.354
average▲ 5,0%
€3.182
median▲ 5,7%
-3% vs. national average

Sales market

Market speed and dynamics, last 12 months
39 days ▼ 55,2%
average time listed · vs. last year
71
sales in the past year
163 m²
average living area
-3%
cheaper than the national average

Rental market

Market speed and dynamics, last 12 months
74 days
average time listed · vs. last year
14
lettings in the past year
203 m²
average living area
-13%
cheaper than the national average

Year built

Age of the housing stock

Energy labels

Sustainability of the housing stock

Living area

Distribution of home sizes

Statistics about the homes

Home types

Addresses per home type

Construction periods

Addresses per construction period

Labels

Addresses per energy label

Energy consumption

Average per address, compared with the Netherlands
Natural gas (m³)
Nederweert
880
Netherlands
800
Electricity (kWh)
Nederweert
2.790
Netherlands
2.550

Frequently asked questions about Nederweert

What is the average asking price in Nederweert?

Over the past year a home for sale in Nederweert was listed for an average of €502,570 (€3,190 per m²). Last quarter prices rose by 6%.

How much does renting cost in Nederweert?

A rental home in Nederweert cost an average of €1,620 per month (€9 per m²). That is 13% below the national average.

How is the population of Nederweert composed?

Buurt Nederweert has 7,440 residents. The largest age group is 65+ years (30%).

What are the energy labels in Nederweert?

The housing supply in Nederweert is remarkably efficient: 63% has an A, A+ or B label. The average natural gas consumption per household is 880 m³ per year.

How far are amenities from Nederweert?

From Nederweert you can on average reach a supermarket at 0.8 km, a GP at 0.6 km, a railway station at 6.3 km, a primary school at 0.6 km (as the crow flies, source: CBS).

How many homes are currently for sale in Nederweert?

Right now you will find 16 homes for sale and 4 homes for rent in Nederweert.

Homes Rate your neighbourhood
Buurtje.nl
Buurtje.nl in the appSearch faster and respond first
Open