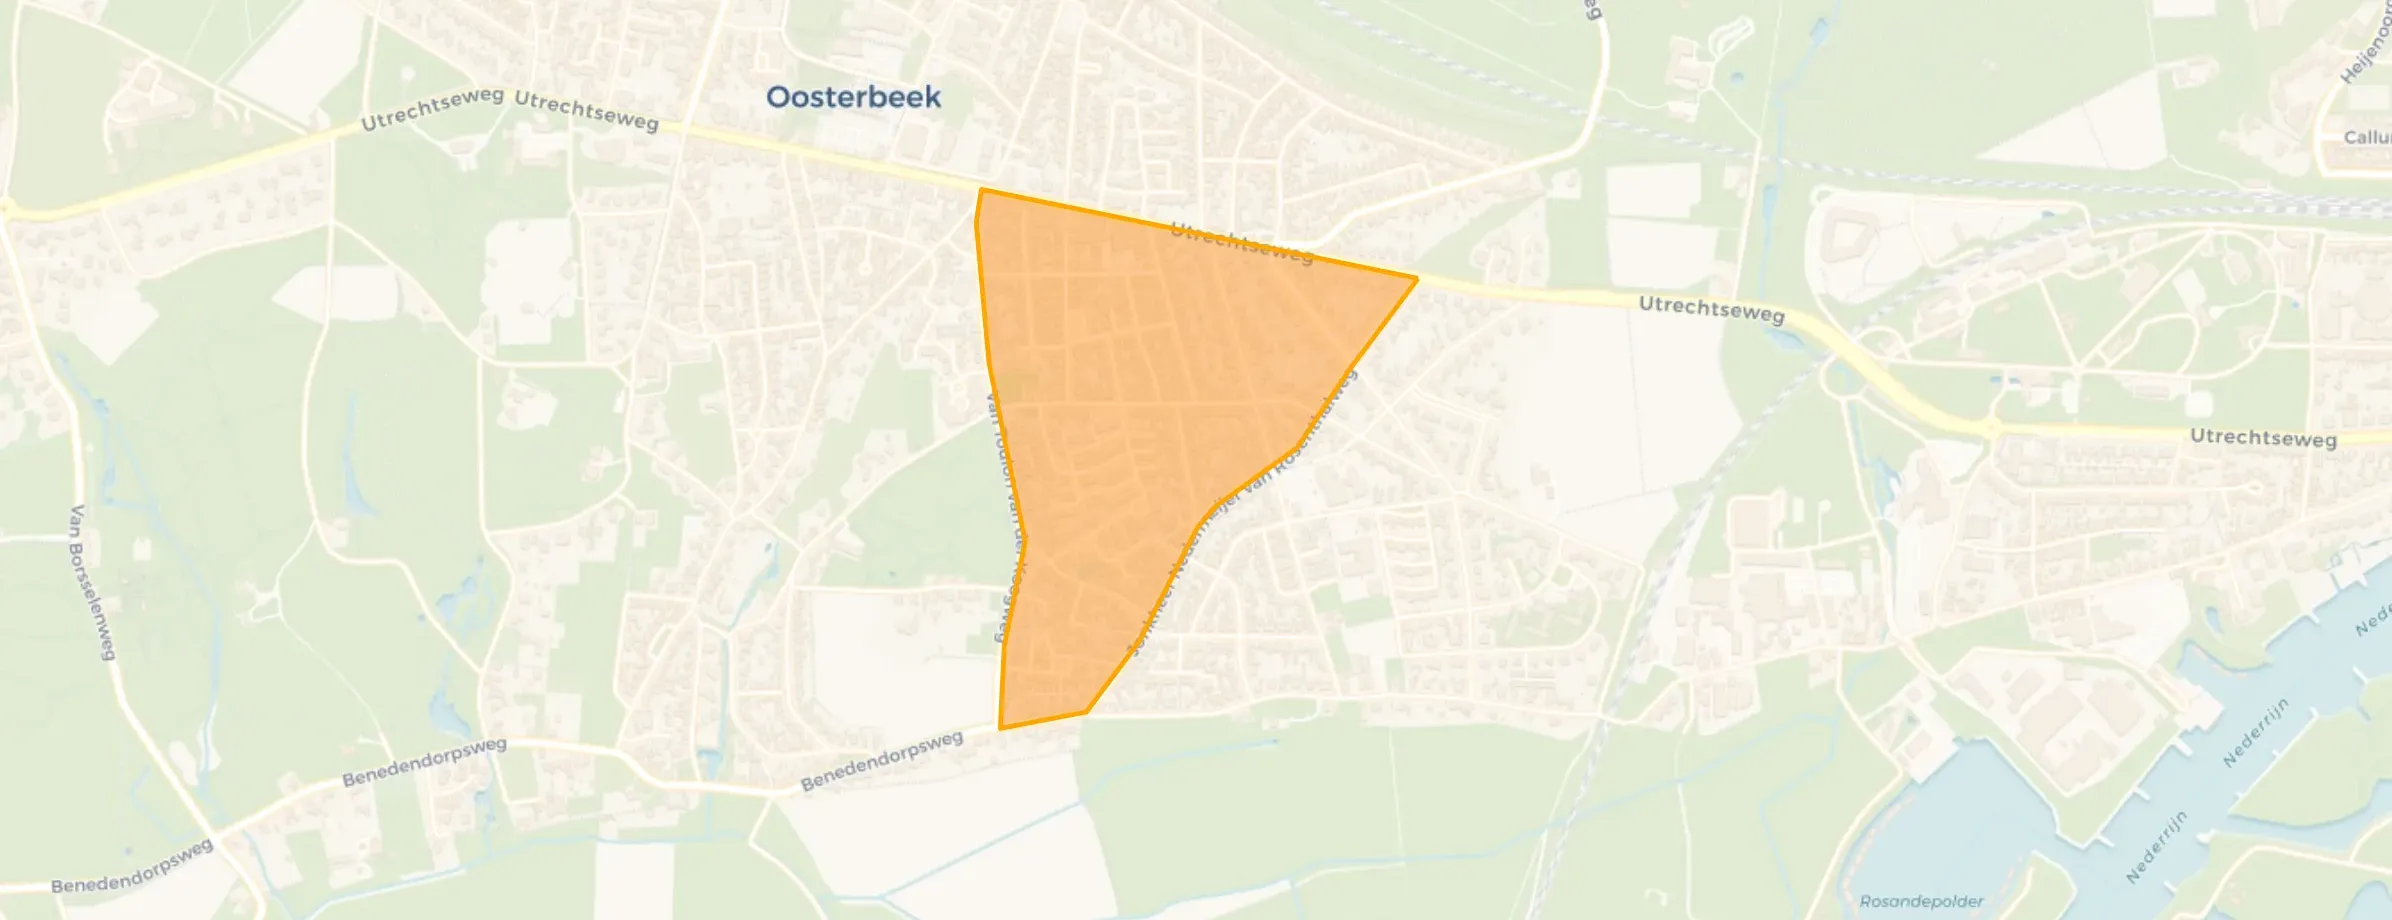
Neighbourhood in Renkum
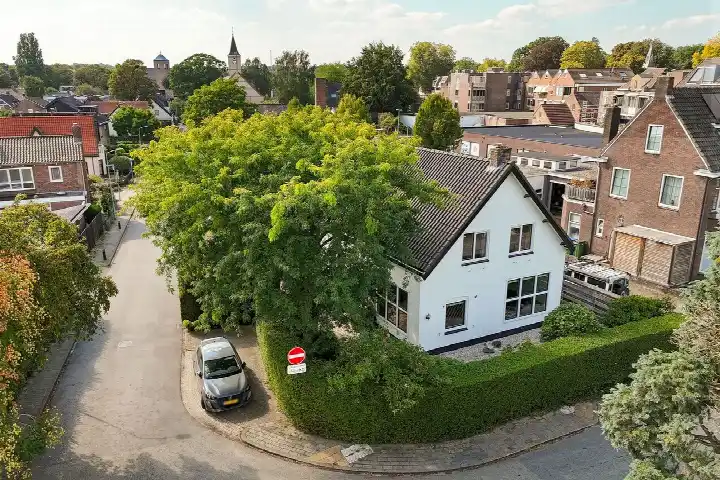
Nieuwland is located in the province of Gelderland, in the municipality of Renkum, in the district Oosterbeek Zuidoost The neighbourhood has a total area of 34 hectares, of which 34 hectares are land and 0 hectares are water. The neighbourhood is coded as BU02741103. The postcode area is 6862AM-6862ZT.
Two residents rate the neighbourhood as more than satisfactory with a score of 6.8. They describe it as 'A sense of community' and 'Cosy'. Based on a limited number of reviews, no clear trends are visible yet in this neighbourhood.
Nieuwland has 1.800 residents. Of these, 48,6% are men and 51,4% are women. Most residents are 45 to 65 years (31,7%). The other age groups are 24,4% for '65 years or older', 18,3% for '25 to 45 years', 15,6% for '0 to 15 years' and 10,6% for '15 to 25 years'. Of the residents, 46,4% is unmarried, 38,9% is married, 10,6% is divorced and 4,4% is widowed. 1.425 residents originate from the Netherlands, 135 come from Europe and 240 come from countries outside Europe.
There are 845 households in Nieuwland. 36,7% of these are single-person households, 31,4% households without children and 32,0% households with children. The average household size is 2,1 persons. The national average is 2,1 persons.
In Nieuwland there are 1.500 income recipients. The average income per income recipient is €46.700, which is €4.500 (11%) higher than the national average of €42.200. Per resident, the average income is €38.100, which is €3.200 (9%) higher than the national average of €34.900. Most residents of Nieuwland are highly educated. 45,1% have a university or higher professional education (HBO/WO), 27,8% have a lower education (VMBO or MBO 1) and 27,1% have an intermediate education (HAVO, VWO or MBO 2-4).
Of the 1.800 residents, around 71% are in paid employment, which amounts to 1.278 people. This is 1% lower than the national average of 72%. The majority of workers are in salaried employment (75%), while 25% are self-employed. In Nieuwland, 29% of residents receive a benefit. The largest group is those receiving a state pension (AOW). 390 people receive this benefit.
In Nieuwland there are 875 homes with an average assessed value (WOZ) of €491.000. Of these, around 94% are occupied and 6% unoccupied. Most homes are owner-occupied. This amounts to 27% rental homes and 73% owner-occupied homes. Of the homes, 73% privately owned, 16% owned by housing associations and 11% owned by other landlords. The most common construction periods in Nieuwland are 1970-1980 (27%) and 1900-1925 (20%).
There are currently 6 homes for sale in Nieuwland. The most recently listed home is Nieuwland 2 by Van Gelre Makelaardij B.V.. Over the past year, 62 homes were sold in Nieuwland. On average, a home was sold within 74 days.
The average asking price for a home for sale in Nieuwland over the past year was €648.935. This is 32% higher than the average assessed value (WOZ) of €491.000. The average asking price per m² of plot is €4.160.
There is 1 homes for rent in Nieuwland. The most recent home is Utrechtseweg 98J, offered by Kronenburg Living op Vastgoed Nederland. Over the past year, 6 homes were let in Nieuwland. On average, a listing was let within 68 days.
The average rent for a rental home in Nieuwland over the past year was €1.361 per month. Per m² of plot area that is €24 per month.
In Nieuwland there are 546 addresses with a registered energy label. The most common labels are A (31%), C (22%) and D (10%). On average, an address in Nieuwland uses 2.780 kWh of electricity per year. This is 9% above the national average of 2.550 kWh. Natural gas consumption, at 1.080 m³ per year, is 35% above the national average of 800 m³.
Nieuwland in Oosterbeek feels like a quiet and pleasant neighbourhood where you can truly unwind. The area is green and well-maintained, creating a nice atmosphere for walks or bike rides. What strikes me most is the sense of safety and the friendly residents; everyone greets each other, and there is a relaxed vibe. Shops and amenities are nearby, making life here practical without the hustle and bustle. For families and people who love nature and tranquillity, Nieuwland is highly recommended. In the neighbourhood there is Bato’swijk park, which was very green and nice a few years ago. However, the pond is half empty and it is becoming less attractive. I grew up in this area and couldn't have wished for a better place!
Auto-translated to English by AINo nuisance and tidy
Auto-translated to English by AIOver the past year a home for sale in Nieuwland was listed for an average of €669,898 (€4,597 per m²). That is 27% above the Dutch national average.
Buurt Nieuwland has 1,800 residents. The largest age group is 45 to 65 years (32%).
A considerable share of the supply in Nieuwland is less efficient: 25% has an E, F or G label. The average natural gas consumption per household is 1,080 m³ per year.
From Nieuwland you can on average reach a supermarket at 0.5 km, a GP at 1.1 km, a railway station at 1.8 km, a primary school at 0.6 km (as the crow flies, source: CBS).