Neighbourhood in Utrecht
Parkwijk-Zuid is located in the province of Utrecht, in the municipality of Utrecht, in the district Leidsche Rijn The neighbourhood has a total area of 42 hectares, of which 40 hectares are land and 2 hectares are water. The neighbourhood is coded as BU03440942. The postcode area is 3544AB-3544ED.
Four residents rate the neighbourhood as good with a score of 7.6. They describe it as 'Alle voorzieningen dichtbij', 'Fijne rustige buurt met veel groen met winkels, scholen en overige voorzieningen op korte afstand' and 'Nice little park, messy little neighbourhood'. Aspects such as safety, accessibility, greenery are rated well in this neighbourhood, while cleanliness and community score less well.
Parkwijk-Zuid has 3.765 residents. Of these, 48,1% are men and 51,8% are women. Most residents are 25 to 45 years (30,5%). The other age groups are 29,0% for '45 to 65 years', 15,9% for '0 to 15 years', 13,7% for '15 to 25 years' and 10,9% for '65 years or older'. Of the residents, 54,4% is unmarried, 35,7% is married, 7,2% is divorced and 2,5% is widowed. 1.615 residents originate from the Netherlands, 290 come from Europe and 1.855 come from countries outside Europe.
There are 1.615 households in Parkwijk-Zuid. 35,3% of these are single-person households, 24,5% households without children and 40,2% households with children. The average household size is 2,3 persons. The national average is 2,1 persons.
In Parkwijk-Zuid there are 3.000 income recipients. The average income per income recipient is €44.400, which is €2.200 (5%) higher than the national average of €42.200. Per resident, the average income is €35.800, which is €900 (3%) higher than the national average of €34.900. Most residents of Parkwijk-Zuid are highly educated. 48,5% have a university or higher professional education (HBO/WO), 29,9% have an intermediate education (HAVO, VWO or MBO 2-4) and 21,6% have a lower education (VMBO or MBO 1).
Of the 3.765 residents, around 73% are in paid employment, which amounts to 2.748 people. This is 1% higher than the national average of 72%. The majority of workers are in salaried employment (86%), while 14% are self-employed. In Parkwijk-Zuid, 21% of residents receive a benefit. The largest group is those receiving a state pension (AOW). 360 people receive this benefit.
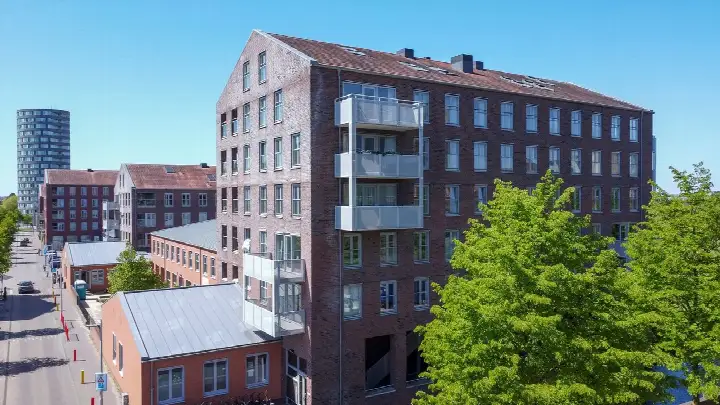
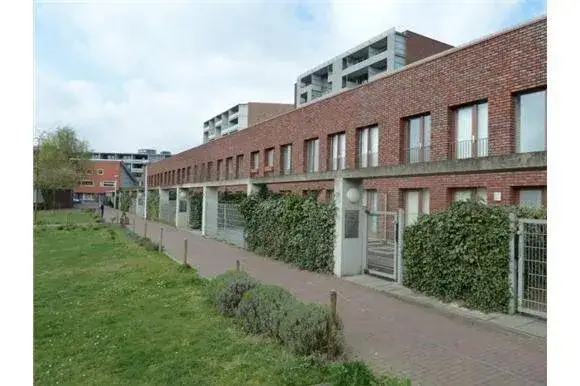
In Parkwijk-Zuid there are 1.534 homes with an average assessed value (WOZ) of €513.000. Of these, around 97% are occupied and 3% unoccupied. In Parkwijk-Zuid there are roughly as many rental as owner-occupied homes. This amounts to 48% rental homes and 52% owner-occupied homes. Of the homes, 51% privately owned, 35% owned by housing associations and 14% owned by other landlords. The most common construction periods in Parkwijk-Zuid are 2000-2010 (99%) and 1900-1925 (0%).
There are currently 13 homes for sale in Parkwijk-Zuid. The most recently listed home is Melissekade 205 by Welwonend Makelaardij. Over the past year, 50 homes were sold in Parkwijk-Zuid. On average, a home was sold within 39 days.
The average asking price for a home for sale in Parkwijk-Zuid over the past year was €543.900. This is 6% higher than the average assessed value (WOZ) of €513.000. The average asking price per m² of plot is €5.281.
There are 11 homes for rent in Parkwijk-Zuid. The most recent home is Melissekade 89, offered by ikwilhuren.nl. Over the past year, 41 homes were let in Parkwijk-Zuid. On average, a listing was let within 41 days.
The average rent for a rental home in Parkwijk-Zuid over the past year was €1.639 per month. Per m² of plot area that is €15 per month.
In Parkwijk-Zuid there are 688 addresses with a registered energy label. The most common labels are A (76%), A+ (12%) and B (9%). On average, an address in Parkwijk-Zuid uses 2.300 kWh of electricity per year. This is 10% below the national average of 2.550 kWh.
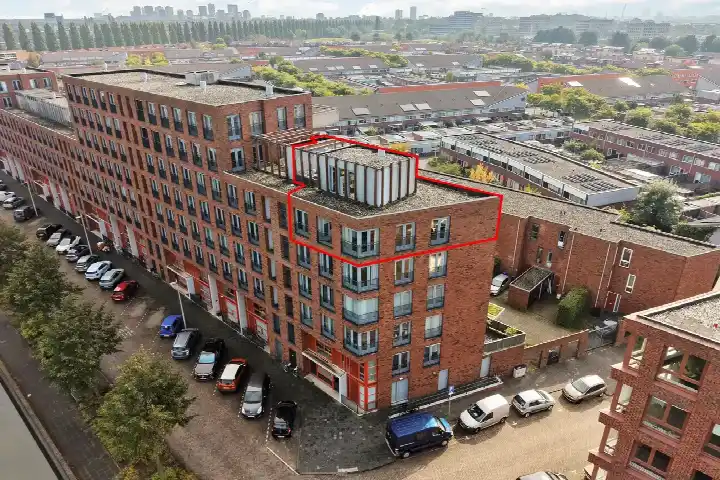
Leuke gemixte buurt waar mensen oog voor elkaar hebben en het rustig wonen is. Het grootste voordeel is dat alle voorzieningen dichtbij zijn zoals Leidsche Rijn centrum, winkelcentrum parkwijk, bushalte, treinstation, scholen, sportclubs, parken, bioscoop en horeca.
Auto-translated to English by AIHeerlijk rustige buurt op slechts 20 minuten afstand van het centrum van Utrecht. Park Hoge Weide, scholen, supermarkten en sportvoorzieningen zijn om de hoek.
Auto-translated to English by AIParkwijk zuid is a nice little post-war neighbourhood near everything in Utrecht. But there are a few downsides.
Auto-translated to English by AI-
Auto-translated to English by AIThe housing stock is relatively young — 100% dates from after 1990. In addition, the most common type is terraced houses (52%).
Over the past year a home for sale in Parkwijk-Zuid was listed for an average of €546,540 (€5,558 per m²).
A rental home in Parkwijk-Zuid cost an average of €1,658 per month (€14 per m²). That is 23% below the national average.
Residents give Parkwijk-Zuid a 7.6 out of 10 based on 4 reviews. Especially safety (8.3) scores well; community (6.5) receives the lowest rating.
Buurt Parkwijk-Zuid has 3,765 residents. The largest age group is 25 to 45 years (31%). Many families: 40% of the households have children.
The housing supply in Parkwijk-Zuid is remarkably efficient: 97% has an A, A+ or B label.
From Parkwijk-Zuid you can on average reach a supermarket at 0.6 km, a GP at 0.6 km, a railway station at 1.8 km, a primary school at 0.5 km (as the crow flies, source: CBS).
Right now you will find 16 homes for sale in Parkwijk-Zuid.