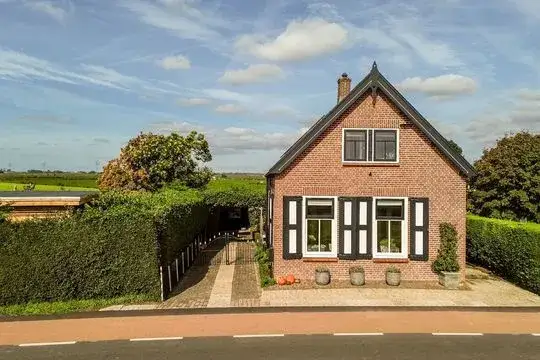
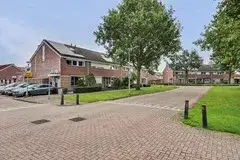
Neighbourhood in Hoeksche Waard
Strijen Woonkern is located in the province of Zuid-Holland, in the municipality of Hoeksche Waard, in the district Strijen The neighbourhood has a total area of 235 hectares, of which 230 hectares are land and 5 hectares are water. The neighbourhood is coded as BU19630700. The postcode area is 3291AA-3291XS.
Two residents rate the neighbourhood as more than satisfactory with a score of 6.9. They describe it as 'Slowly getting tidier' and 'In terms of peace and space: very nice'. Based on a limited number of reviews, no clear trends are visible yet in this neighbourhood.
Strijen Woonkern has 7.035 residents. Of these, 49,0% are men and 51,0% are women. Most residents are 45 to 65 years (29,8%). The other age groups are 25,0% for '65 years or older', 21,5% for '25 to 45 years', 13,7% for '0 to 15 years' and 10,0% for '15 to 25 years'. Of the residents, 40,4% is unmarried, 45,8% is married, 7,2% is divorced and 6,6% is widowed. 6.160 residents originate from the Netherlands, 285 come from Europe and 590 come from countries outside Europe.
There are 3.155 households in Strijen Woonkern. 31,9% of these are single-person households, 34,4% households without children and 33,8% households with children. The average household size is 2,2 persons. The national average is 2,1 persons.
In Strijen Woonkern there are 5.800 income recipients. The average income per income recipient is €41.300, which is €900 (2%) lower than the national average of €42.200. Per resident, the average income is €34.800, which is €100 (0%) lower than the national average of €34.900. Most residents of Strijen Woonkern are educated to an intermediate level. 46,6% have an intermediate education (HAVO, VWO or MBO 2-4), 27,0% have a university or higher professional education (HBO/WO) and 26,4% have a lower education (VMBO or MBO 1).
Of the 7.035 residents, around 74% are in paid employment, which amounts to 5.206 people. This is 2% higher than the national average of 72%. The majority of workers are in salaried employment (86%), while 14% are self-employed. In Strijen Woonkern, 29% of residents receive a benefit. The largest group is those receiving a state pension (AOW). 1.620 people receive this benefit.
In Strijen Woonkern there are 3.313 homes with an average assessed value (WOZ) of €352.000. Of these, around 95% are occupied and 5% unoccupied. Most homes are owner-occupied. This amounts to 32% rental homes and 68% owner-occupied homes. Of the homes, 68% privately owned, 29% owned by housing associations and 3% owned by other landlords. The most common construction periods in Strijen Woonkern are 1970-1980 (26%) and 1990-2000 (18%).
There are currently 24 homes for sale in Strijen Woonkern. The most recently listed home is Kerkstraat 40A by Makelaardij De Jong B.V.. Over the past year, 166 homes were sold in Strijen Woonkern. On average, a home was sold within 69 days.
The average asking price for a home for sale in Strijen Woonkern over the past year was €525.768. This is 49% higher than the average assessed value (WOZ) of €352.000. The average asking price per m² of plot is €3.266.
There are currently no homes for rent in Strijen Woonkern. The most recent home is Uiterdijk 42, offered by Makelaardij de Jong op Pararius. Over the past year, 31 homes were let in Strijen Woonkern. On average, a listing was let within 43 days.
No recent rental data available for Strijen Woonkern.
In Strijen Woonkern there are 2.145 addresses with a registered energy label. The most common labels are A (30%), C (24%) and B (17%). On average, an address in Strijen Woonkern uses 2.680 kWh of electricity per year. This is 5% above the national average of 2.550 kWh. Natural gas consumption, at 820 m³ per year, is 3% above the national average of 800 m³.
Overall, it's a quiet neighbourhood. There is a dangerous road nearby where many cars drive too fast and accidents often happen. The houses are now divided between owner-occupied and rental. But all rental houses that become vacant are sold. As a result, you can see the neighbourhood gradually improving because people with owner-occupied homes put more time and energy into it. A fine neighbourhood for a family with children. Downside: the green bags are often torn open, causing a lot of litter to scatter around and not being collected by the council. Hygiene could be better. There should be bins everywhere so that bags of rubbish don't end up on the street.
Auto-translated to English by AIVery self-contained, all of it. Almost shy... but when there's something to complain about, we stand our ground. Closed culture. But... what goes around comes around! Your own attitude is very important! Invest and try to break through that Strijense bubble...!
Auto-translated to English by AIOver the past year a home for sale in Strijen Woonkern was listed for an average of €522,091 (€4,078 per m²). Last quarter prices fell by 9%.
A rental home in Strijen Woonkern cost an average of €1,648 per month (€18 per m²). That is 24% below the national average.
Buurt Strijen Woonkern has 7,035 residents. The largest age group is 45 to 65 years (30%).
The housing supply in Strijen Woonkern is remarkably efficient: 51% has an A, A+ or B label. The average natural gas consumption per household is 820 m³ per year.
From Strijen Woonkern you can on average reach a supermarket at 0.8 km, a GP at 0.7 km, a railway station at 14.5 km, a primary school at 0.7 km (as the crow flies, source: CBS).
Right now you will find 27 homes for sale in Strijen Woonkern.