Neighbourhood in Amsterdam
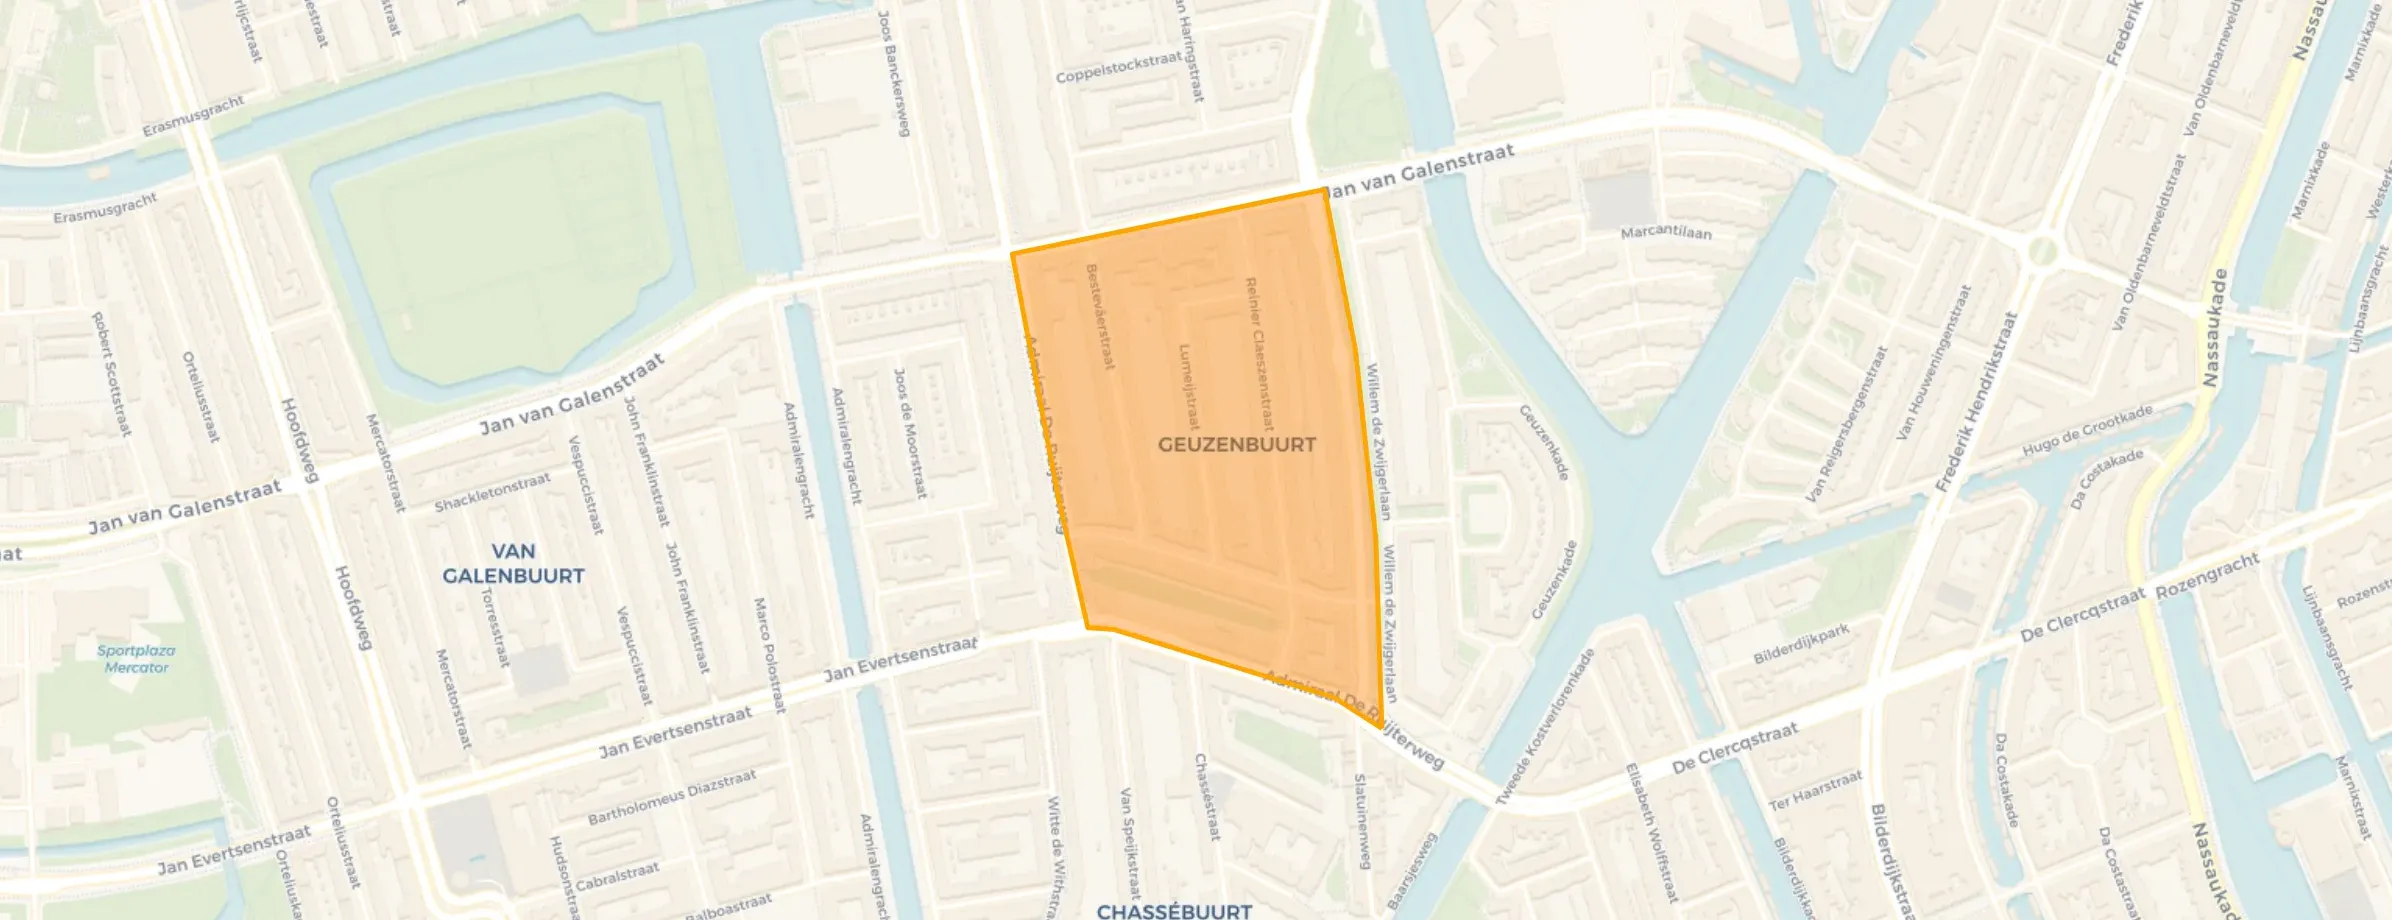
Trompbuurt is located in the province of Noord-Holland, in the municipality of Amsterdam, in the district Geuzenbuurt The neighbourhood has a total area of 12 hectares, of which 12 hectares are land and 0 hectares are water. The neighbourhood is coded as BU0363EL02. The postcode area is 1056BH-1056WT.
Two residents rate the neighbourhood as good with a score of 7.7. They describe it as 'Pleasant atmosphere but not much neighbourhood feeling' and 'Cosy neighbourhood'. Based on a limited number of reviews, no clear trends are visible yet in this neighbourhood.
Trompbuurt has 3.035 residents. Of these, 47,0% are men and 53,0% are women. Most residents are 25 to 45 years (47,6%). The other age groups are 19,3% for '45 to 65 years', 11,9% for '15 to 25 years', 11,7% for '0 to 15 years' and 9,6% for '65 years or older'. Of the residents, 72,0% is unmarried, 20,6% is married, 5,9% is divorced and 1,6% is widowed. 1.575 residents originate from the Netherlands, 600 come from Europe and 865 come from countries outside Europe.
There are 1.705 households in Trompbuurt. 50,4% of these are single-person households, 30,2% households without children and 19,4% households with children. The average household size is 1,8 persons. The national average is 2,1 persons.
In Trompbuurt there are 2.600 income recipients. The average income per income recipient is €53.900, which is €11.700 (28%) higher than the national average of €42.200. Per resident, the average income is €45.700, which is €10.800 (31%) higher than the national average of €34.900. Most residents of Trompbuurt are highly educated. 65,0% have a university or higher professional education (HBO/WO), 24,5% have an intermediate education (HAVO, VWO or MBO 2-4) and 10,5% have a lower education (VMBO or MBO 1).
Of the 3.035 residents, around 80% are in paid employment, which amounts to 2.428 people. This is 8% higher than the national average of 72%. The majority of workers are in salaried employment (77%), while 23% are self-employed. In Trompbuurt, 15% of residents receive a benefit. The largest group is those receiving a state pension (AOW). 260 people receive this benefit.
In Trompbuurt there are 1.640 homes with an average assessed value (WOZ) of €552.000. Of these, around 92% are occupied and 8% unoccupied. Most homes are rental properties. This amounts to 66% rental homes and 34% owner-occupied homes. Of the homes, 34% privately owned, 17% owned by housing associations, 49% owned by other landlords and 1% of unknown ownership. The most common construction periods in Trompbuurt are 1900-1925 (56%) and 1925-1950 (41%).
There are currently 26 homes for sale in Trompbuurt. The most recently listed home is Reinier Claeszenstraat 53-3 by BIC Makelaardij op Funda. Over the past year, 146 homes were sold in Trompbuurt. On average, a home was sold within 35 days.
The average asking price for a home for sale in Trompbuurt over the past year was €697.075. This is 26% higher than the average assessed value (WOZ) of €552.000. The average asking price per m² of plot is €10.404.
There are 4 homes for rent in Trompbuurt. The most recent home is Admiraal De Ruijterweg 60-3, offered by Keij & Stefels B.V.. Over the past year, 158 homes were let in Trompbuurt. On average, a listing was let within 40 days.
The average rent for a rental home in Trompbuurt over the past year was €3.088 per month. Per m² of plot area that is €38 per month.
In Trompbuurt there are 1.625 addresses with a registered energy label. The most common labels are C (29%), A (21%) and D (16%). On average, an address in Trompbuurt uses 1.850 kWh of electricity per year. This is 27% below the national average of 2.550 kWh. With an annual consumption of 730 m³ per address, natural gas consumption is 9% below the national average of 800 m³.
It's nice there and friendly people. But a sense of togetherness is lacking and I don't have much contact with my neighbours either, which I regret. My primary school days in this neighbourhood were really perfect and the restaurants and shops are also very good. But there are many students and expats, which makes me feel a certain divide and not much community. I myself would like to move out, but that's certainly not possible in my neighbourhood because they are far too expensive.
Auto-translated to English by AINice and cosy, there is an ice cream shop and a playground called de ruige speeltijn but now it's for babies because everything is getting super small, which is a shame, but the rest is great. We get along well and some of my friends live very close by, which is also nice. But I do think there should be more playgrounds for older children, because babies are fine at home too, but older kids just end up on their phones or laptops, so more playgrounds for older children, that's the only thing.
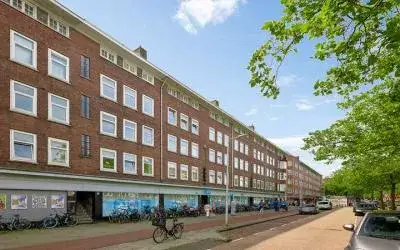
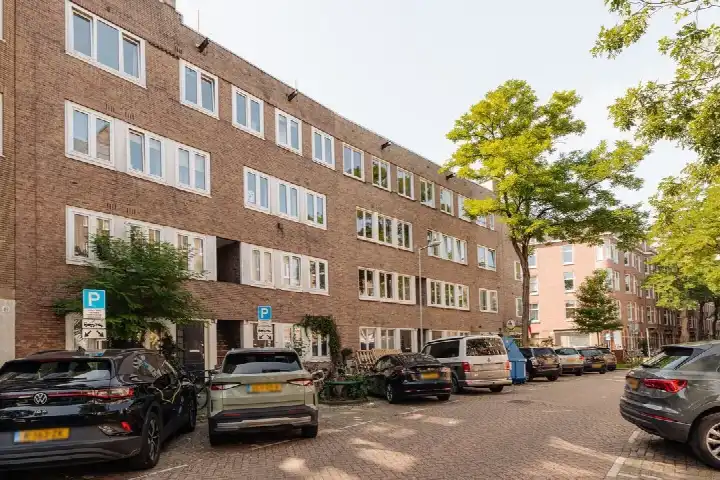
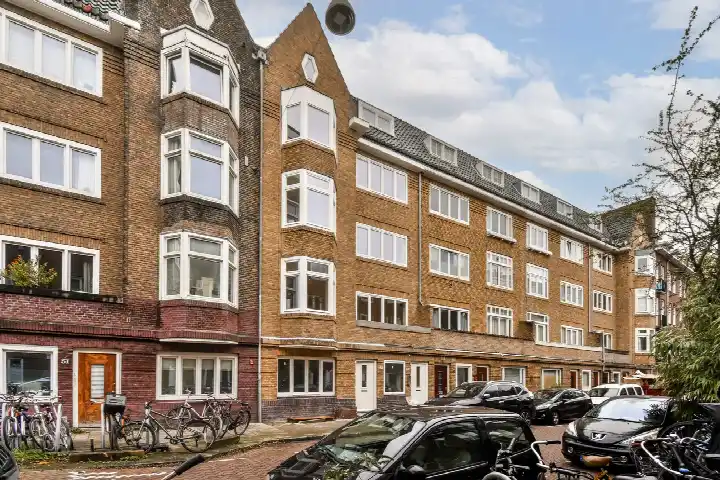
Auto-translated to English by AIThe housing stock is predominantly pre-war — 99% of the homes date from before 1945. In addition, the most common type is flats (100%).
Over the past year a home for sale in Trompbuurt was listed for an average of €681,321 (€9,022 per m²). That is 29% above the Dutch national average. Last quarter prices fell by 27%.
A rental home in Trompbuurt cost an average of €2,613 per month (€36 per m²). That is 21% above the national average.
Buurt Trompbuurt has 3,035 residents. The largest age group is 25 to 45 years (48%). Notably, 50% of the households are single-person households.
The housing supply in Trompbuurt is remarkably efficient: 61% has an A, A+ or B label. The average natural gas consumption per household is 730 m³ per year.
From Trompbuurt you can on average reach a supermarket at 0.3 km, a GP at 0.3 km, a railway station at 3.4 km, a primary school at 0.4 km (as the crow flies, source: CBS).
Right now you will find 29 homes for sale and 4 homes for rent in Trompbuurt.