Give feedback Report a problem
Neighbourhood in AmsterdamWestergasfabriek
There is 1 home in WestergasfabriekCurrently there are 2 for sale and 0 for rent
Energy label A is the most common in WestergasfabriekBased on registered homes

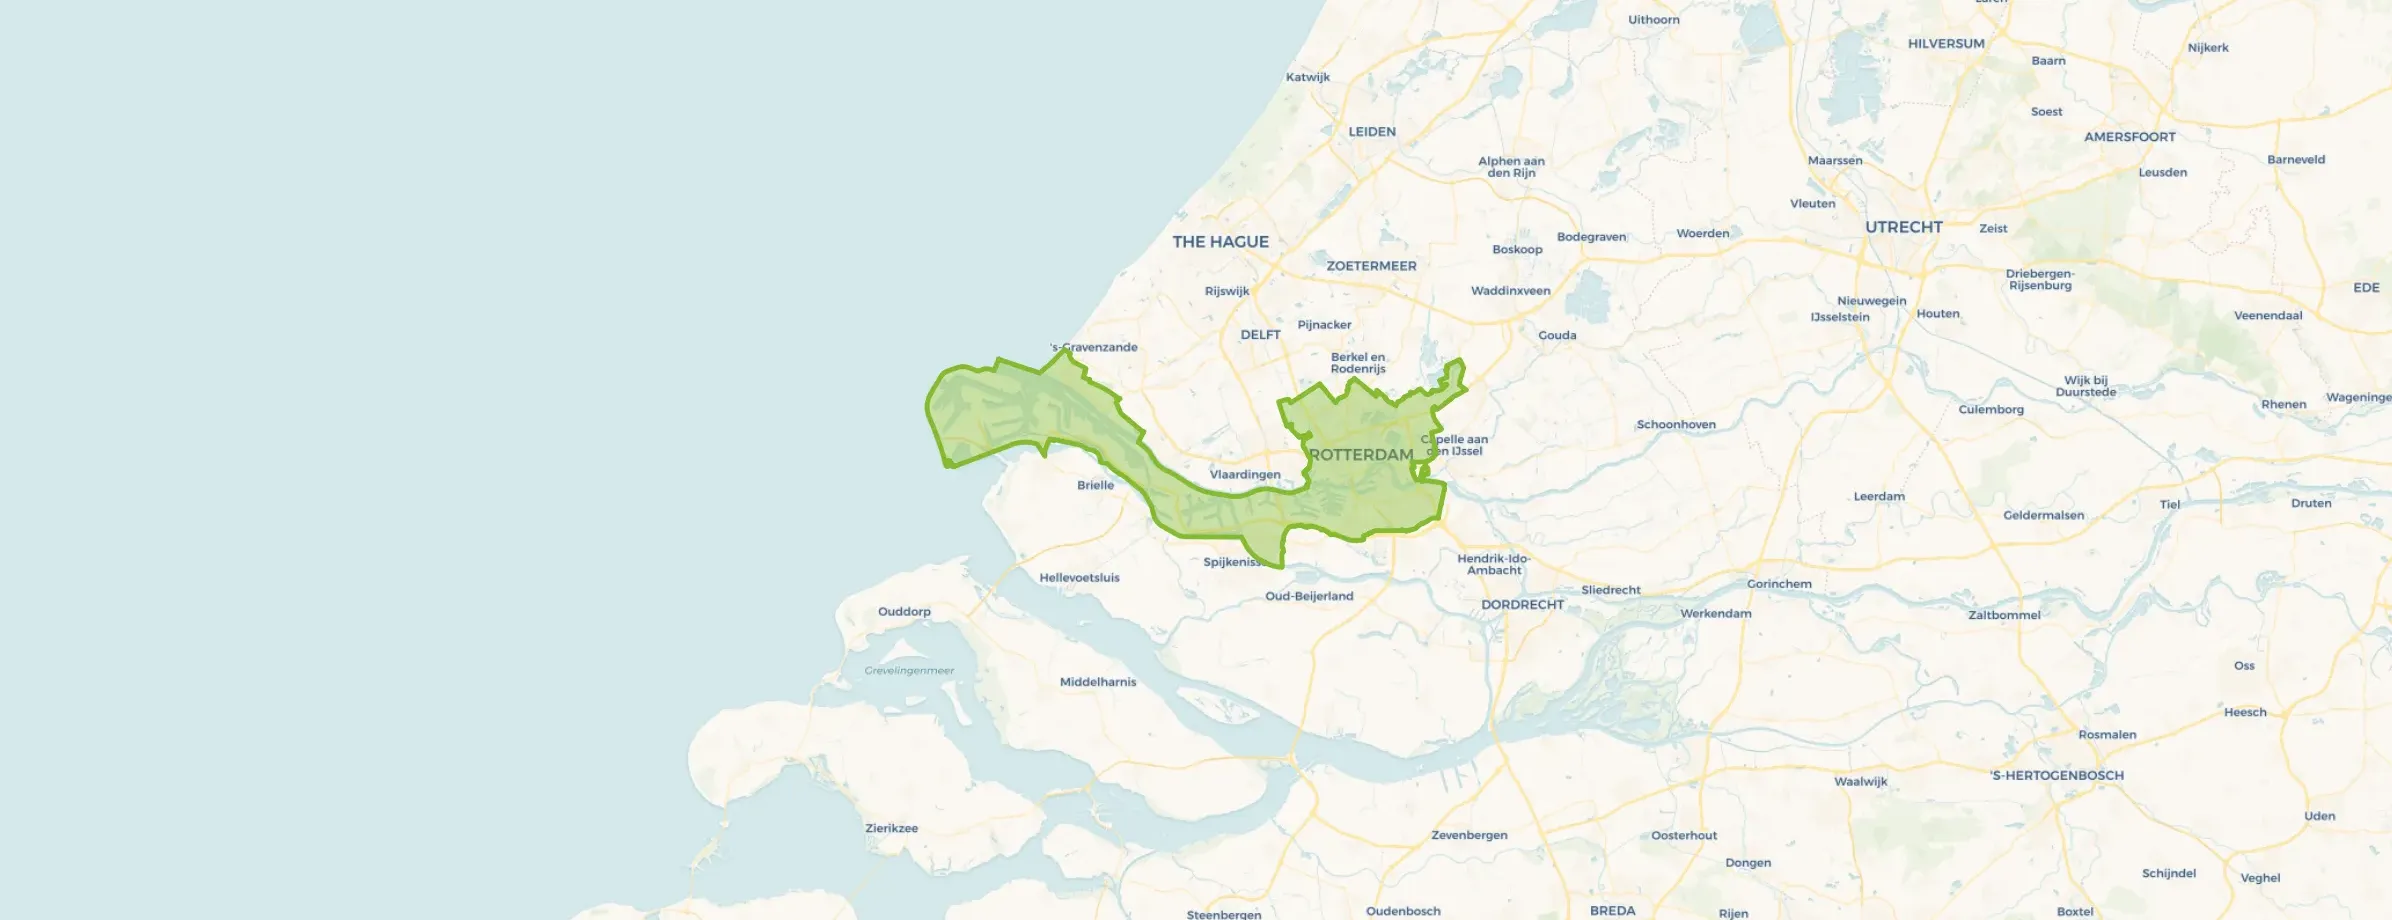
Westergasfabriek is located in the province of Noord-Holland, in the municipality of Amsterdam, in the district Spaarndammerbuurt/Zeeheldenbuurt. The neighbourhood has a total area of 26 hectares, of which 24 hectares are land and 1 hectares are water. The neighbourhood is coded as BU0363EB09. The postcode area is 1013RR-1014DD.

Housing

In Westergasfabriek there are 1 homes. The most common construction periods in Westergasfabriek are 1700-1900 (63%) and 1900-1925 (22%).

Homes for sale in Westergasfabriek

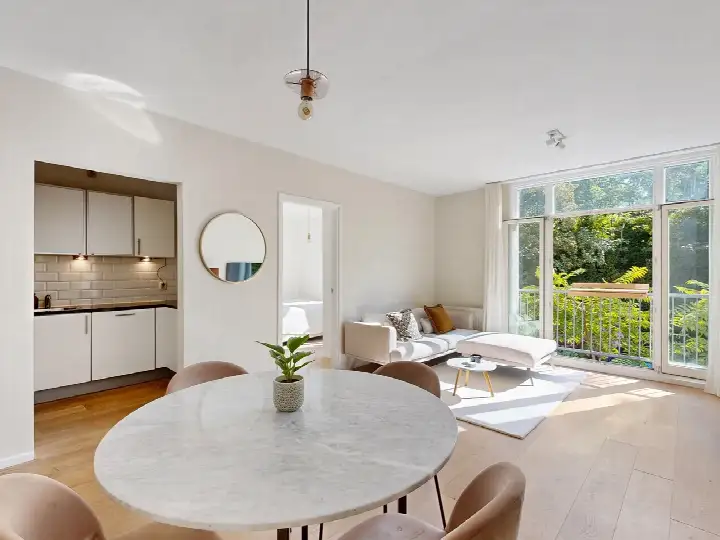
There are currently 2 homes for sale in Westergasfabriek. The most recently listed home is Zaanstraat 48 by DE LA HAYE MAKELAARDIJ O.G. op Funda. Over the past year, 1 homes were sold in Westergasfabriek. On average, a home was sold within 149 days.

Rental homes in Westergasfabriek

There are currently no homes for rent in Westergasfabriek. No homes were let in Westergasfabriek over the past year.

No recent rental data available for Westergasfabriek.

Energy

In Westergasfabriek there are 9 addresses with a registered energy label. The most common labels are C (33%), G (33%) and A (22%).

Street names

  • Haarlemmerweg
  • Brettenpad
  • Gosschalklaan
  • Zaanstraat
  • Polonceau-kade
  • Klönne plein
  • Westerpark
  • B&W Allee
  • Klönneplein
  • Houtmankade
  • Pazzanistraat
  • Spaarndammerstraat
Rate Westergasfabriek

Share your opinion and help improve the neighbourhood.

  • Takes less than 2 minutes
  • Help home seekers
  • Improve your neighbourhood
Write a review
–
Westergasfabriek has no ratings yet
Ratings can be submitted via the button below
Write a review
Safety
Housing
Cleanliness
Amenities
Education
Community
Greenery
Accessibility

Housing market in Spaarndammerbuurt/Zeeheldenbuurt

Figures for the district Spaarndammerbuurt/Zeeheldenbuurt due to limited data

Price trend for sale

Sale price per quarter · Q3 '25 – Q4 '26
Average
Median

Price trend for rent

Rent per quarter · Q3 '25 – Q4 '26
Average
Median

Sales market

Market speed and dynamics, last 12 months
36 days ▼ 42,8%
average time listed · vs. last year
171
sales in the past year
60 m²
average living area
-1%
cheaper than the national average

Rental market

Market speed and dynamics, last 12 months
28 days ▼ 35,9%
average time listed · vs. last year
46
lettings in the past year
73 m²
average living area
+24%
more expensive than the national average

Year built

Age of the housing stock

Energy labels

Sustainability of the housing stock

Living area

Distribution of home sizes

Statistics about the homes

Home types

Addresses per home type

Construction periods

Addresses per construction period

Labels

Addresses per energy label

Energy consumption

Average per address, compared with the Netherlands
Natural gas (m³)
Westergasfabriek
0
Netherlands
800
Electricity (kWh)
Westergasfabriek
0
Netherlands
2.550
Homes Rate your neighbourhood
Buurtje.nl
Buurtje.nl in the appSearch faster and respond first
Open