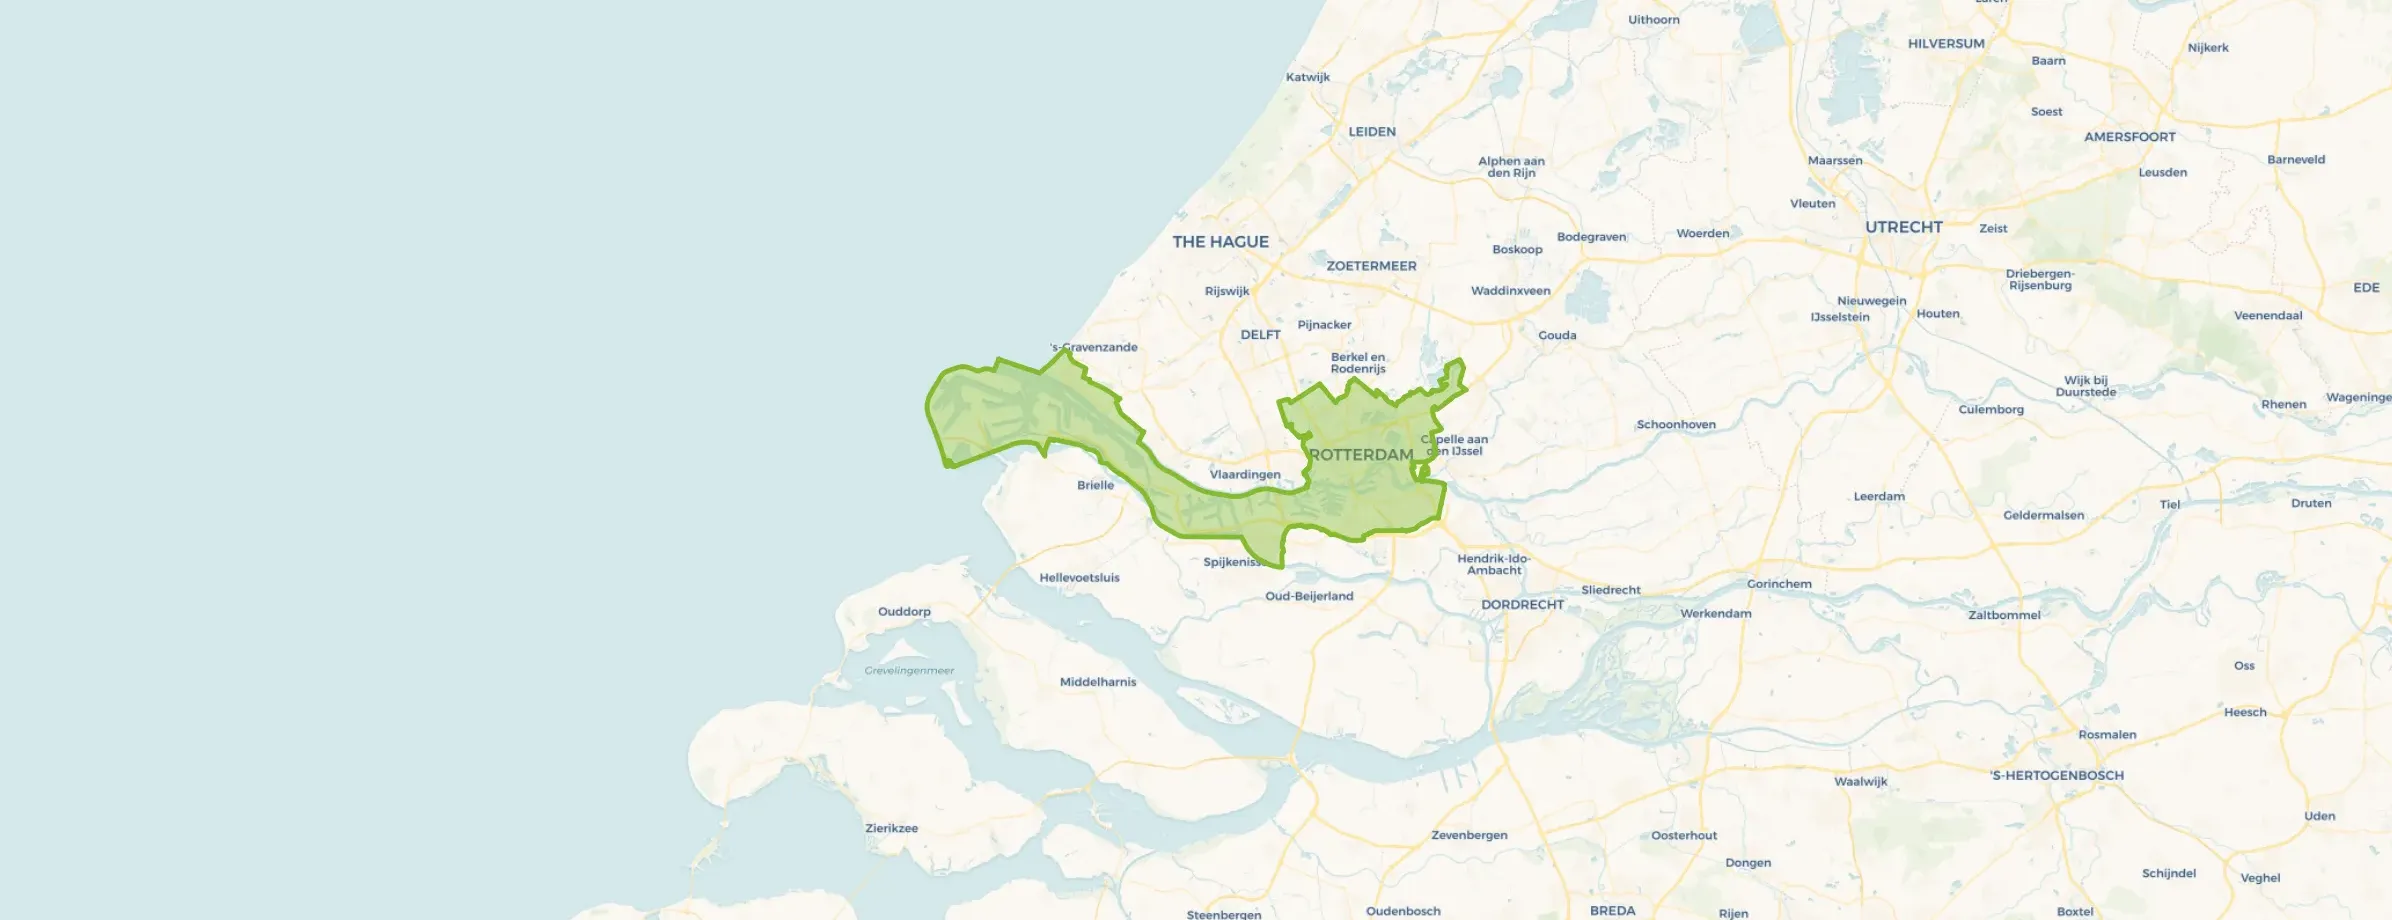
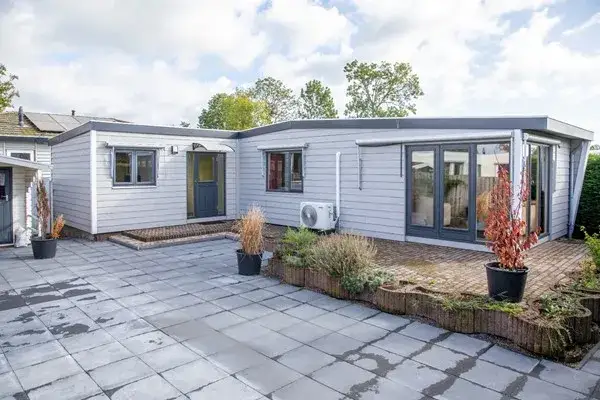
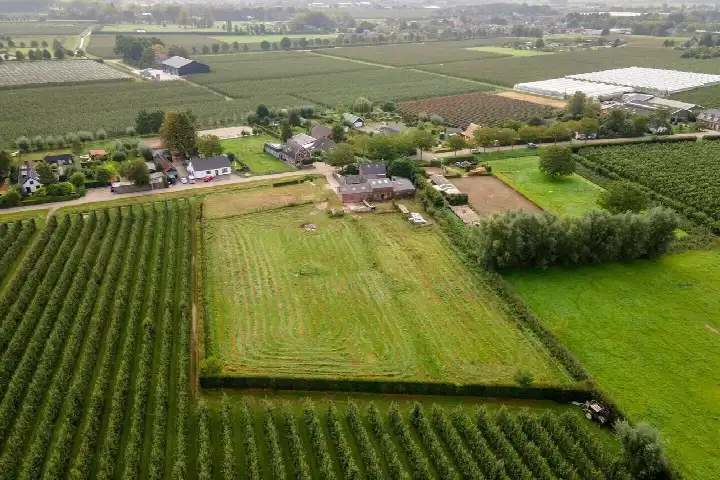
Maurik is located in the province of Gelderland, in the municipality of Buren. The district has a total area of 3.009 hectares, of which 2.666 hectares are land and 343 hectares are water. The district is coded as WK021405. The postcode area is 4021AA-4031KC.
Maurik has 7.410 residents. Of these, 49,7% are men and 50,2% are women. Most residents are 45 to 65 years (30,3%). The other age groups are 22,4% for '25 to 45 years', 22,1% for '65 years or older', 14,4% for '0 to 15 years' and 10,8% for '15 to 25 years'. Of the residents, 44,2% is unmarried, 42,7% is married, 7,2% is divorced and 5,9% is widowed. 6.275 residents originate from the Netherlands, 655 come from Europe and 480 come from countries outside Europe.
There are 3.250 households in Maurik. 32,0% of these are single-person households, 33,1% households without children and 34,9% households with children. The average household size is 2,3 persons. The national average is 2,1 persons.
In Maurik there are 6.000 income recipients. The average income per income recipient is €41.900, which is €300 (1%) lower than the national average of €42.200. Per resident, the average income is €34.900, which is €0 (0%) lower than the national average of €34.900. Most residents of Maurik are educated to an intermediate level. 41,1% have an intermediate education (HAVO, VWO or MBO 2-4), 36,8% have a lower education (VMBO or MBO 1) and 22,1% have a university or higher professional education (HBO/WO).
Of the 7.410 residents, around 74% are in paid employment, which amounts to 5.483 people. This is 2% higher than the national average of 72%. The majority of workers are in salaried employment (80%), while 20% are self-employed. In Maurik, 26% of residents receive a benefit. The largest group is those receiving a state pension (AOW). 1.450 people receive this benefit.
In Maurik there are 2.923 homes with an average assessed value (WOZ) of €453.000. Of these, around 97% are occupied and 3% unoccupied. Most homes are owner-occupied. This amounts to 30% rental homes and 70% owner-occupied homes. Of the homes, 70% privately owned, 24% owned by housing associations and 6% owned by other landlords. The most common construction periods in Maurik are 1970-1980 (17%) and 1950-1970 (15%).
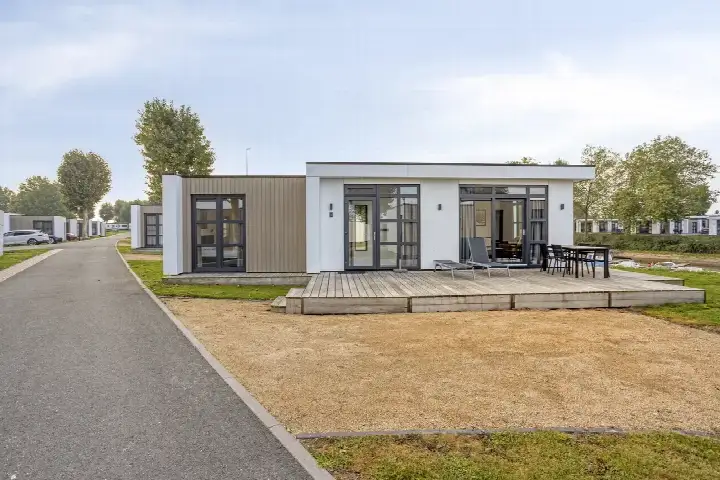
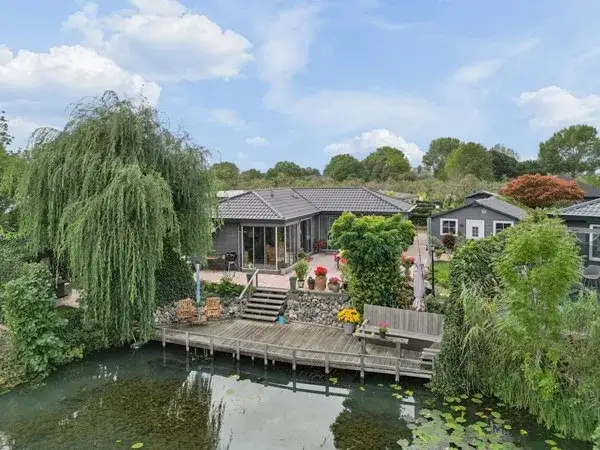
There are currently 76 homes for sale in Maurik. The most recently listed home is Rijnbandijk 36-75 by Het Makelaarshuys Tiel op Funda. Over the past year, 108 homes were sold in Maurik. On average, a home was sold within 72 days.
The average asking price for a home for sale in Maurik over the past year was €527.487. This is 16% higher than the average assessed value (WOZ) of €453.000. The average asking price per m² of floor area is €3.548.
There are 2 homes for rent in Maurik. The most recent home is Rijnbandijk 10-70, offered by Zonnenberg Makelaardij Ede-Wageningen B.V.. Over the past year, 7 homes were let in Maurik. On average, a listing was let within 146 days.
The average rent for a rental home in Maurik over the past year was €2.051 per month. Per m² of floor area that is €13 per month.
In Maurik there are 1.810 addresses with a registered energy label. The most common labels are A (29%), C (23%) and B (14%). On average, an address in Maurik uses 3.260 kWh of electricity per year. This is 28% above the national average of 2.550 kWh. Natural gas consumption, at 990 m³ per year, is 24% above the national average of 800 m³.
You have to be strong to live in Eck en Wiel in a rental home. The owner-occupied homes are okay. My experience is that it's better there. Of course, there's a village idiot like in every neighbourhood. In this case, there are several who keep their curtains closed and no longer open the door just like that. Young children cannot play outside alone. Everything is swept under the rug or dismissed. There are also fortunately many nice people. However, that doesn't change the fact that I have never experienced anything like this before. Terrible, just move somewhere else if you still have the choice. I enjoy walking the dog in the city more. There are no areas where the dog can run off-leash. There is a small playground for very young children. Furthermore, Eck en Wiel is not child-friendly. They can play on the pavement. The cars drive too fast. Nothing is done about it. There is also constant noise from music or dogs. Even at night.
Auto-translated to English by AIMaurik is nice but not for students
Auto-translated to English by AIA lot of nuisance from the youth but otherwise a nice village to live in.
Auto-translated to English by AIOver the past year a home for sale in Maurik was listed for an average of €527,487 (€3,548 per m²). Last quarter prices rose by 6%.
Residents give Maurik a 6.5 out of 10 based on 3 reviews. The strongest score is for cleanliness (9.0), the weakest for education (4.7).
Wijk Maurik has 7,410 residents. The largest age group is 45 to 65 years (30%). Many families: 35% of the households have children.
The housing supply in Maurik is remarkably efficient: 59% has an A, A+ or B label. The average natural gas consumption per household is 990 m³ per year.
From Maurik you can on average reach a supermarket at 1.1 km, a GP at 1.6 km, a railway station at 10.3 km, a primary school at 1.0 km (as the crow flies, source: CBS).
Right now you will find 76 homes for sale and 2 homes for rent in Maurik. A home for sale here is listed for an average of 72 days — relatively long for the current market.