District in Amersfoort
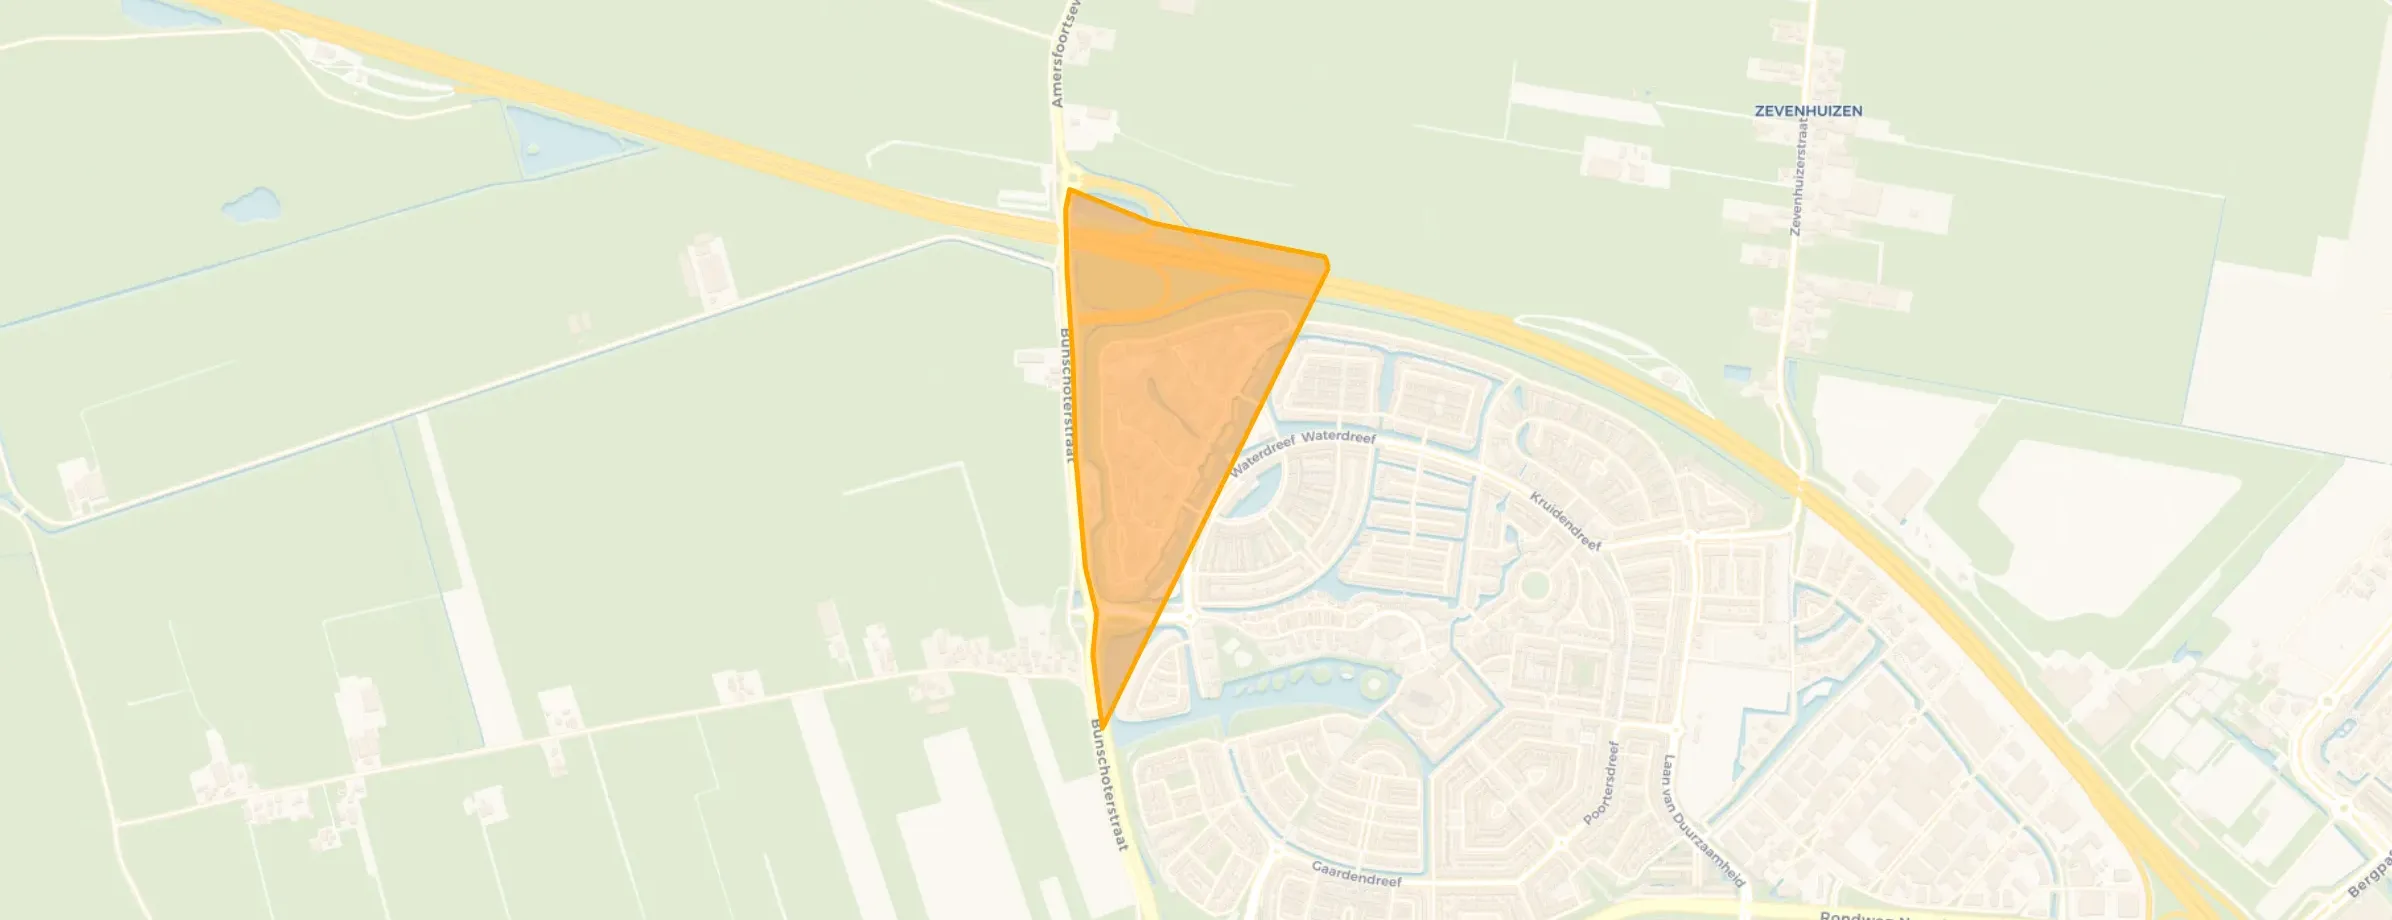
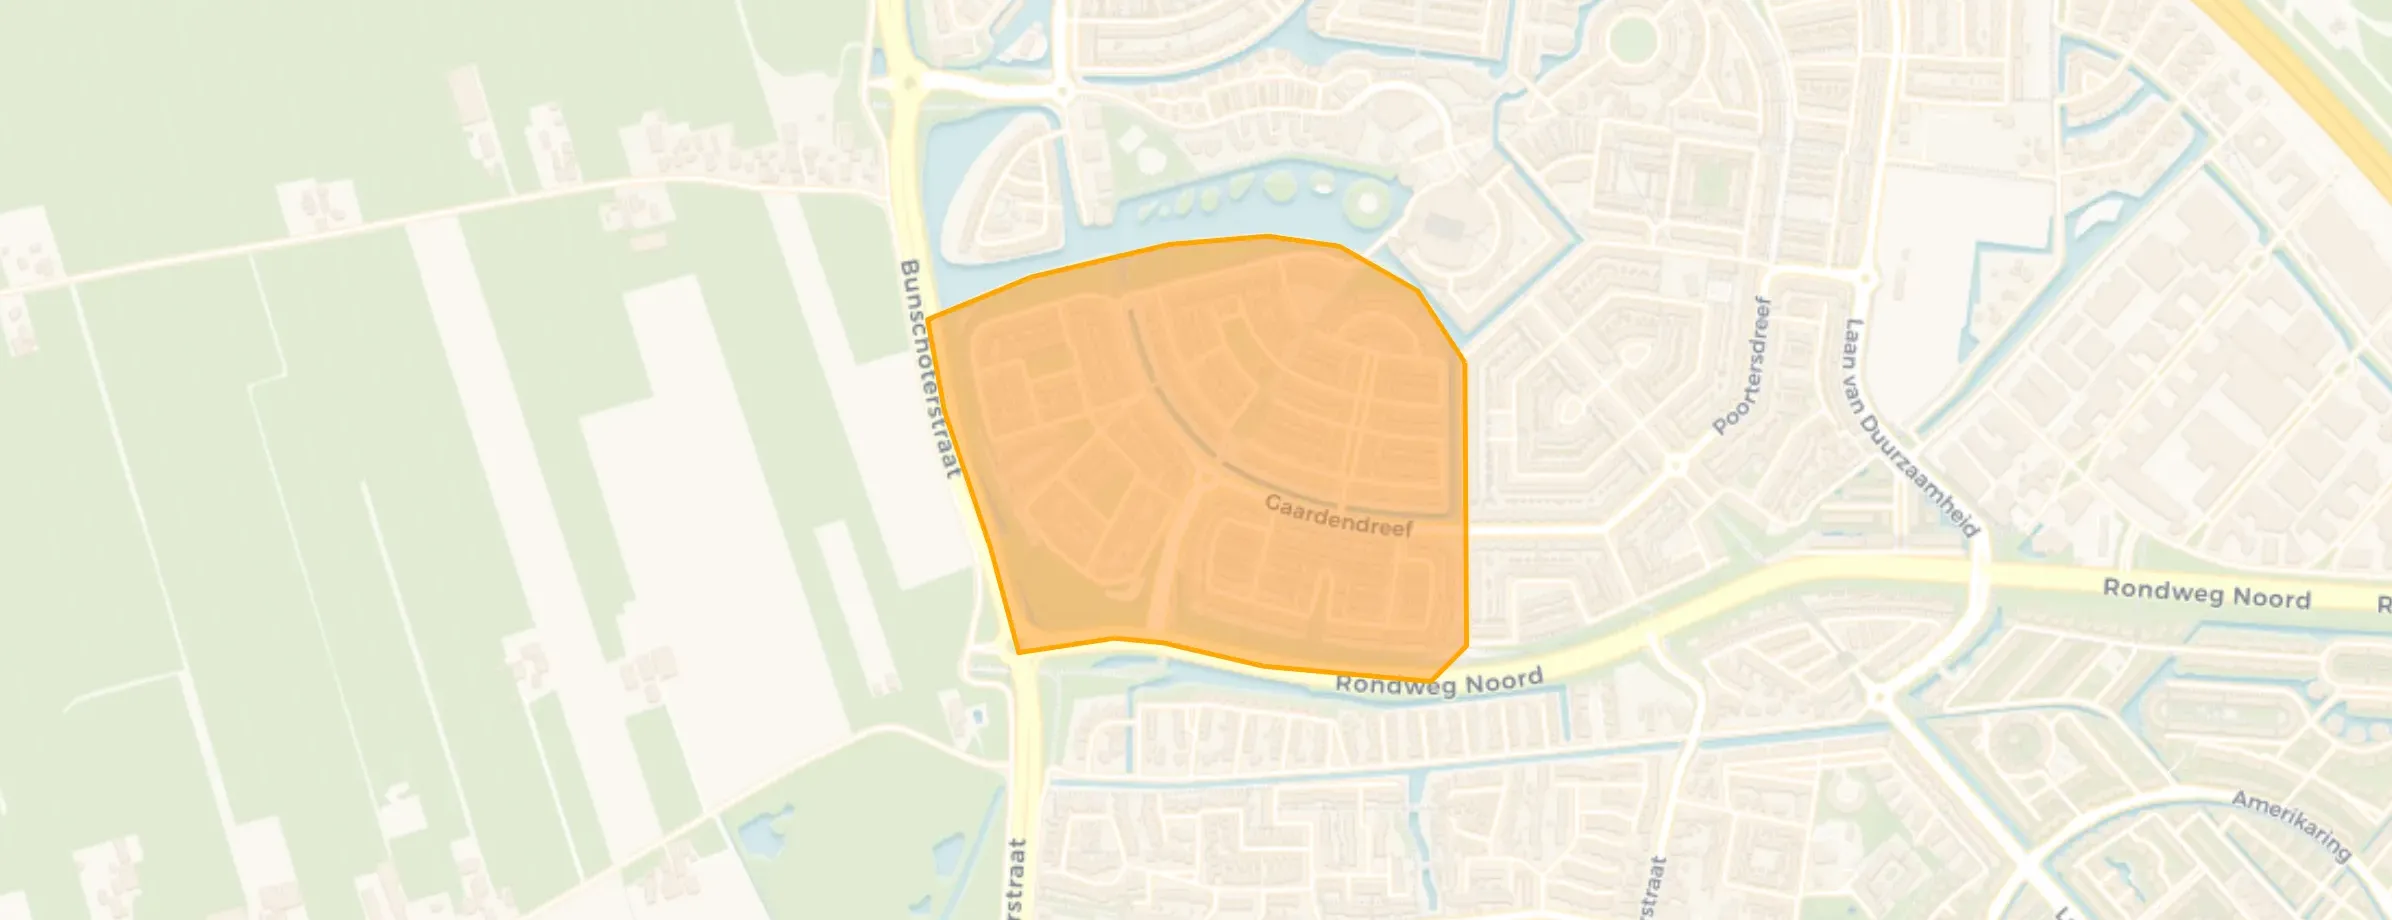
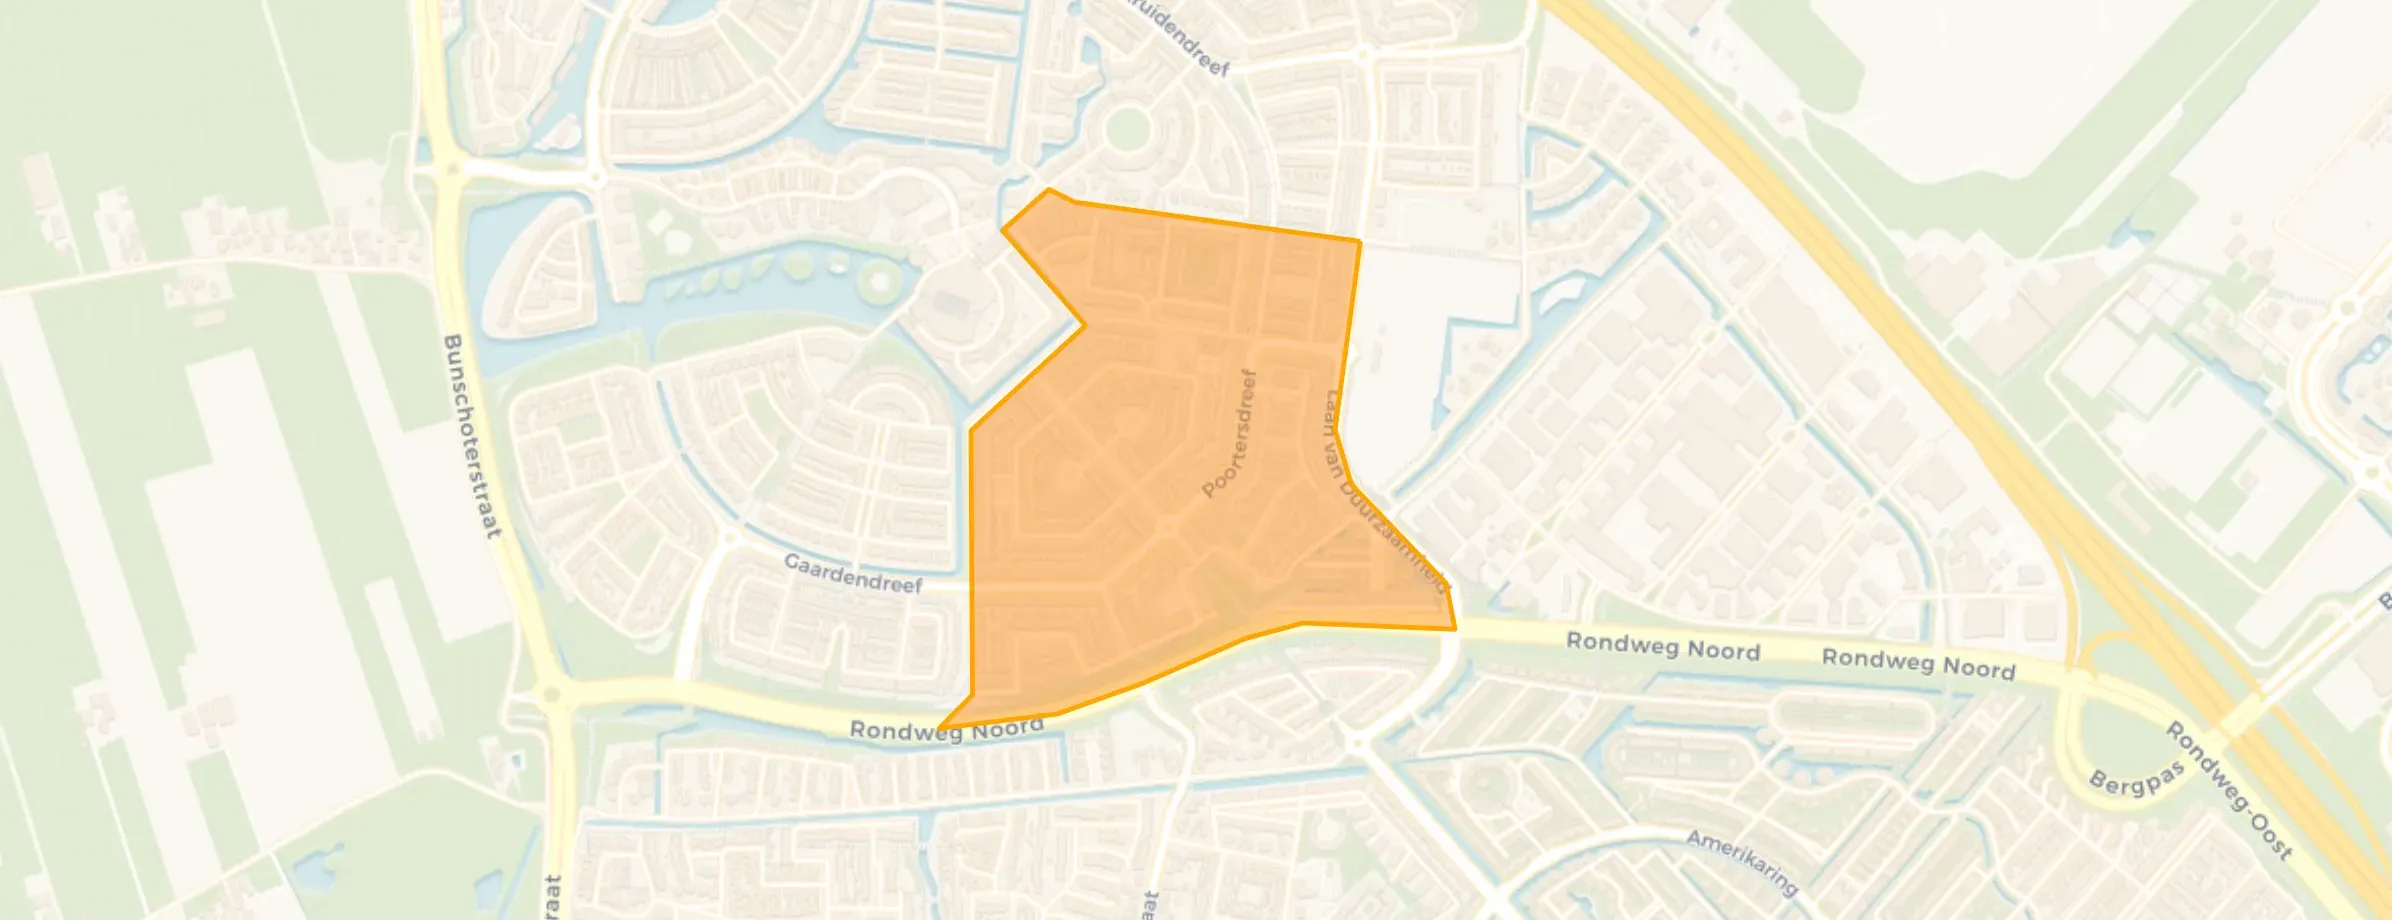
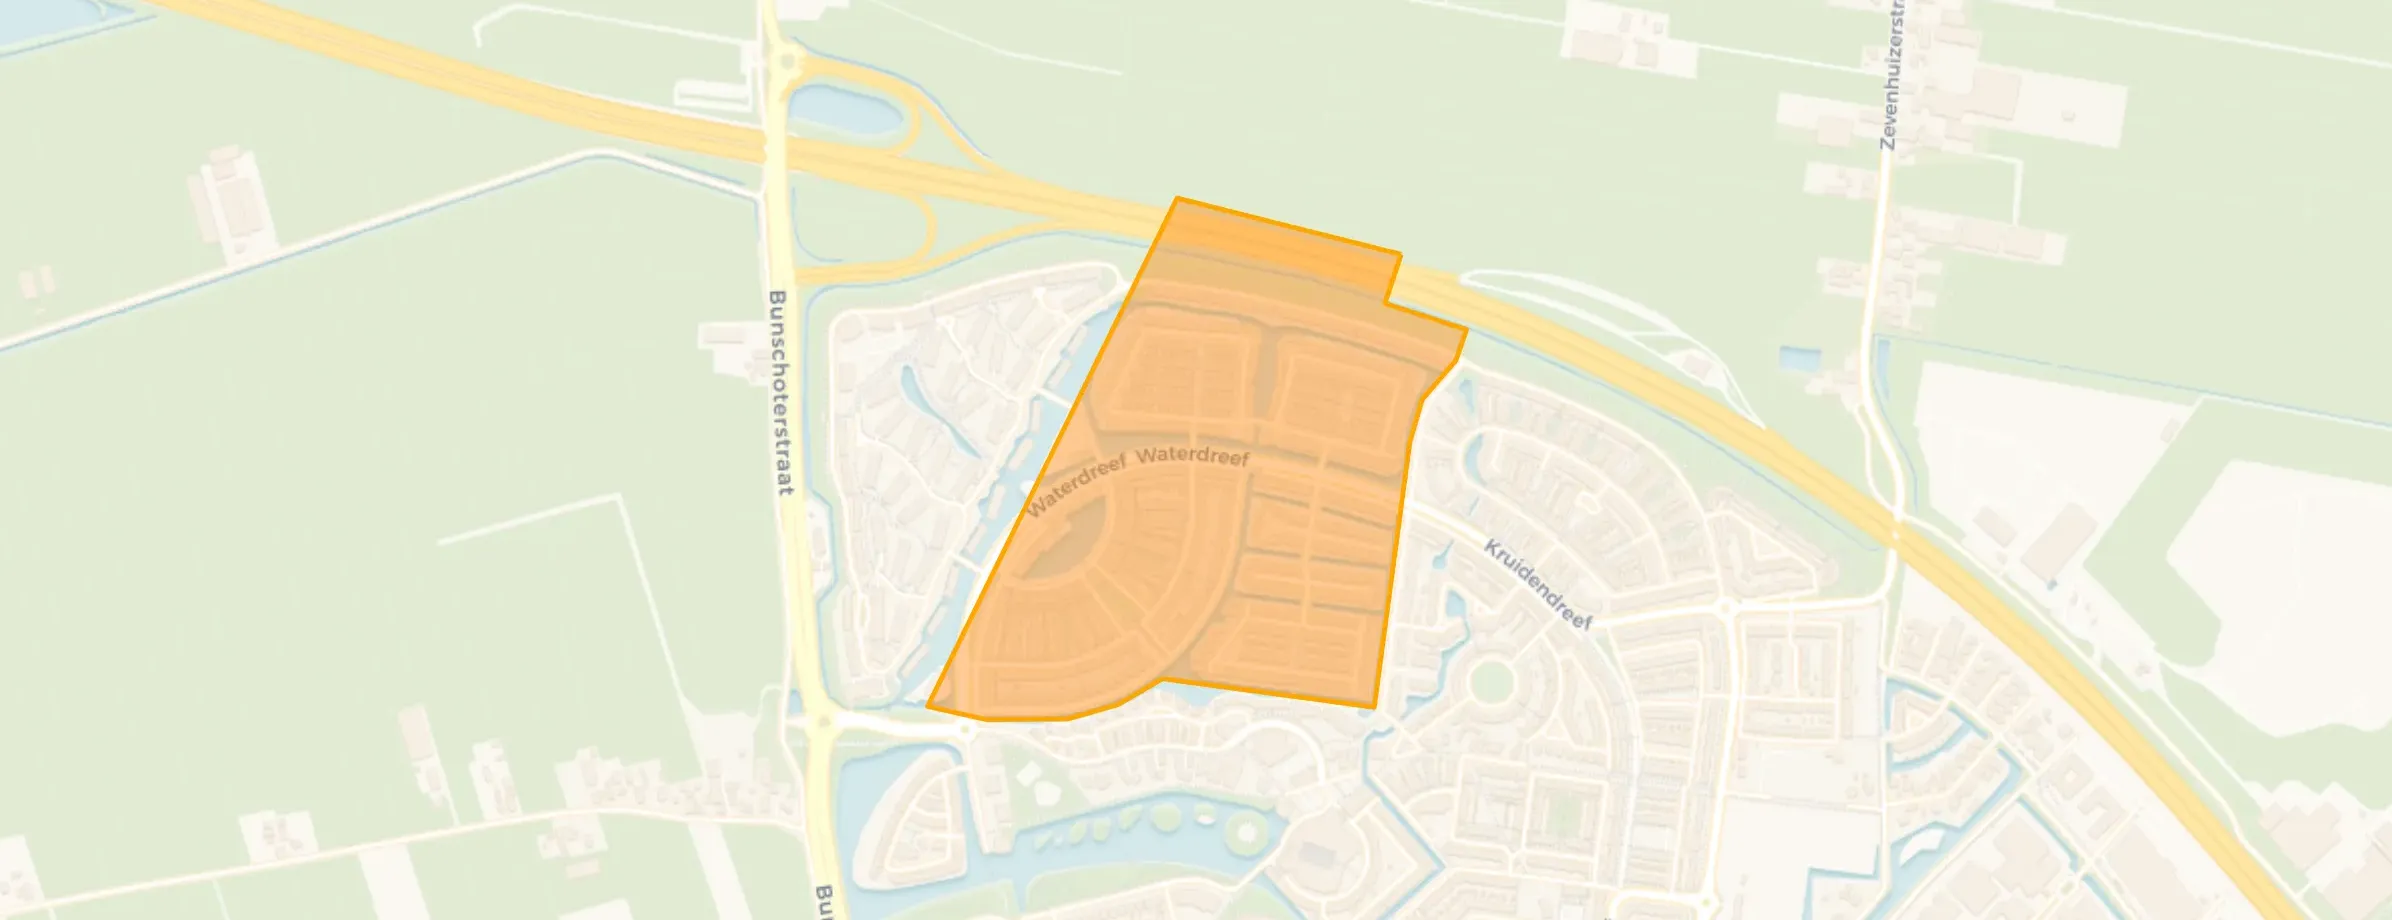
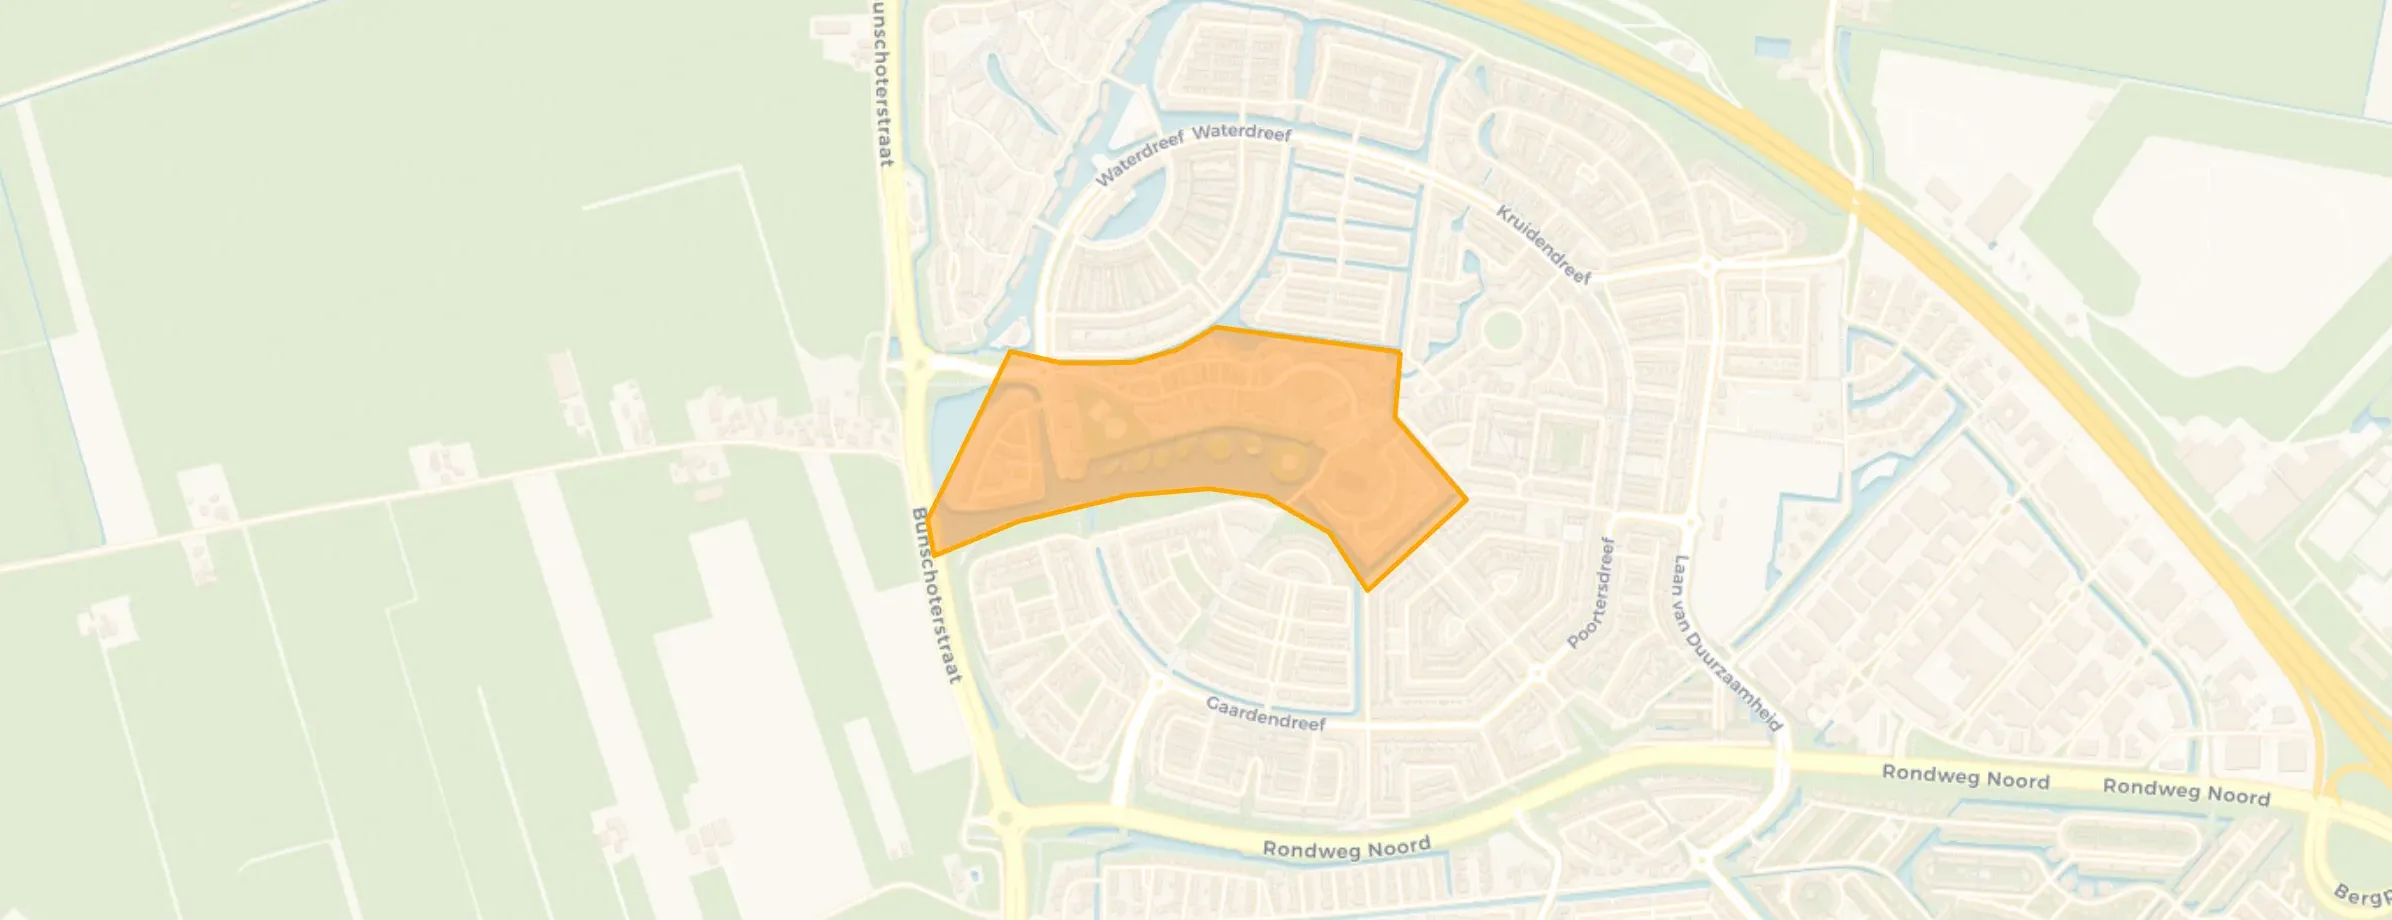
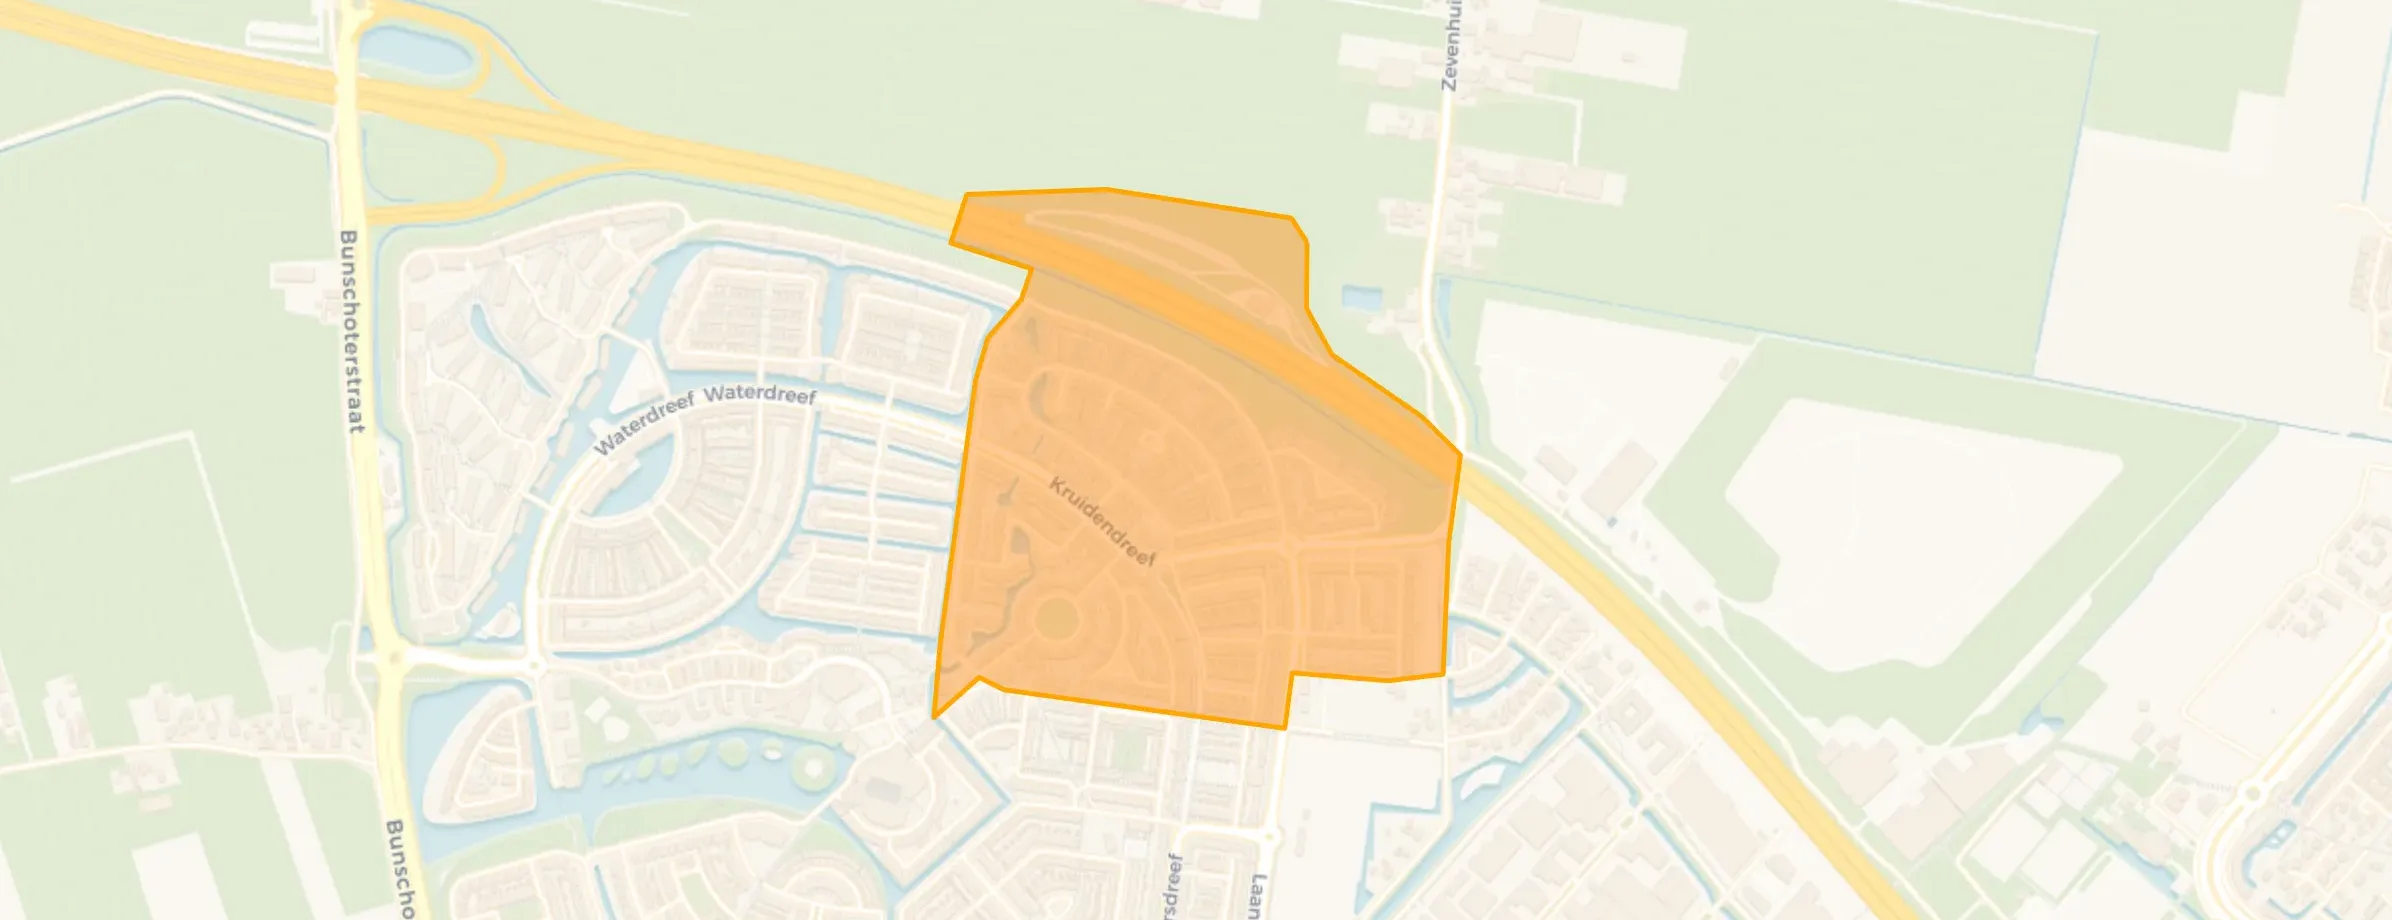
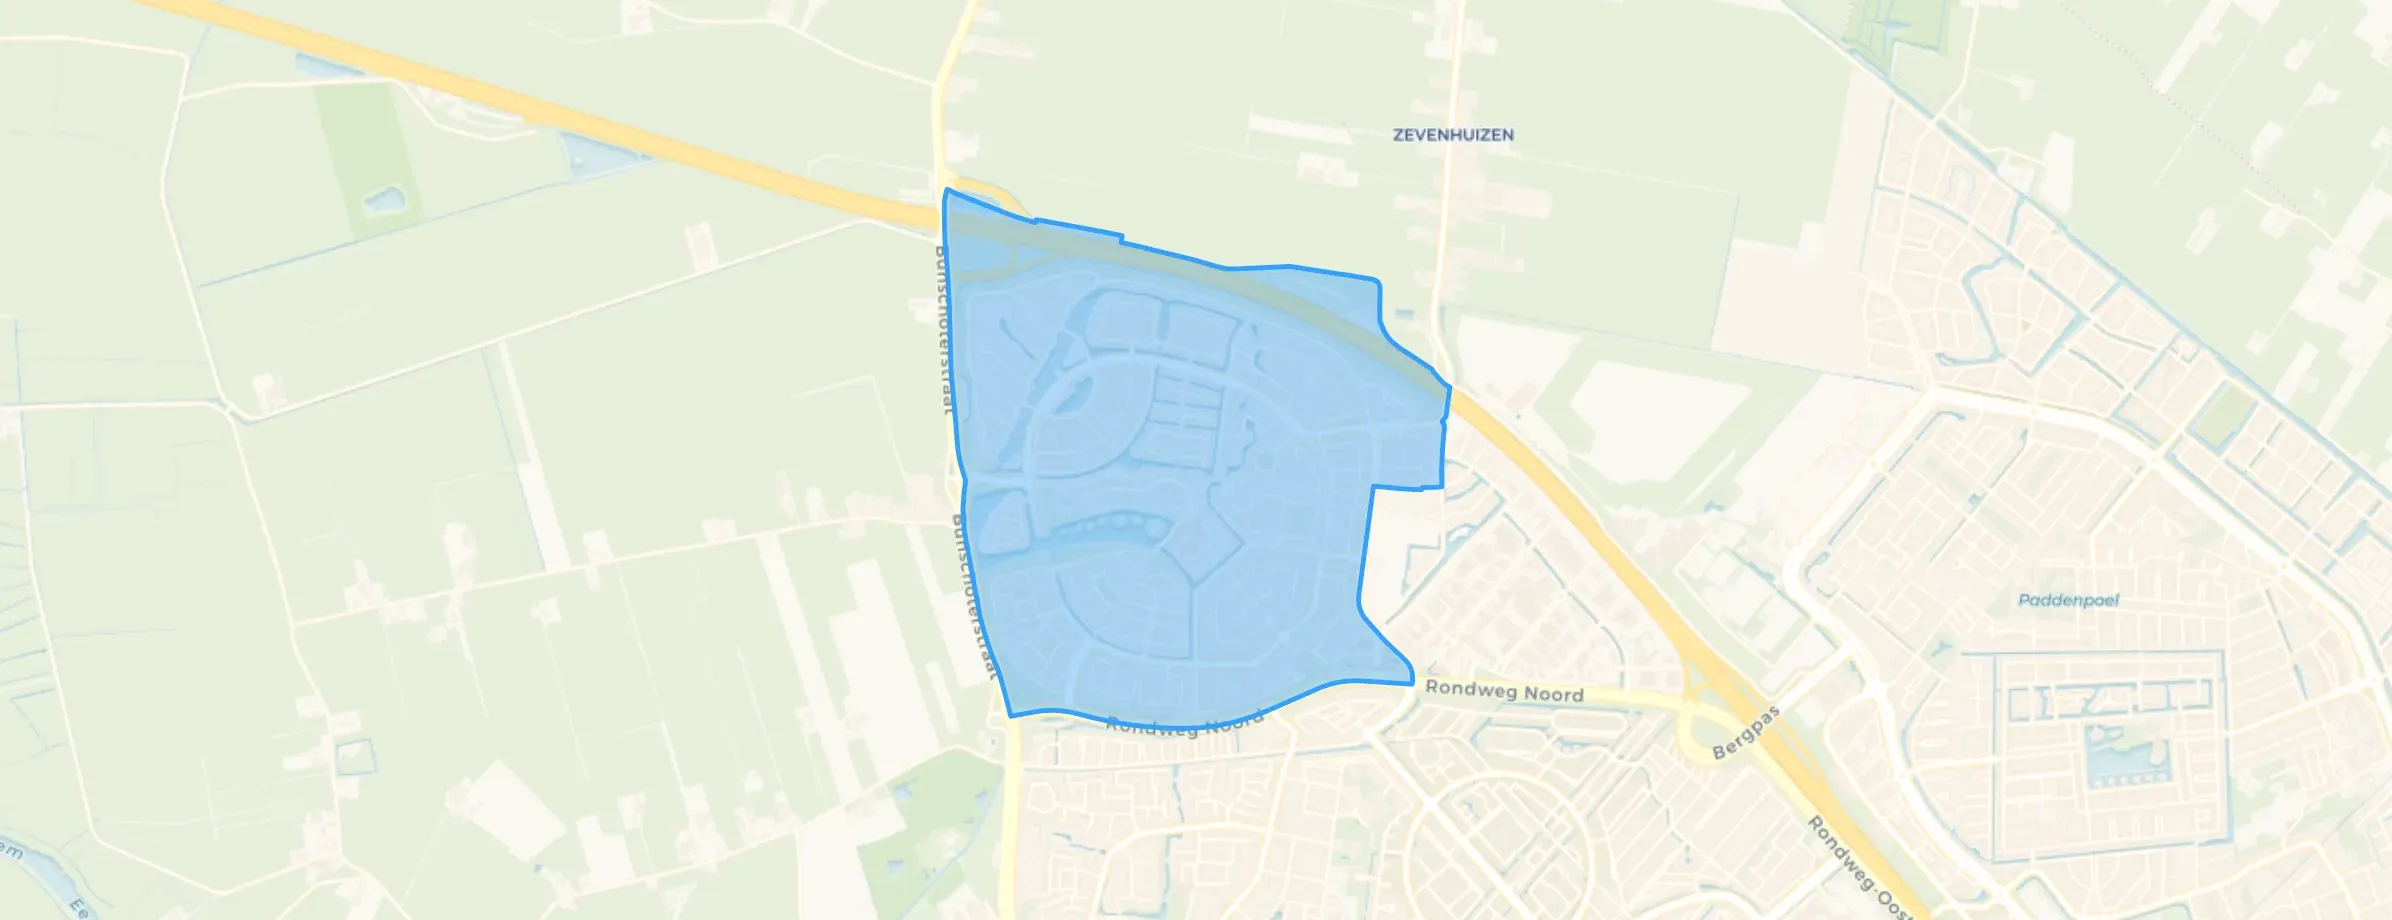
Nieuwland is located in the province of Utrecht, in the municipality of Amersfoort The district has a total area of 210 hectares, of which 197 hectares are land and 13 hectares are water. The district is coded as WK030724. The postcode area is 3821CH-3828NN.
Nieuwland has 14.330 residents. Of these, 50,3% are men and 49,7% are women. Most residents are 45 to 65 years (33,3%). The other age groups are 24,3% for '25 to 45 years', 16,6% for '0 to 15 years', 14,4% for '15 to 25 years' and 11,3% for '65 years or older'. Of the residents, 49,1% is unmarried, 41,2% is married, 7,6% is divorced and 2,0% is widowed. 10.620 residents originate from the Netherlands, 830 come from Europe and 2.880 come from countries outside Europe.
There are 5.795 households in Nieuwland. 25,3% of these are single-person households, 29,1% households without children and 45,6% households with children. The average household size is 2,5 persons. The national average is 2,1 persons.
In Nieuwland there are 11.700 income recipients. The average income per income recipient is €47.200, which is €5.000 (12%) higher than the national average of €42.200. Per resident, the average income is €38.400, which is €3.500 (10%) higher than the national average of €34.900. Most residents of Nieuwland are highly educated. 41,5% have a university or higher professional education (HBO/WO), 38,3% have an intermediate education (HAVO, VWO or MBO 2-4) and 20,1% have a lower education (VMBO or MBO 1).
Of the 14.330 residents, around 80% are in paid employment, which amounts to 11.464 people. This is 8% higher than the national average of 72%. The majority of workers are in salaried employment (86%), while 14% are self-employed. In Nieuwland, 16% of residents receive a benefit. The largest group is those receiving a state pension (AOW). 1.400 people receive this benefit.
In Nieuwland there are 5.728 homes with an average assessed value (WOZ) of €432.000. Of these, around 99% are occupied and 1% unoccupied. Most homes are owner-occupied. This amounts to 24% rental homes and 76% owner-occupied homes. Of the homes, 76% privately owned, 18% owned by housing associations and 6% owned by other landlords. The most common construction periods in Nieuwland are 1990-2000 (77%) and 2000-2010 (20%).
There are currently no homes for sale in Nieuwland. The most recently listed home is Het Groene Schaap 7 by Telman & Van Leeuwen Makelaars. No homes were sold in Nieuwland over the past year.
There are currently no homes for rent in Nieuwland. The most recent home is Visotter 15, offered by Interhouse makelaars Amersfoort op Funda. No homes were let in Nieuwland over the past year.
No recent rental data available for Nieuwland.
In Nieuwland there are 3.404 addresses with a registered energy label. The most common labels are A (56%), B (28%) and A+ (7%). On average, an address in Nieuwland uses 2.700 kWh of electricity per year. This is 6% above the national average of 2.550 kWh. With an annual consumption of 620 m³ per address, natural gas consumption is 23% below the national average of 800 m³.
Fijne buurt met veel doorstromers. Veilige en stille buurt. Bereikbaarheid is goed met voldoende uitvalswegen alle richtingen op en winkels en voorzieningen als huisarts, tandarts, scholen zijn dichtbij. Centrum is een goed kwartier fietsen en station is bereikbaar met OV én auto ( 10-15 min).
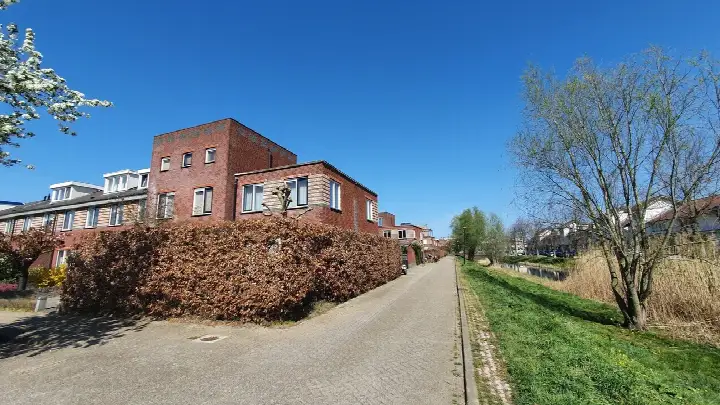
Auto-translated to English by AINice neighbourhood with lots of green. Close to the motorway, hospital, shops and schools.
Auto-translated to English by AIIt's a quiet but cosy neighbourhood
Auto-translated to English by AIThe neighbourhood is pleasant to live in, but there is little to do in the area and also little sense of community. The shopping centre is quite empty and has few shops besides the supermarket, hairdressers, florist and eateries. Little atmosphere.
Auto-translated to English by AIAll grumpy neighbours who complain about everything and call the police
Auto-translated to English by AINot applicable
Auto-translated to English by AIEducation: several primary schools within walking distance, secondary schools and further education within cycling distance. Nature: a beautiful stream in the middle of the neighbourhood. Community: a typical family neighbourhood but when the children get older and you grow out of that stage, it's no longer the cosiest place. For that, you'd be better off in Hoogland. Accessibility: with a bit of searching, enough parking spaces, close to the motorway, a bus every 5 to 10 minutes at one of the 3 stops. Apart from the centre and the stations, one of the best-connected neighbourhoods in Amersfoort.
Auto-translated to English by AIPeople should be neat, nice and caring without ulterior motives and not smoke weed and not drink alcohol and also not offer it.
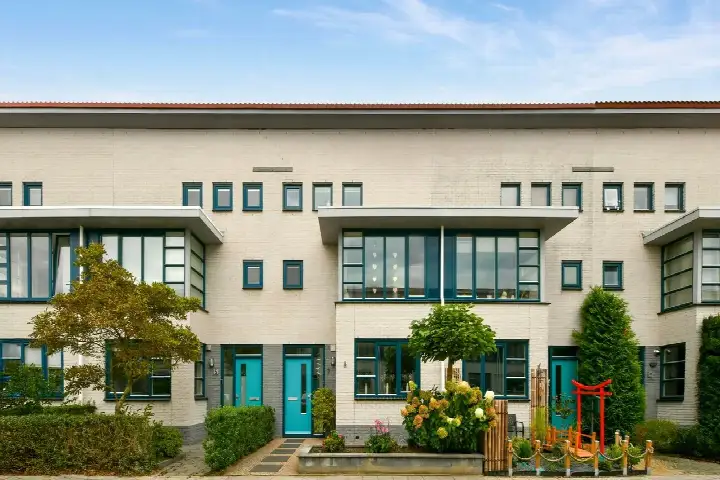
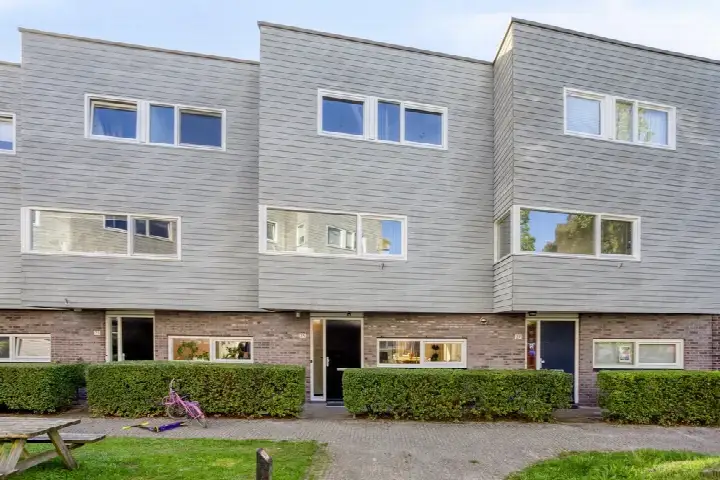
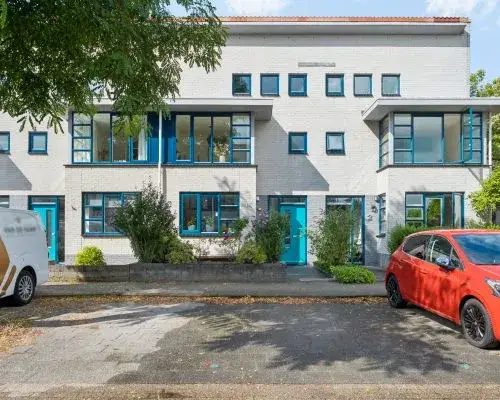
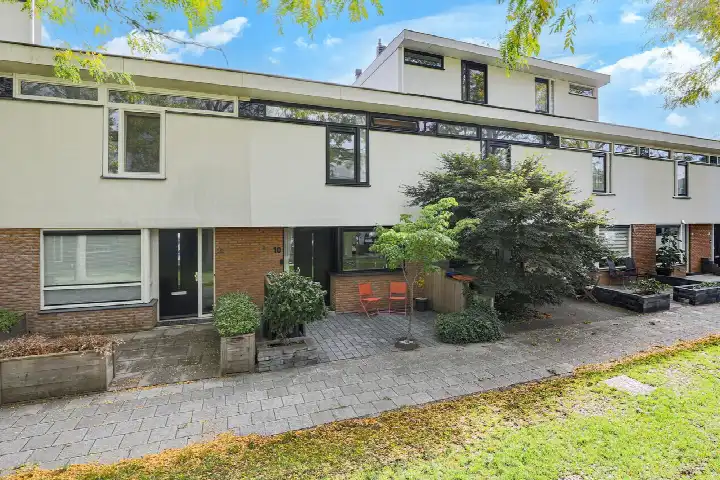
Auto-translated to English by AIThe housing stock is relatively young — 100% dates from after 1990. In addition, the most common type is terraced houses (54%).
Over the past year a home for sale in Nieuwland was listed for an average of €502,253 (€3,970 per m²). Last quarter prices fell by 10%.
A rental home in Nieuwland cost an average of €1,669 per month (€18 per m²). That is 23% below the national average.
Residents give Nieuwland a 7.3 out of 10 based on 8 reviews. The strongest score is for housing (8.1), the weakest for community (6.1).
Wijk Nieuwland has 14,330 residents. The largest age group is 45 to 65 years (33%). Many families: 46% of the households have children.
The housing supply in Nieuwland is remarkably efficient: 98% has an A, A+ or B label. The average natural gas consumption per household is 620 m³ per year.
From Nieuwland you can on average reach a supermarket at 1.4 km, a GP at 1.0 km, a railway station at 4.9 km, a primary school at 1.2 km (as the crow flies, source: CBS).
Right now you will find 43 homes for sale and 3 homes for rent in Nieuwland.