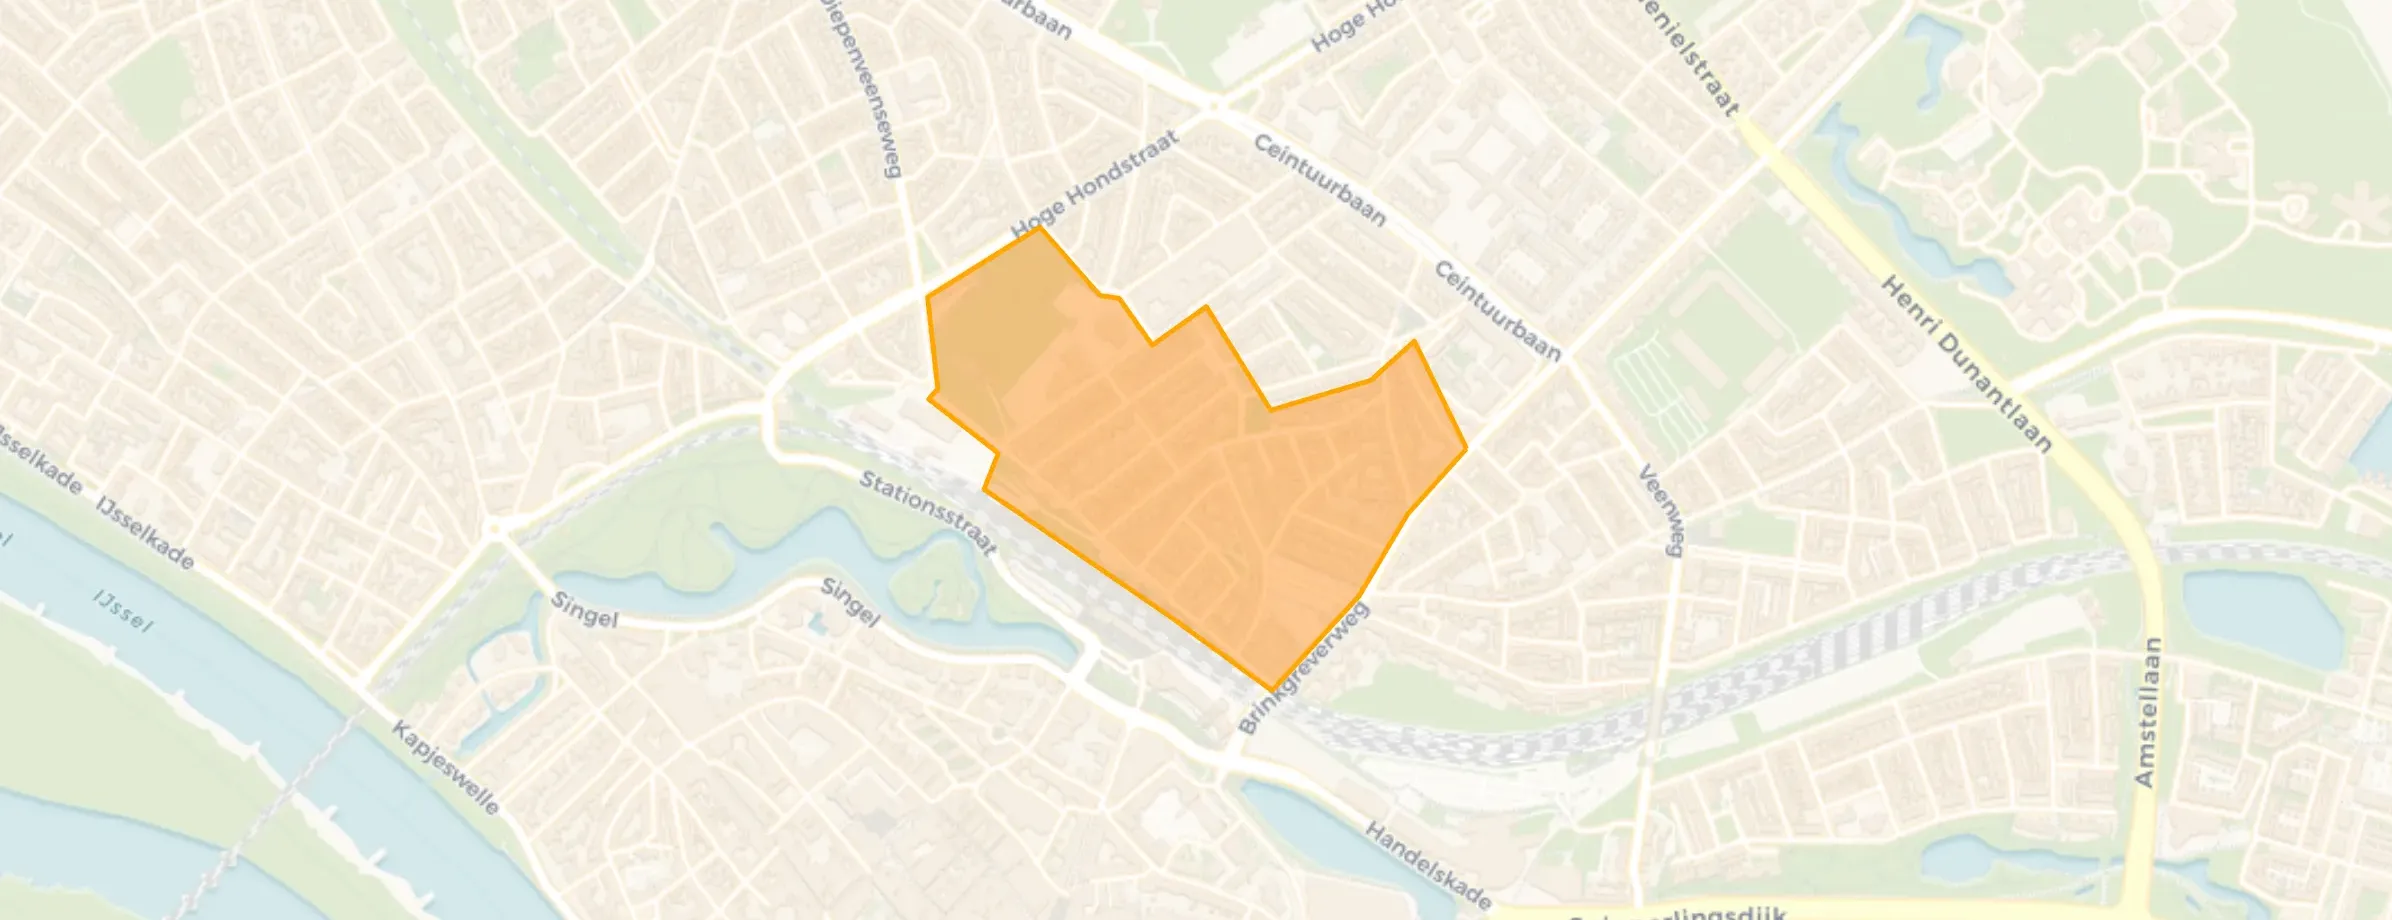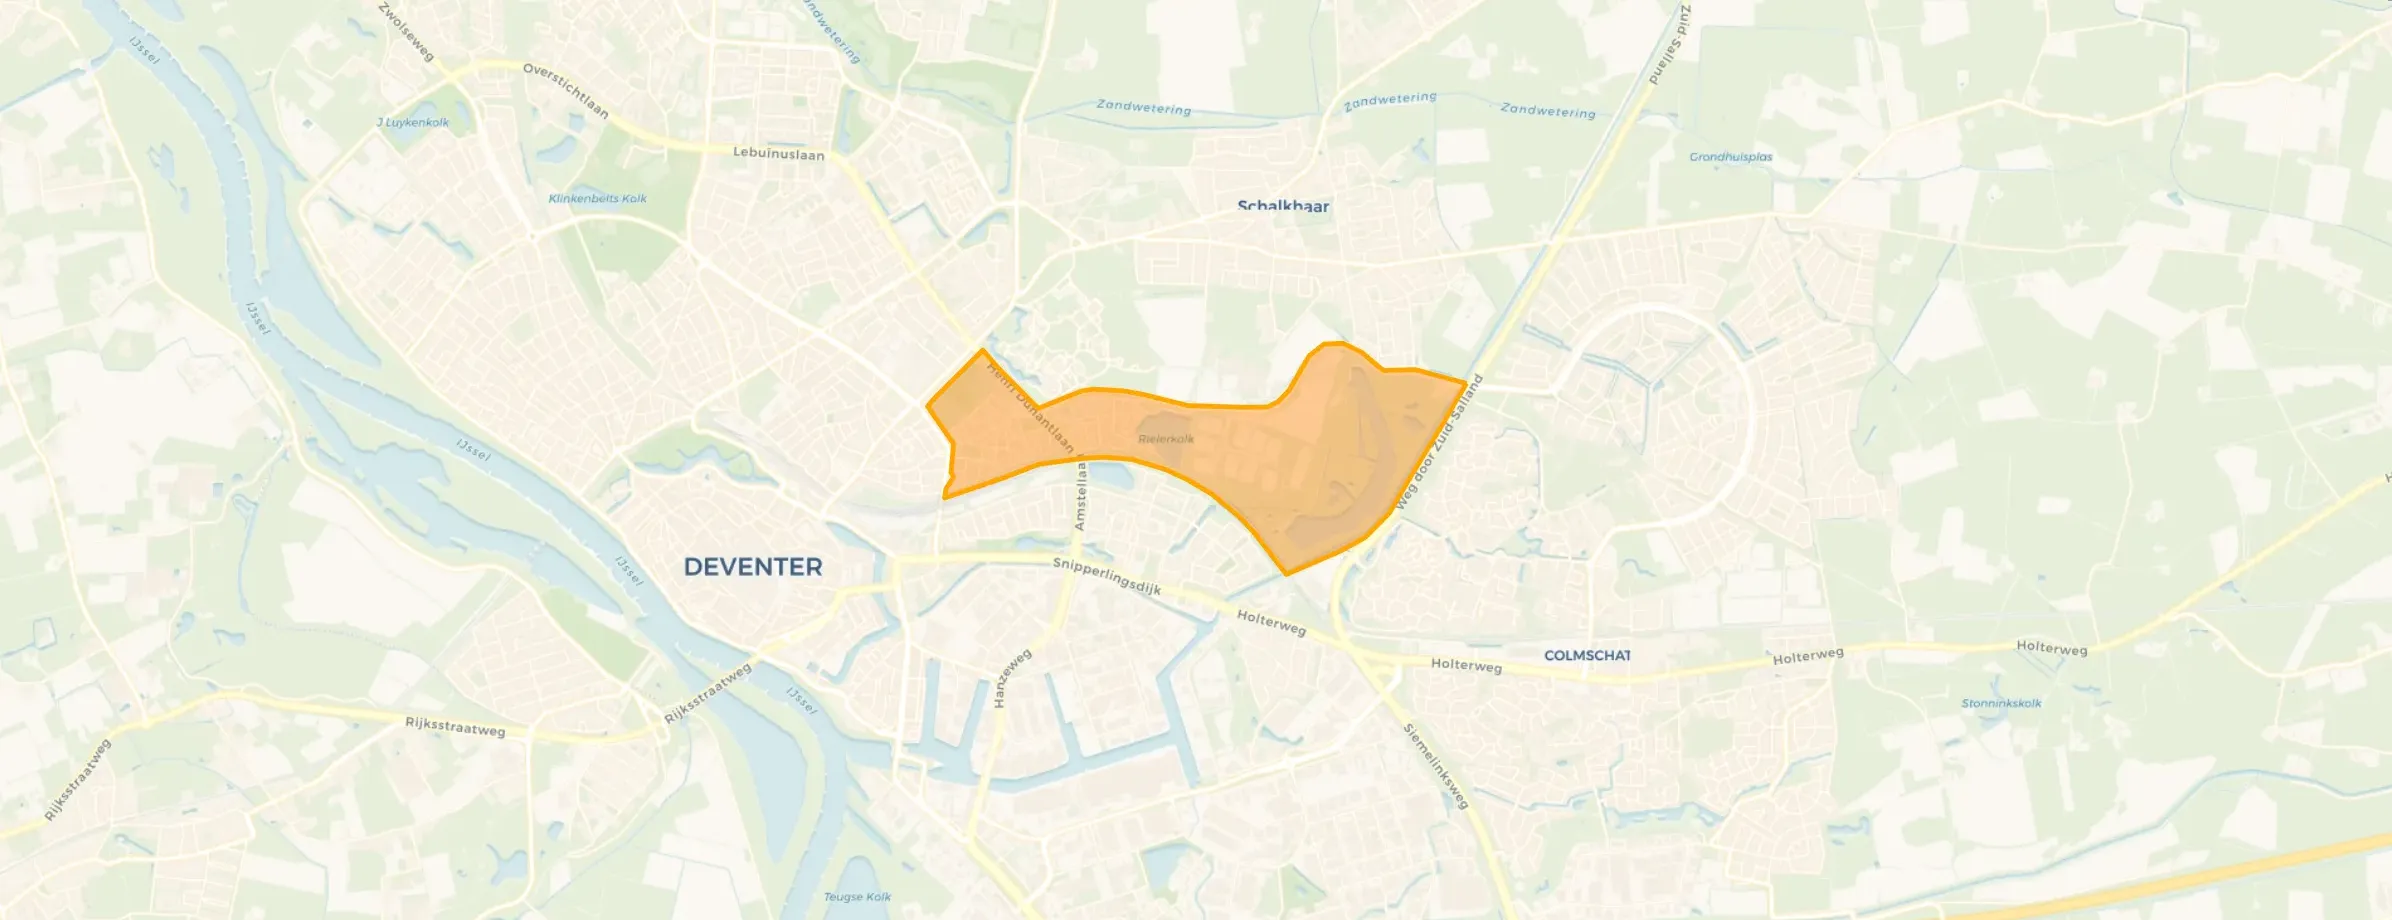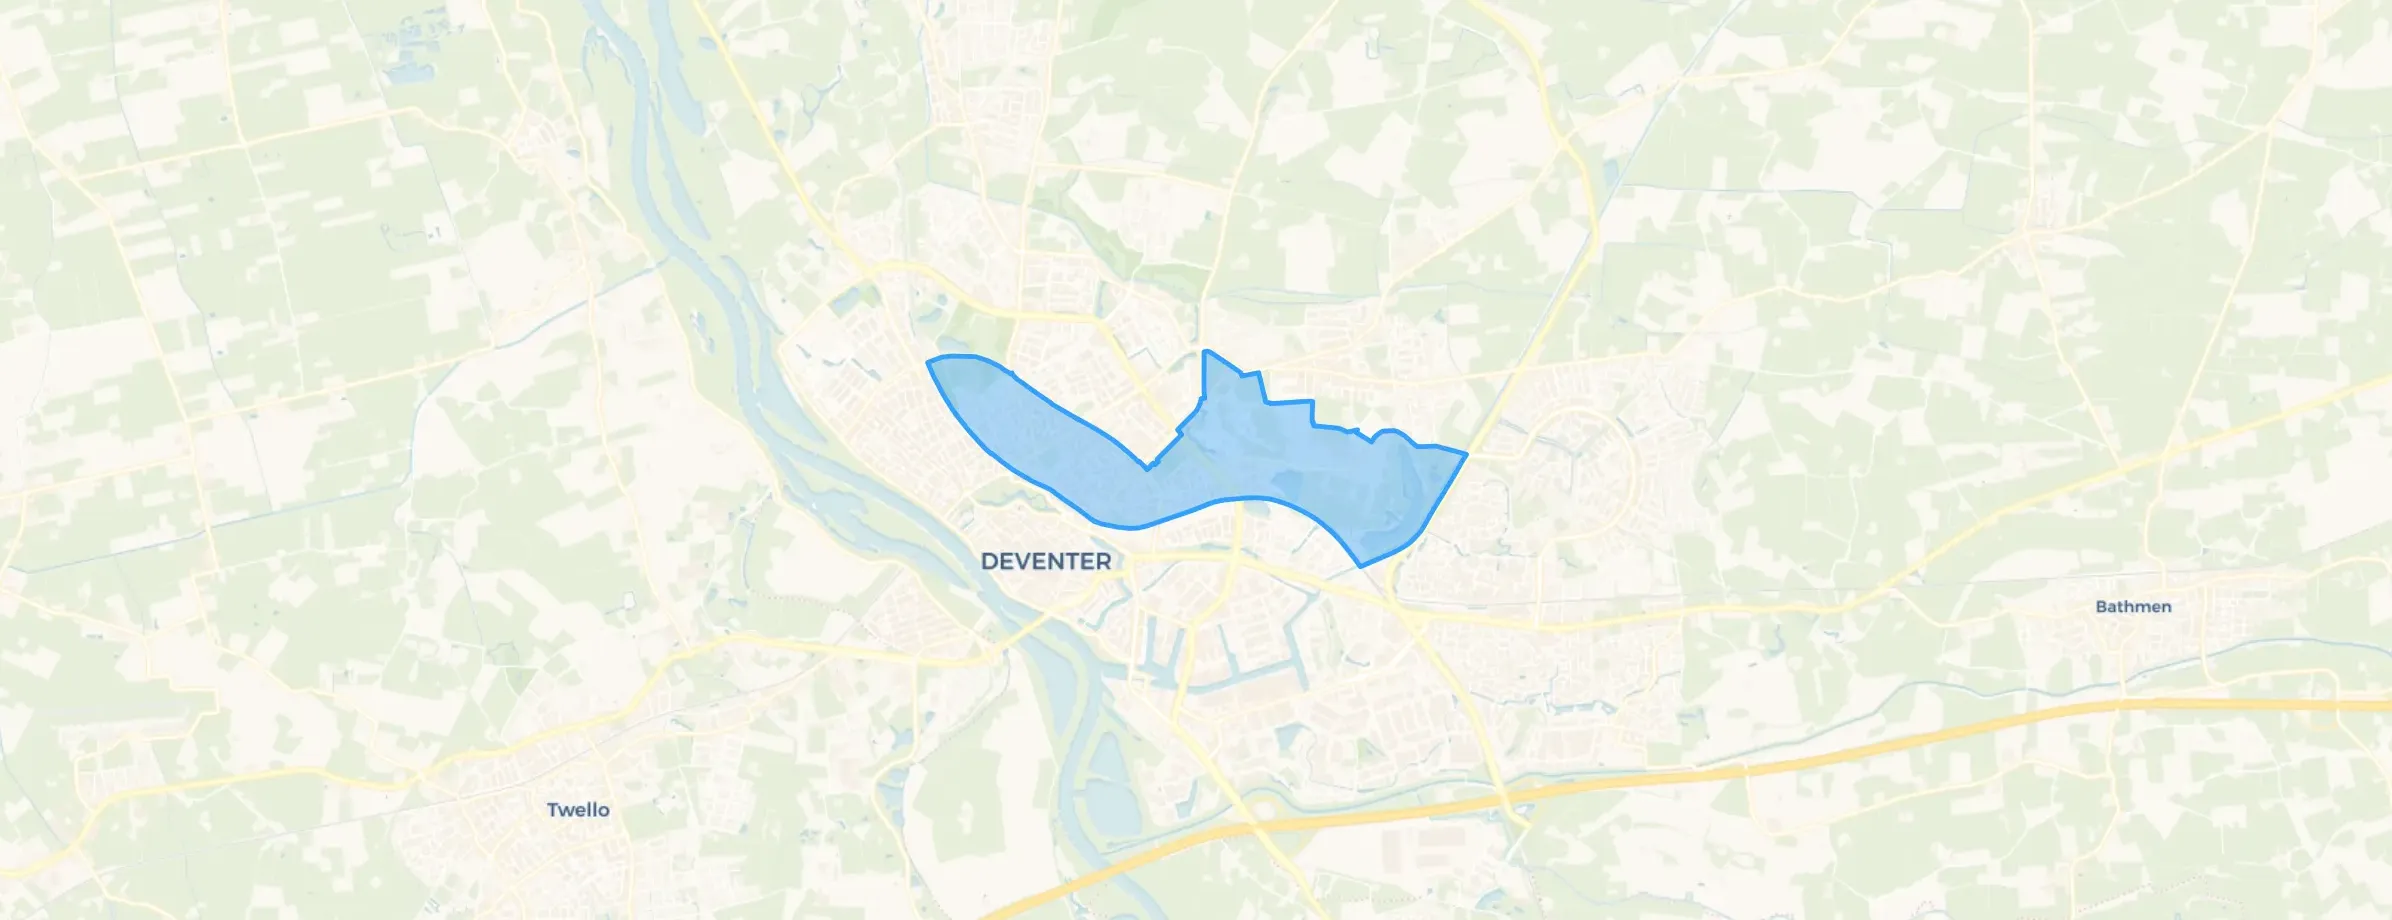
District in Deventer
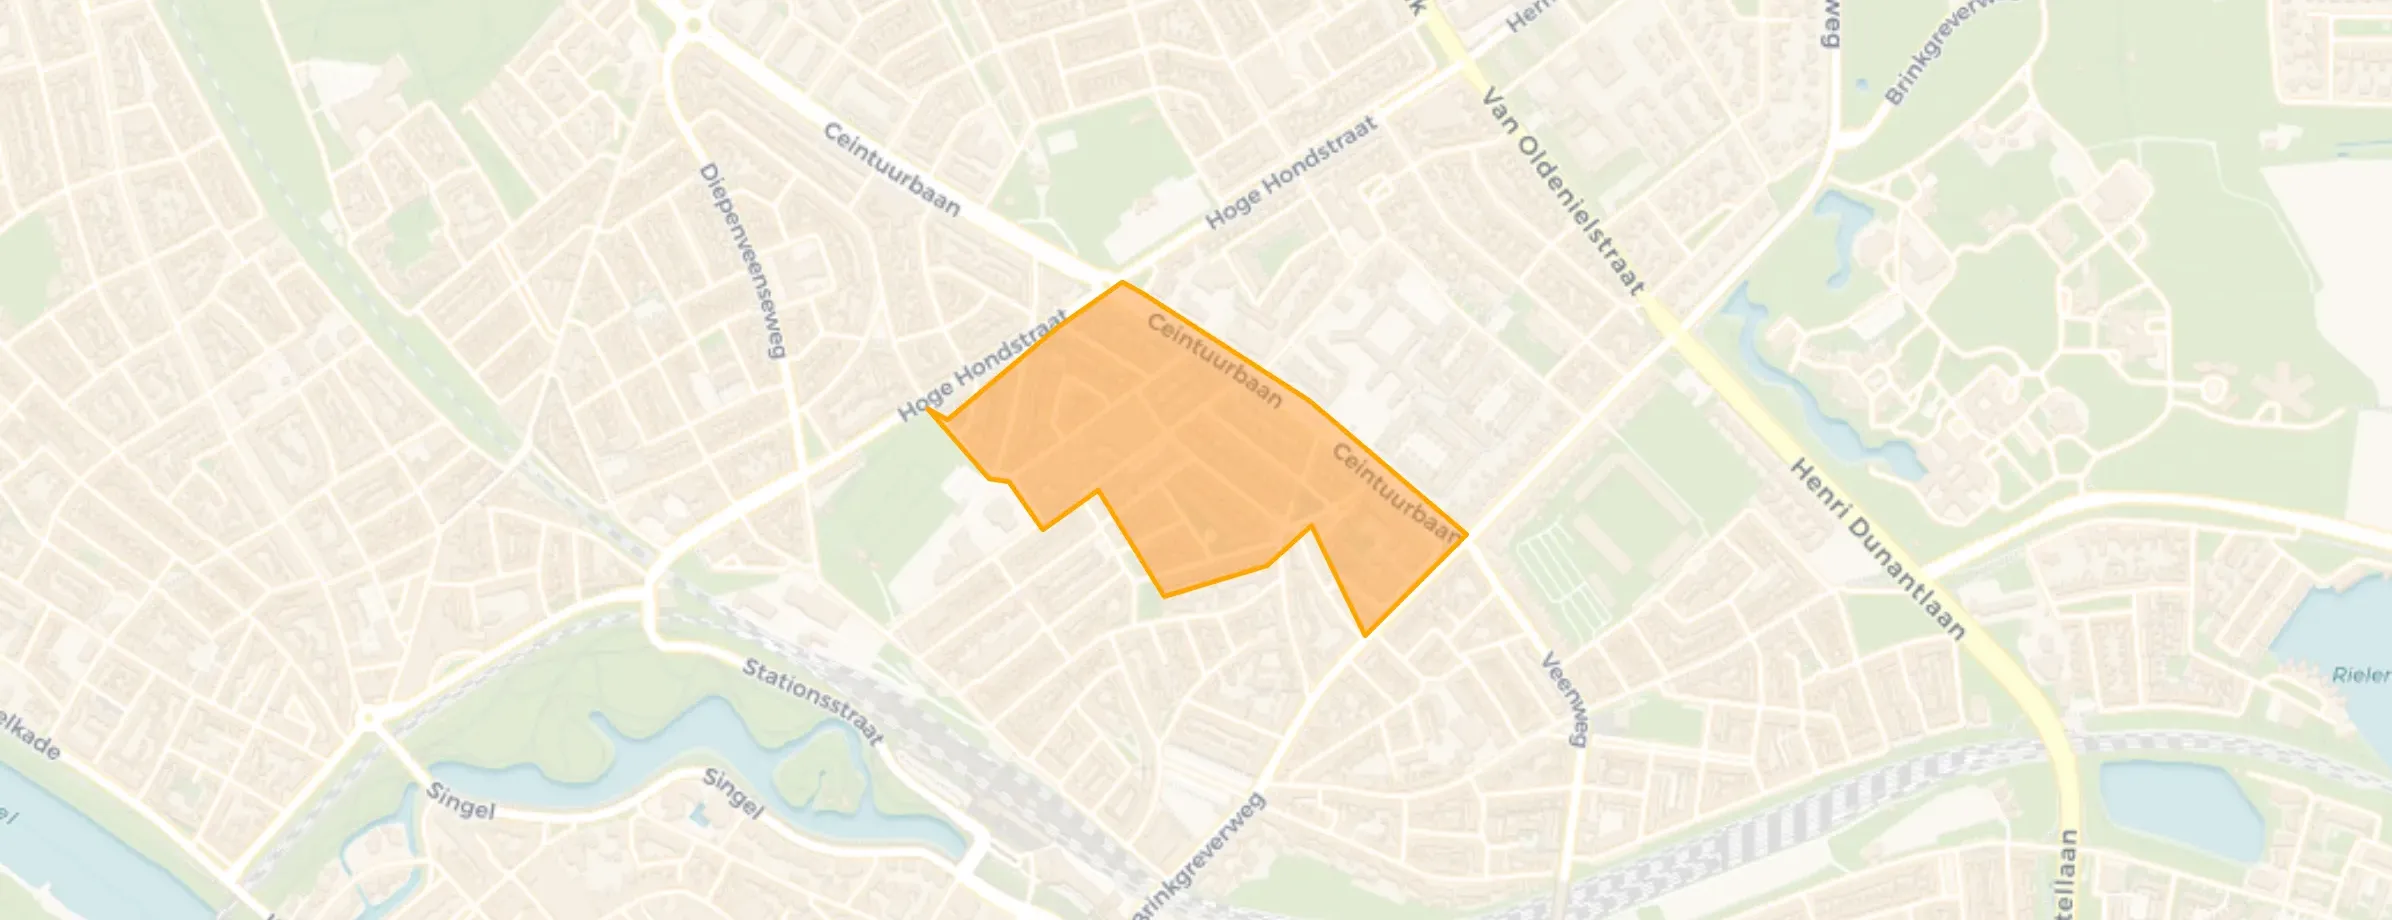
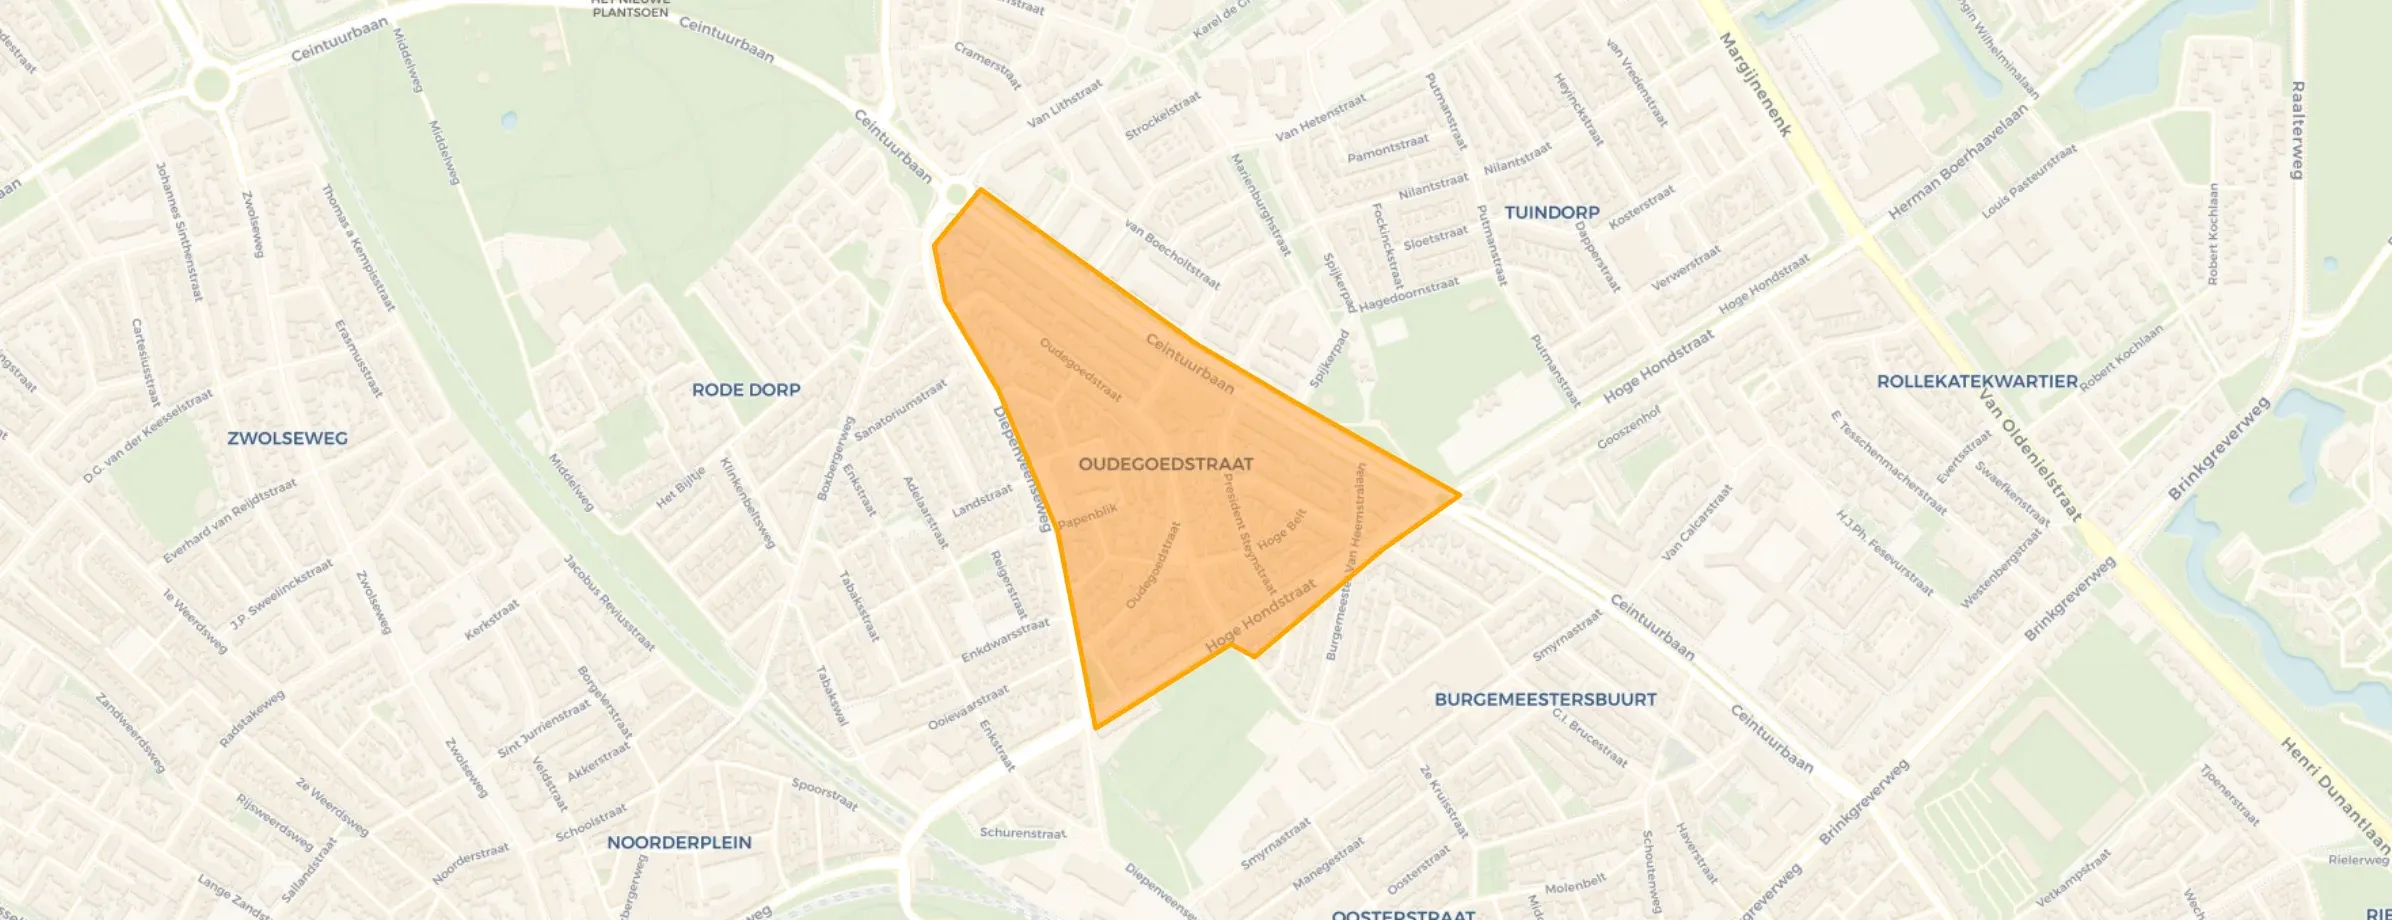
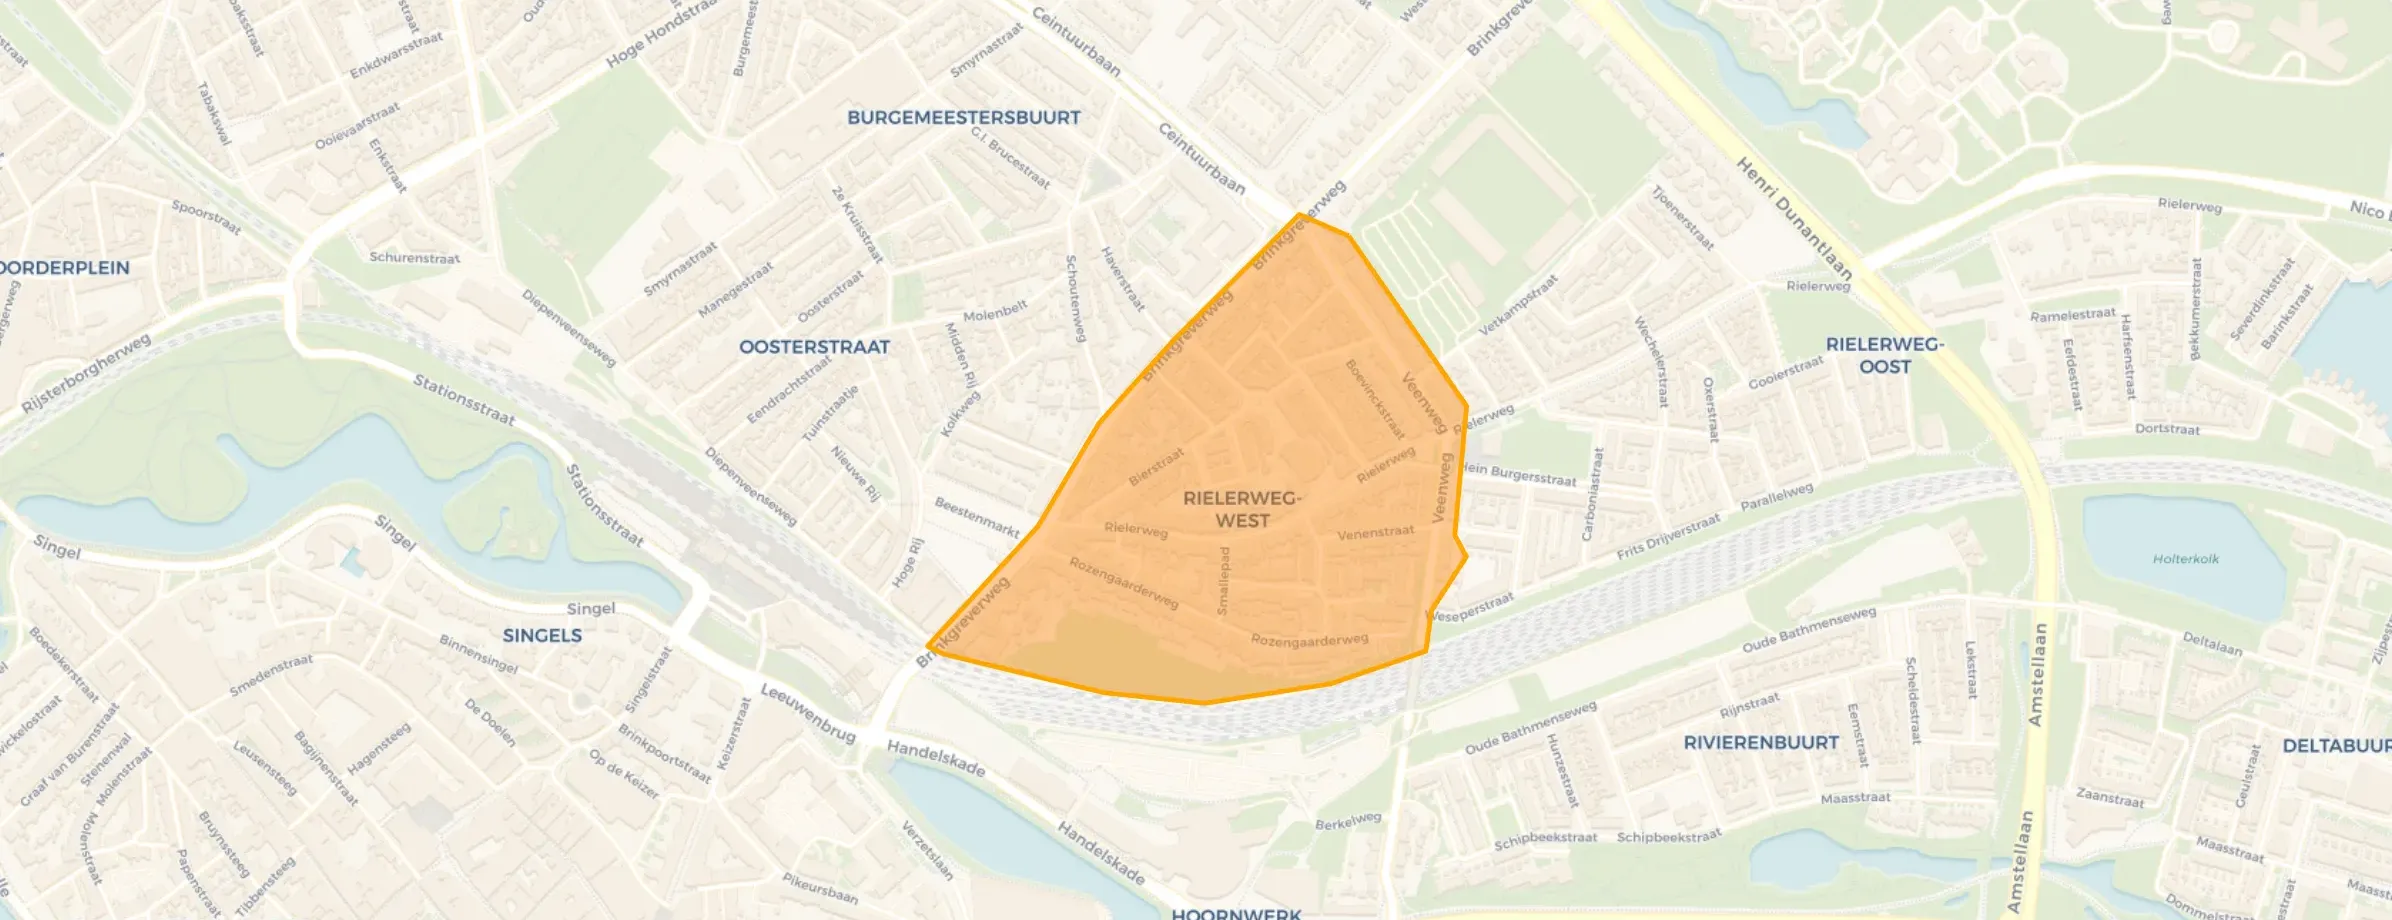
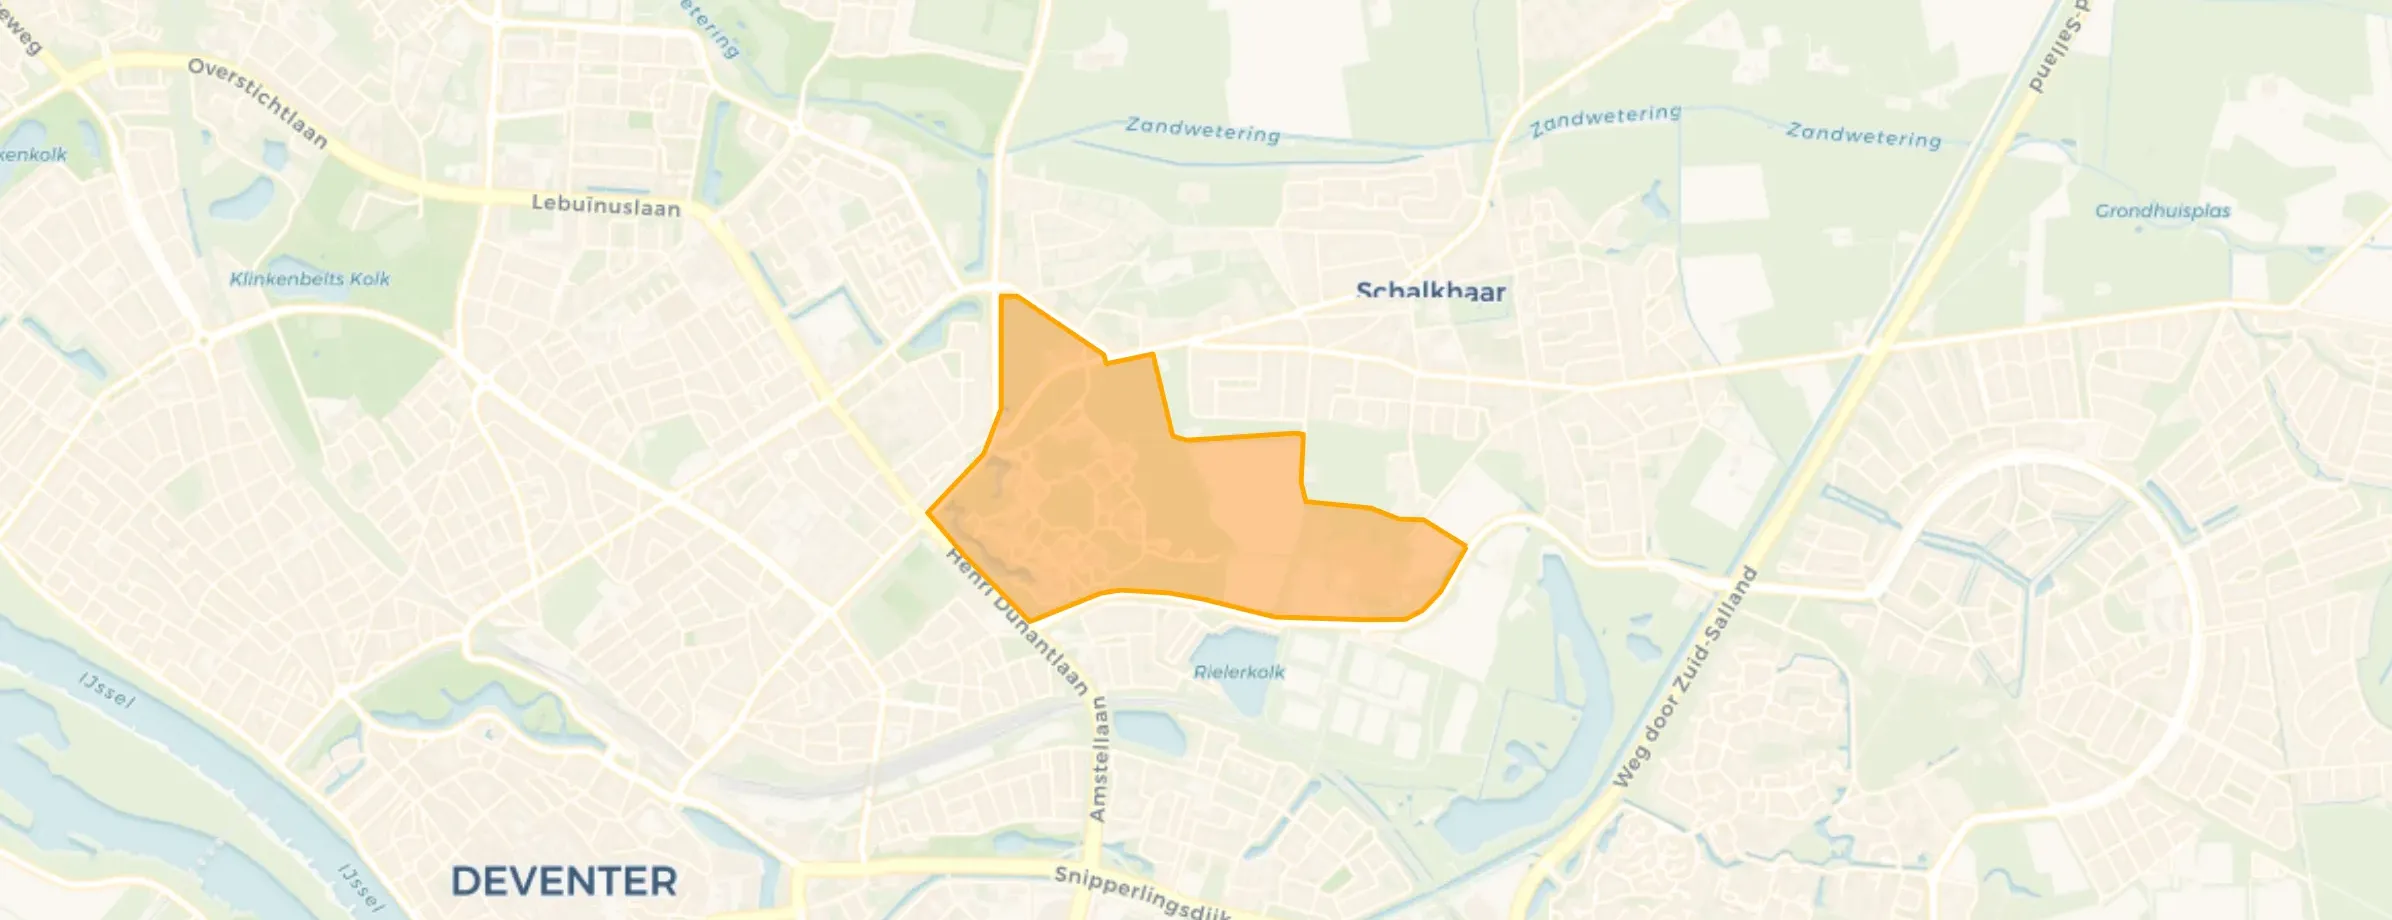
Voorstad is located in the province of Overijssel, in the municipality of Deventer The district has a total area of 306 hectares, of which 287 hectares are land and 18 hectares are water. The district is coded as WK015004. The postcode area is 7413AA-7416ZX.
Voorstad has 10.670 residents. Of these, 49,2% are men and 50,8% are women. Most residents are 25 to 45 years (31,3%). The other age groups are 27,2% for '45 to 65 years', 14,2% for '0 to 15 years', 13,9% for '15 to 25 years' and 13,4% for '65 years or older'. Of the residents, 59,4% is unmarried, 28,0% is married, 9,6% is divorced and 3,1% is widowed. 6.825 residents originate from the Netherlands, 990 come from Europe and 2.855 come from countries outside Europe.
There are 5.365 households in Voorstad. 47,6% of these are single-person households, 22,6% households without children and 29,7% households with children. The average household size is 1,9 persons. The national average is 2,1 persons.
In Voorstad there are 8.500 income recipients. The average income per income recipient is €35.800, which is €6.400 (15%) lower than the national average of €42.200. Per resident, the average income is €29.600, which is €5.300 (15%) lower than the national average of €34.900. Most residents of Voorstad are educated to an intermediate level. 35,3% have an intermediate education (HAVO, VWO or MBO 2-4), 34,3% have a lower education (VMBO or MBO 1) and 30,4% have a university or higher professional education (HBO/WO).
Of the 10.670 residents, around 67% are in paid employment, which amounts to 7.149 people. This is 5% lower than the national average of 72%. The majority of workers are in salaried employment (85%), while 15% are self-employed. In Voorstad, 26% of residents receive a benefit. The largest group is those receiving a state pension (AOW). 1.220 people receive this benefit.
In Voorstad there are 4.964 homes with an average assessed value (WOZ) of €292.000. Of these, around 96% are occupied and 4% unoccupied. In Voorstad there are roughly as many rental as owner-occupied homes. This amounts to 53% rental homes and 47% owner-occupied homes. Of the homes, 47% privately owned, 36% owned by housing associations and 17% owned by other landlords. The most common construction periods in Voorstad are 1925-1950 (30%) and 1900-1925 (24%).
There are currently no homes for sale in Voorstad. The most recently listed home is G.I. Brucestraat 44 by OpenDeur Deventer | NVM makelaar. No homes were sold in Voorstad over the past year.
There are currently no homes for rent in Voorstad. The most recent home is Van Haexbergenstraat 25, offered by www.woonkeus-stedendriehoek.nl. No homes were let in Voorstad over the past year.
No recent rental data available for Voorstad.
In Voorstad there are 3.615 addresses with a registered energy label. The most common labels are A (41%), B (16%) and C (13%). On average, an address in Voorstad uses 2.180 kWh of electricity per year. This is 15% below the national average of 2.550 kWh. Natural gas consumption, at 820 m³ per year, is 3% above the national average of 800 m³.
I haven't lived in this neighbourhood for very long yet. I've only been living in a new terraced house for a few years. But I like the neighbourhood.
Auto-translated to English by AII live on a fairly busy street, from there you drive into the city centre. There are many student houses and there is a square with supermarkets, a gym and a GP practice around the corner. The city centre is also a 10-minute walk away, which is ideal. My school is also a ten-minute walk away, making it easy to arrive on time and still get a bit of a lie-in. The neighbourhood itself is inhabited mainly by students, but also families and singles. The people come from diverse backgrounds and cultures, which gives the neighbourhood a cosy undertone; there is a lot of interaction and people talk to each other well.
Auto-translated to English by AIIt's a very nice neighbourhood, everyone is considerate of each other and there's never really any arguments or anything like that. Our neighbourhood is always cleaned up properly, for example after New Year's Eve everyone neatly cleans up their own mess. That way the neighbourhood stays nice and clean. Maybe a few more plants in my neighbourhood
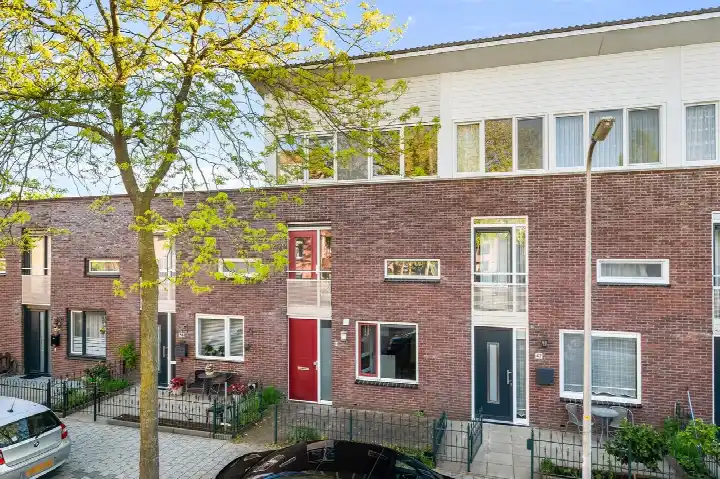
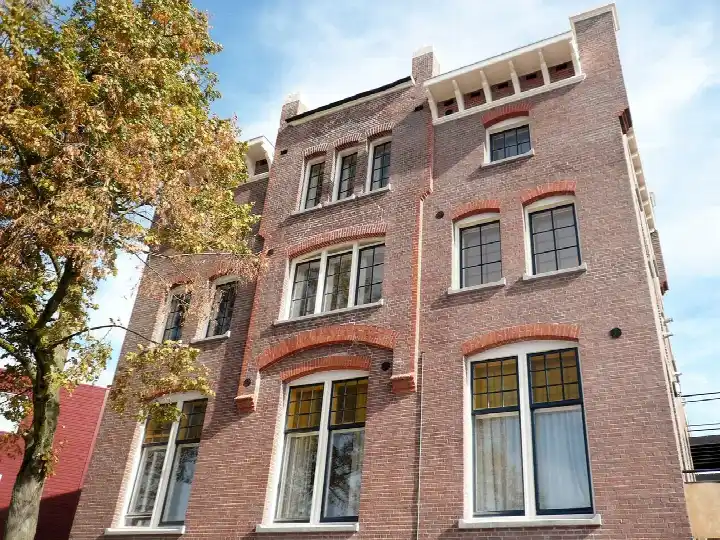
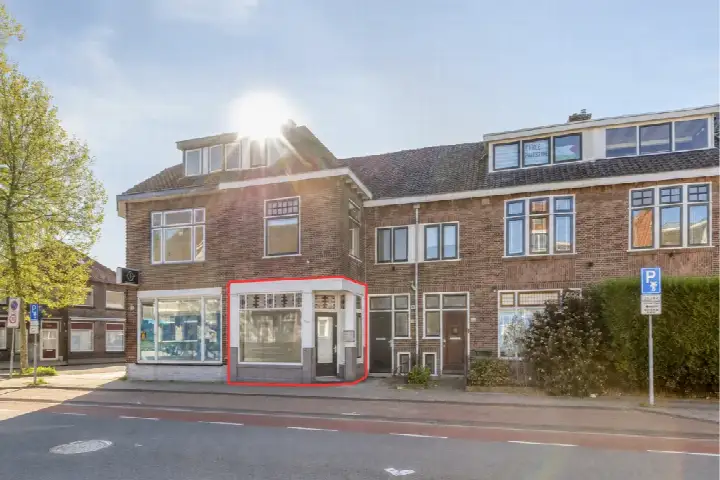
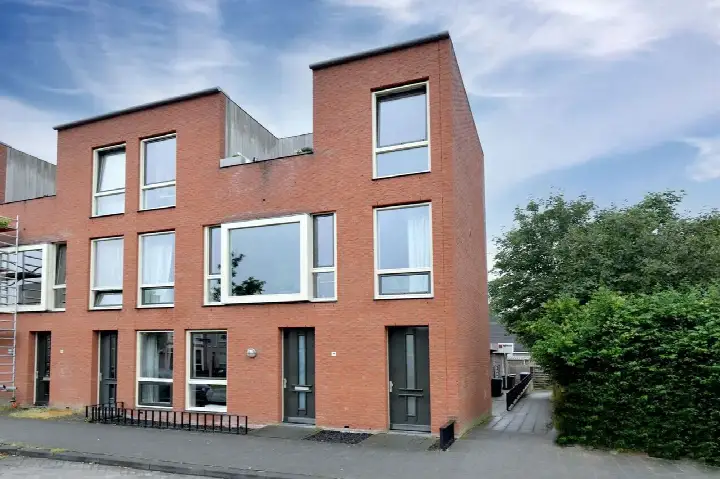
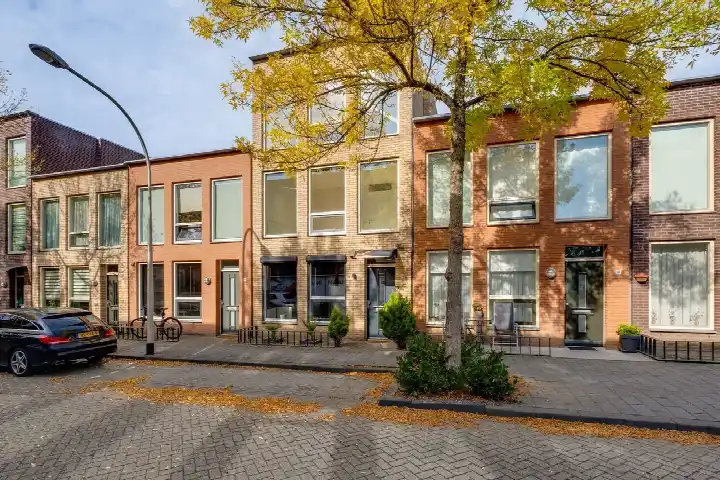
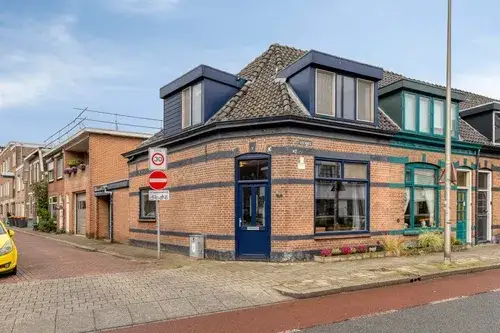
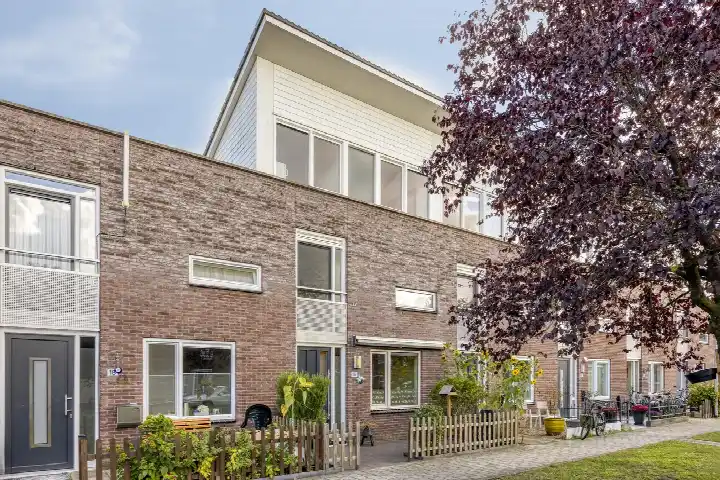
Auto-translated to English by AIThe housing stock is predominantly pre-war — 69% of the homes date from before 1945. In addition, the most common type is terraced houses (46%).
Over the past year a home for sale in Voorstad was listed for an average of €383,158 (€4,322 per m²). That is 27% below the Dutch national average.
A rental home in Voorstad cost an average of €1,378 per month (€15 per m²). That is 36% below the national average.
Residents give Voorstad a 7.1 out of 10 based on 3 reviews. The strongest score is for accessibility (9.0), the weakest for nature and greenery (5.0).
Wijk Voorstad has 10,670 residents. The largest age group is 25 to 45 years (31%).
From Voorstad you can on average reach a supermarket at 0.8 km, a GP at 0.8 km, a railway station at 1.3 km, a primary school at 0.7 km (as the crow flies, source: CBS).
Right now you will find 39 homes for sale and 4 homes for rent in Voorstad.