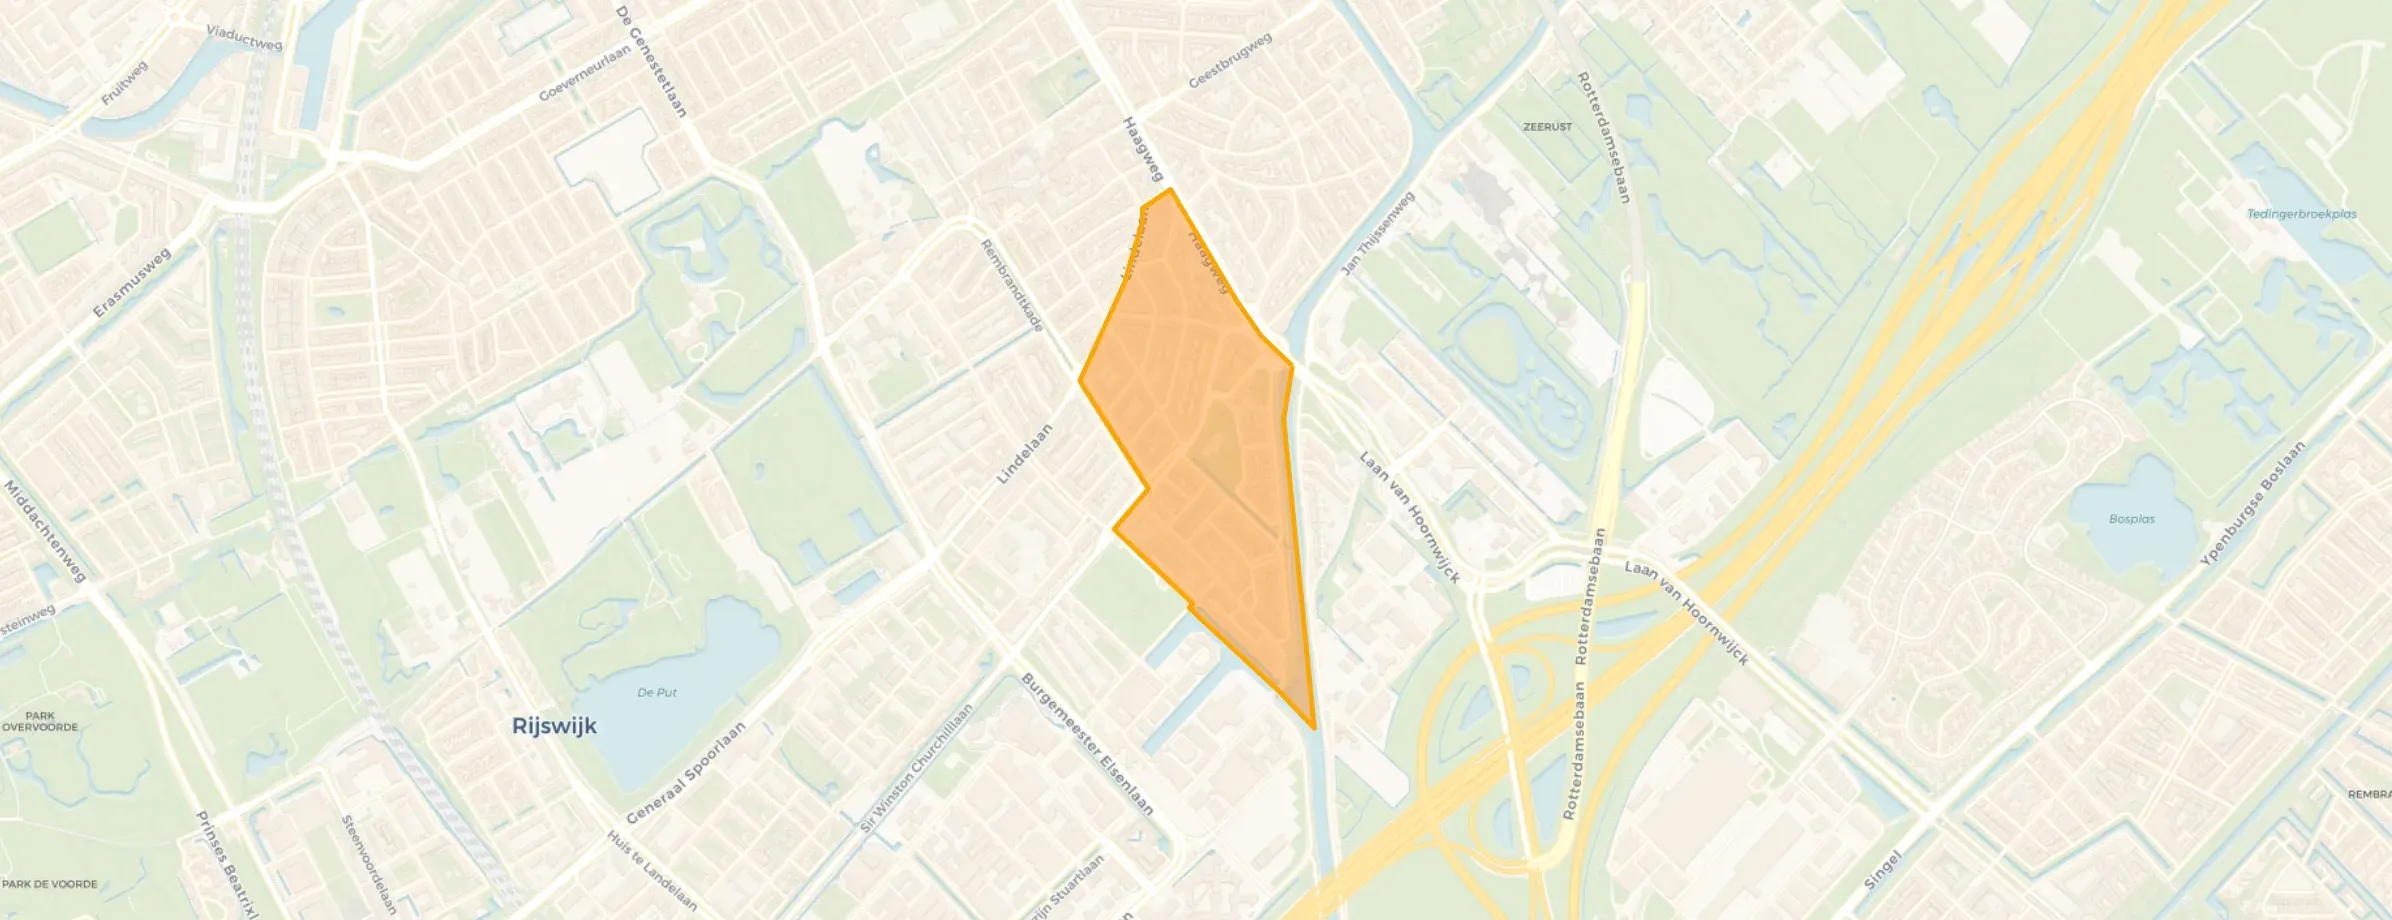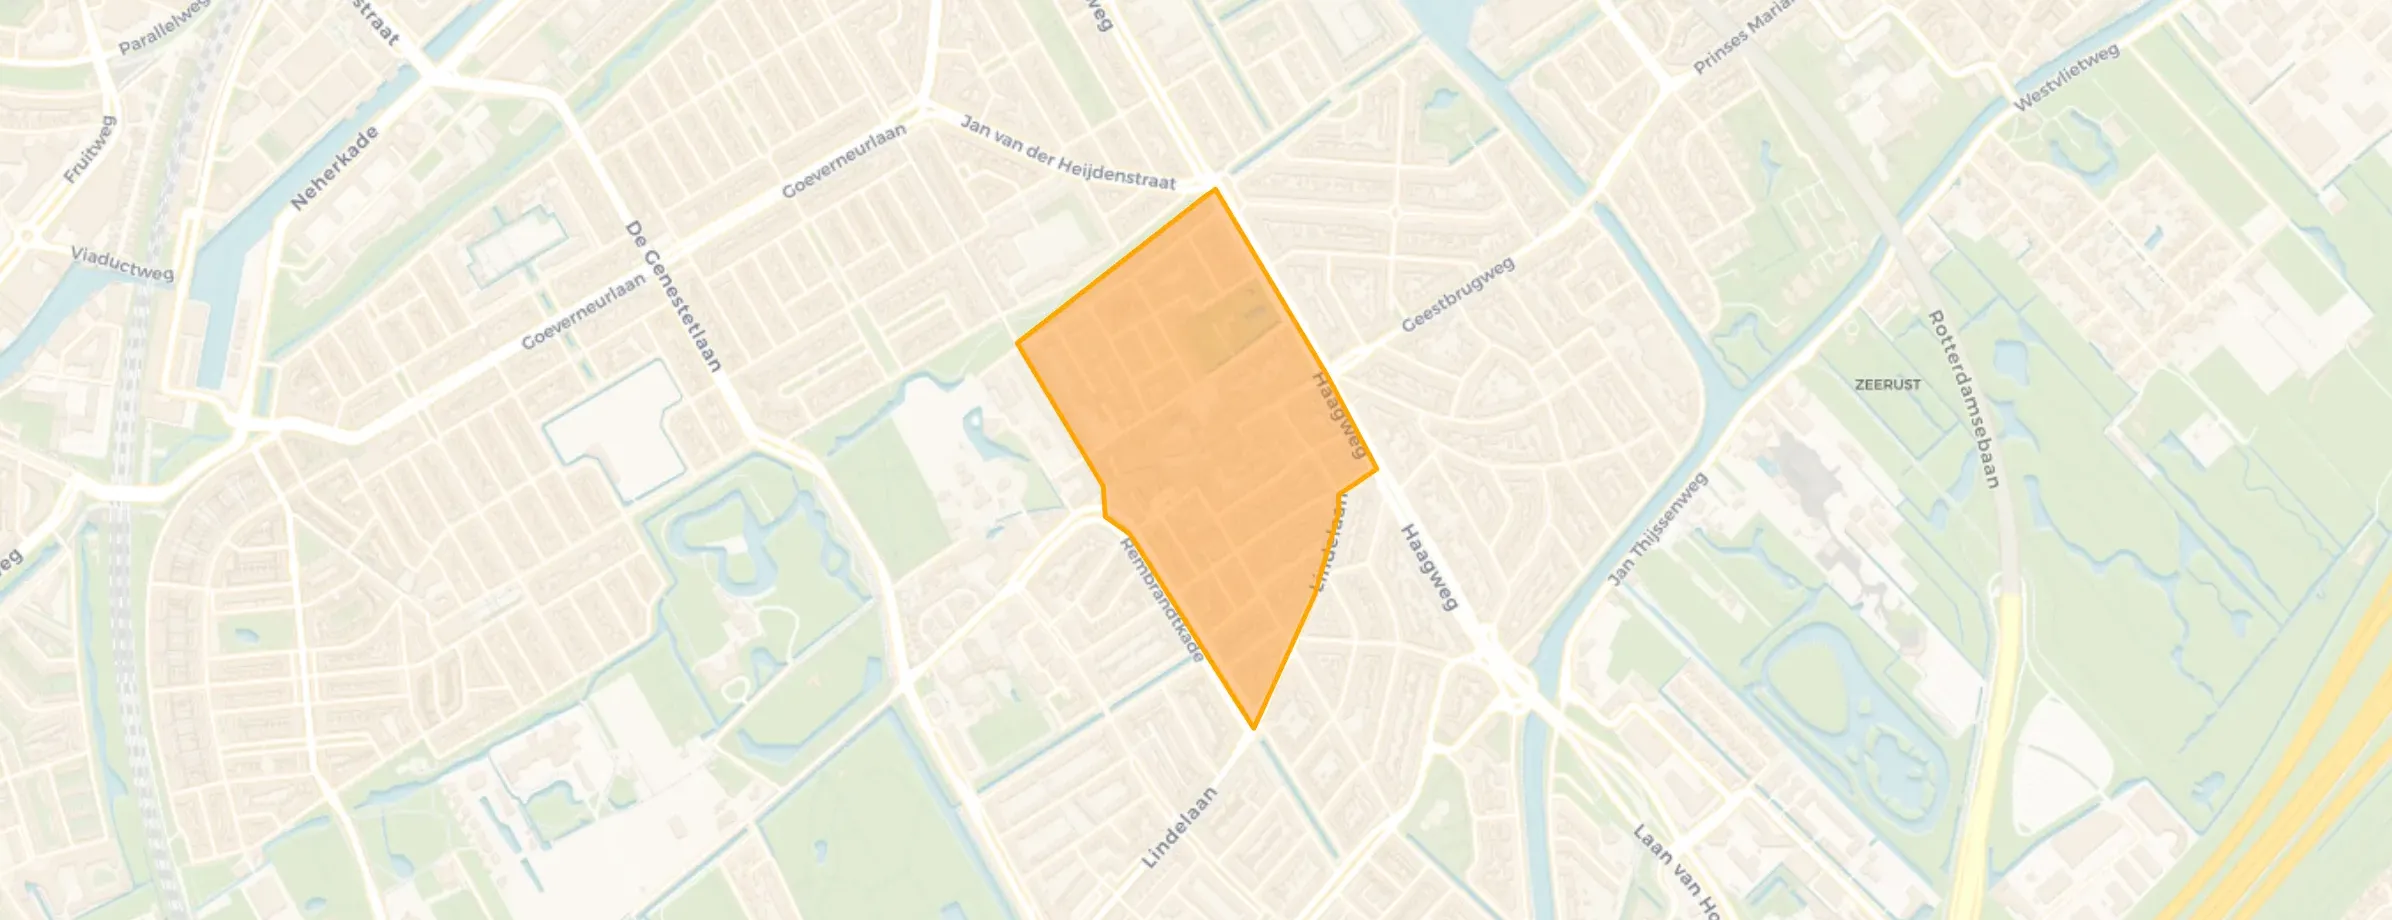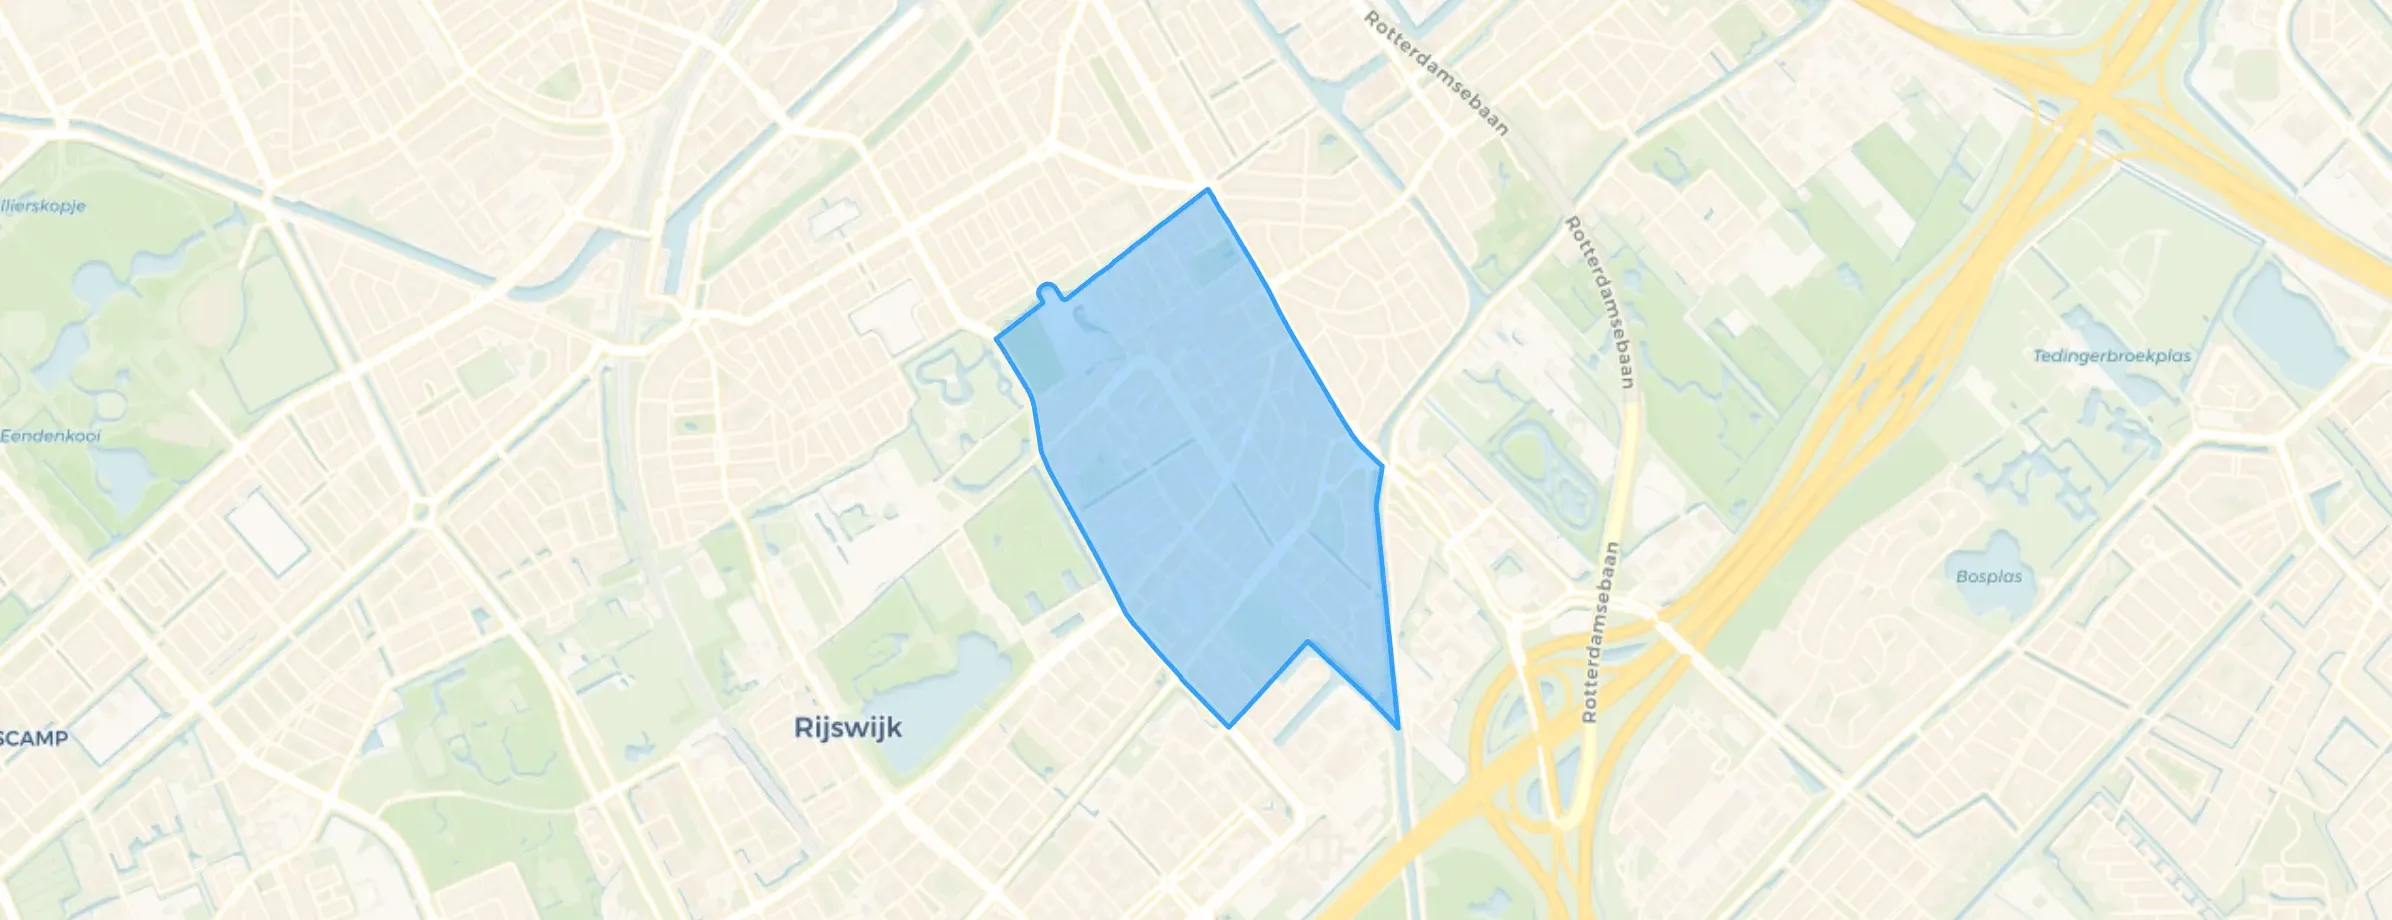
District in Rijswijk
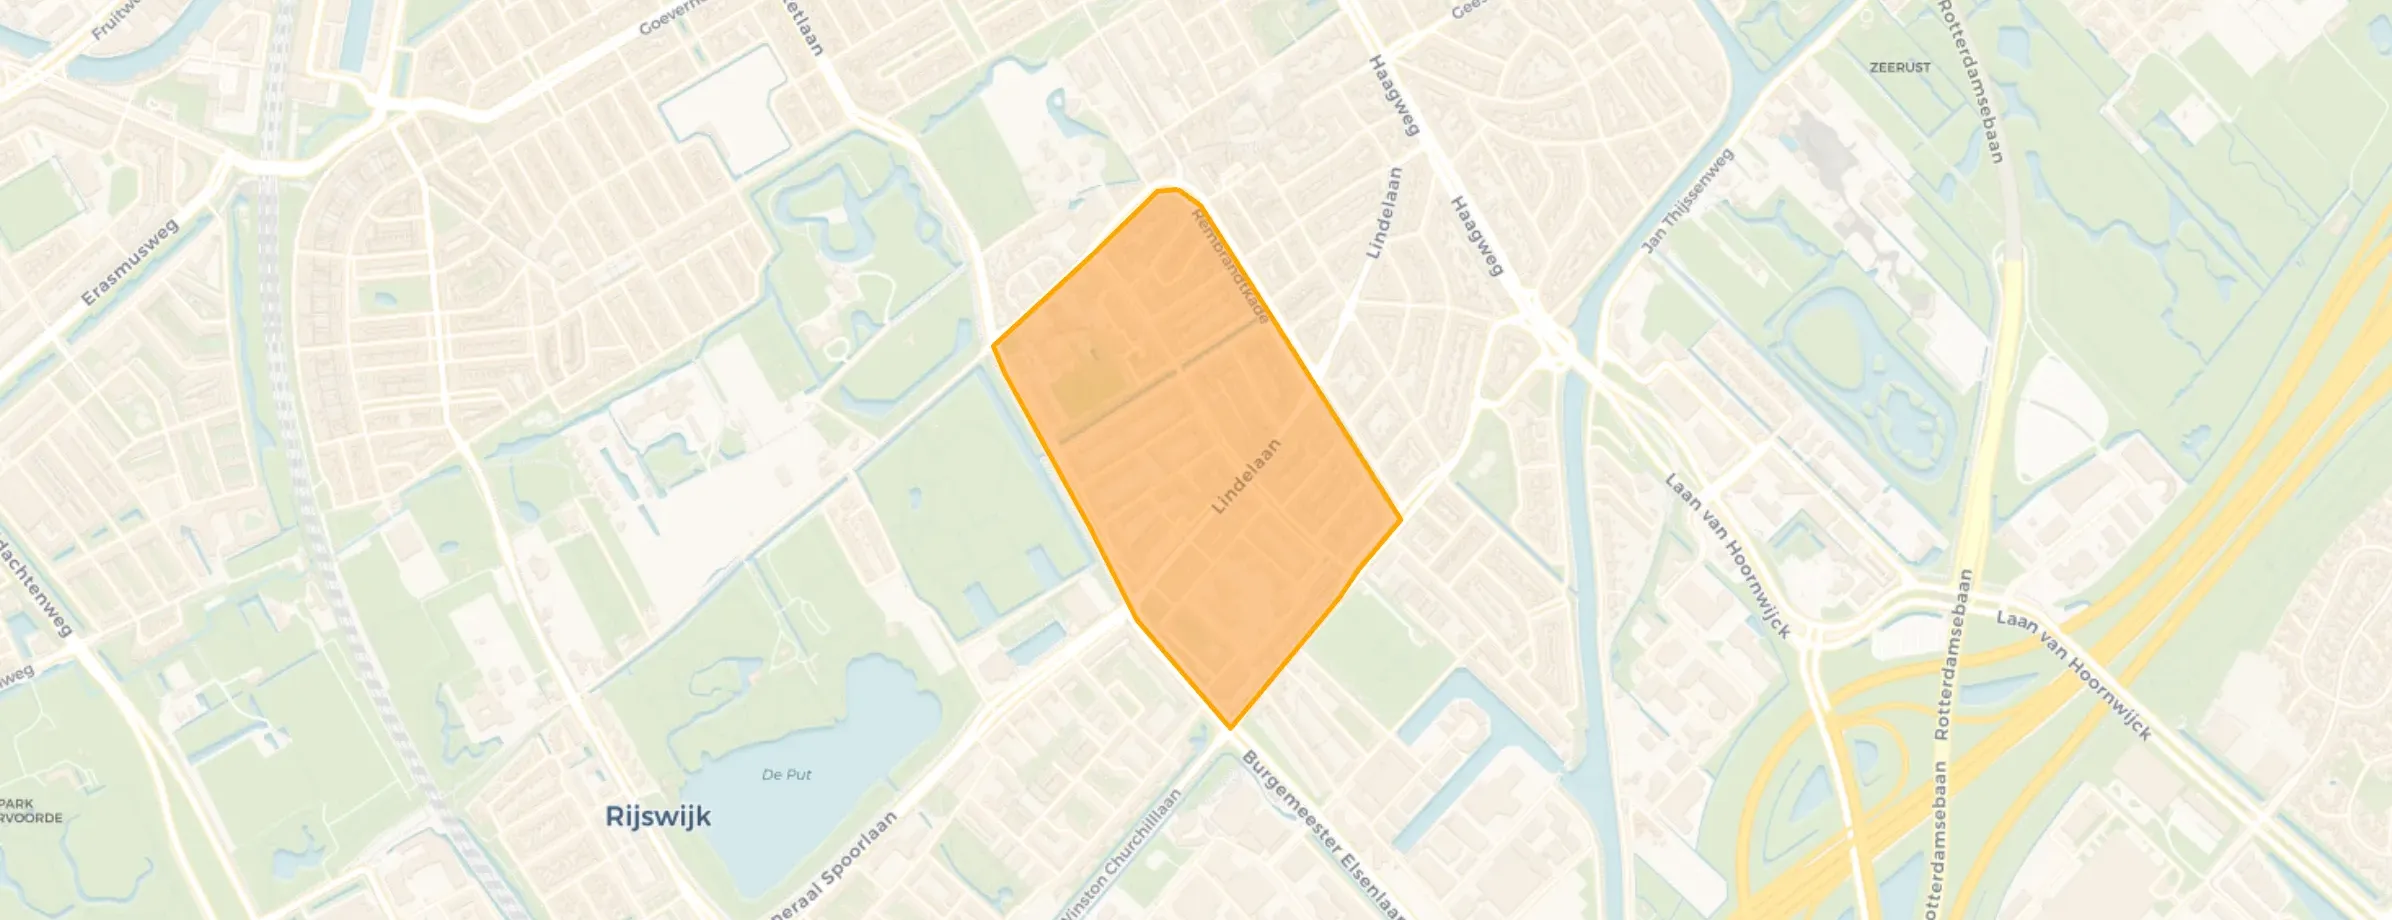
Wijk 02 is located in the province of Zuid-Holland, in the municipality of Rijswijk The district has a total area of 118 hectares, of which 116 hectares are land and 2 hectares are water. The district is coded as WK060302. The postcode area is 2282AA-2282XZ.
Wijk 02 has 10.440 residents. Of these, 48,6% are men and 51,4% are women. Most residents are 25 to 45 years (30,7%). The other age groups are 26,6% for '45 to 65 years', 19,3% for '65 years or older', 13,8% for '0 to 15 years' and 9,6% for '15 to 25 years'. Of the residents, 56,2% is unmarried, 28,7% is married, 10,2% is divorced and 4,8% is widowed. 6.410 residents originate from the Netherlands, 1.545 come from Europe and 2.490 come from countries outside Europe.
There are 5.505 households in Wijk 02. 48,2% of these are single-person households, 24,9% households without children and 26,9% households with children. The average household size is 1,9 persons. The national average is 2,1 persons.
In Wijk 02 there are 8.400 income recipients. The average income per income recipient is €45.700, which is €3.500 (8%) higher than the national average of €42.200. Per resident, the average income is €37.700, which is €2.800 (8%) higher than the national average of €34.900. Most residents of Wijk 02 are highly educated. 41,6% have a university or higher professional education (HBO/WO), 33,2% have an intermediate education (HAVO, VWO or MBO 2-4) and 25,2% have a lower education (VMBO or MBO 1).
Of the 10.440 residents, around 73% are in paid employment, which amounts to 7.621 people. This is 1% higher than the national average of 72%. The majority of workers are in salaried employment (83%), while 17% are self-employed. In Wijk 02, 24% of residents receive a benefit. The largest group is those receiving a state pension (AOW). 1.780 people receive this benefit.
In Wijk 02 there are 5.703 homes with an average assessed value (WOZ) of €323.000. Of these, around 95% are occupied and 5% unoccupied. In Wijk 02 there are roughly as many rental as owner-occupied homes. This amounts to 48% rental homes and 52% owner-occupied homes. Of the homes, 53% privately owned, 27% owned by housing associations and 20% owned by other landlords. The most common construction periods in Wijk 02 are 1950-1970 (45%) and 1900-1925 (20%).
There are currently no homes for sale in Wijk 02. The most recently listed home is Burgemeester Elsenlaan 113 by Wilburg Makelaars & Taxateurs op Funda. No homes were sold in Wijk 02 over the past year.
There are currently no homes for rent in Wijk 02. The most recent home is van Vredenburchplantsoen 22, offered by www.woonnet-haaglanden.nl. No homes were let in Wijk 02 over the past year.
No recent rental data available for Wijk 02.
In Wijk 02 there are 3.988 addresses with a registered energy label. The most common labels are C (32%), D (20%) and E (13%). On average, an address in Wijk 02 uses 1.980 kWh of electricity per year. This is 22% below the national average of 2.550 kWh. Natural gas consumption, at 810 m³ per year, is 1% above the national average of 800 m³.
Very bad, impoverished neighbourhood, junkies, antisocial people who throw their rubbish on the street and in communal gardens instead of in the bins, foreigners from Poland, Turkey, Africa, etc. and more. Send all these people back where they came from. This neighbourhood is getting worse and worse. There are also stolen bikes here. Few parking spaces, but too many trees on the street. I don't dare walk the streets in the evening. Enforcement officers should actually check every day/evening.
Auto-translated to English by AIQuiet neighbourhood close to shops and public transport, plenty of play areas for children. Lots of greenery in and around the neighbourhood.
Auto-translated to English by AIIt's a nice neighbourhood where you can easily make contact with neighbours. Good accessibility to the centre of The Hague and Rotterdam.
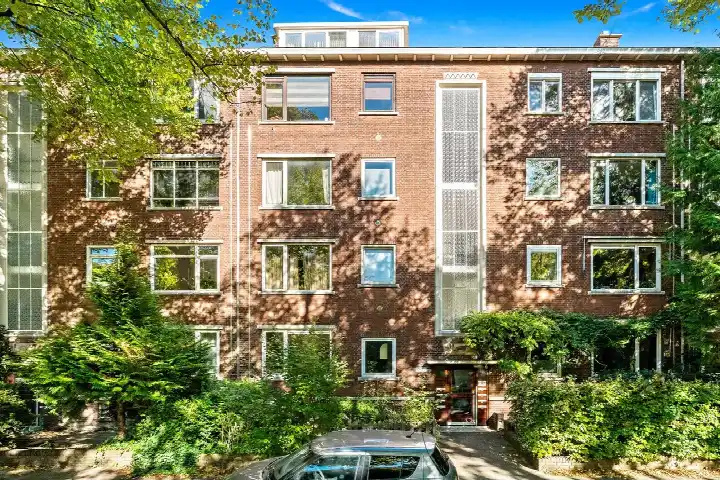
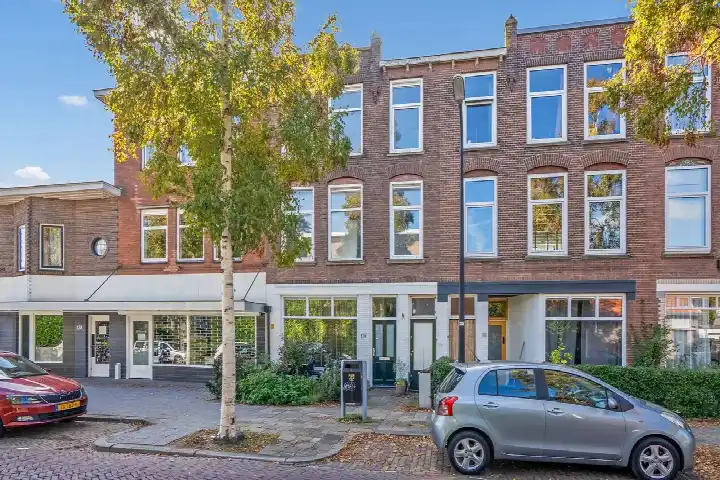
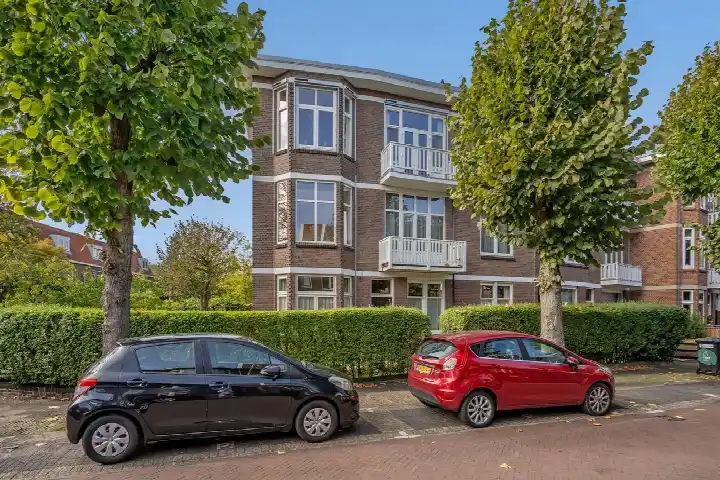
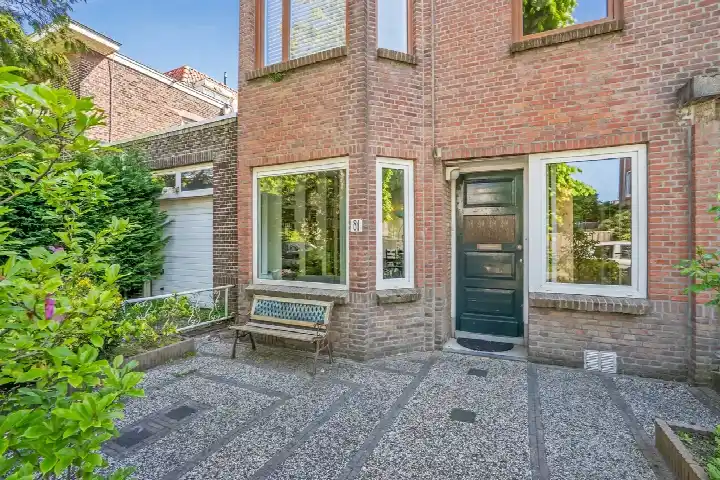
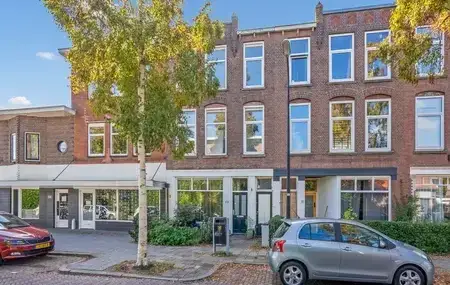
Auto-translated to English by AIThe housing stock is predominantly pre-war — 50% of the homes date from before 1945. In addition, the most common type is flats (78%).
Over the past year a home for sale in Wijk 02 was listed for an average of €436,806 (€4,516 per m²). That is 17% below the Dutch national average. Last quarter prices rose by 19%.
A rental home in Wijk 02 cost an average of €2,294 per month (€21 per m²).
Residents give Wijk 02 a 6.4 out of 10 based on 3 reviews. Especially accessibility (7.7) scores well; cleanliness (5.0) receives the lowest rating.
Wijk Wijk 02 has 10,440 residents. The largest age group is 25 to 45 years (31%).
A considerable share of the supply in Wijk 02 is less efficient: 26% has an E, F or G label. The average natural gas consumption per household is 810 m³ per year.
From Wijk 02 you can on average reach a supermarket at 0.5 km, a GP at 0.6 km, a railway station at 2.2 km, a primary school at 0.5 km (as the crow flies, source: CBS).
Right now you will find 141 homes for sale and 7 homes for rent in Wijk 02.