Municipality in Zuid-Holland
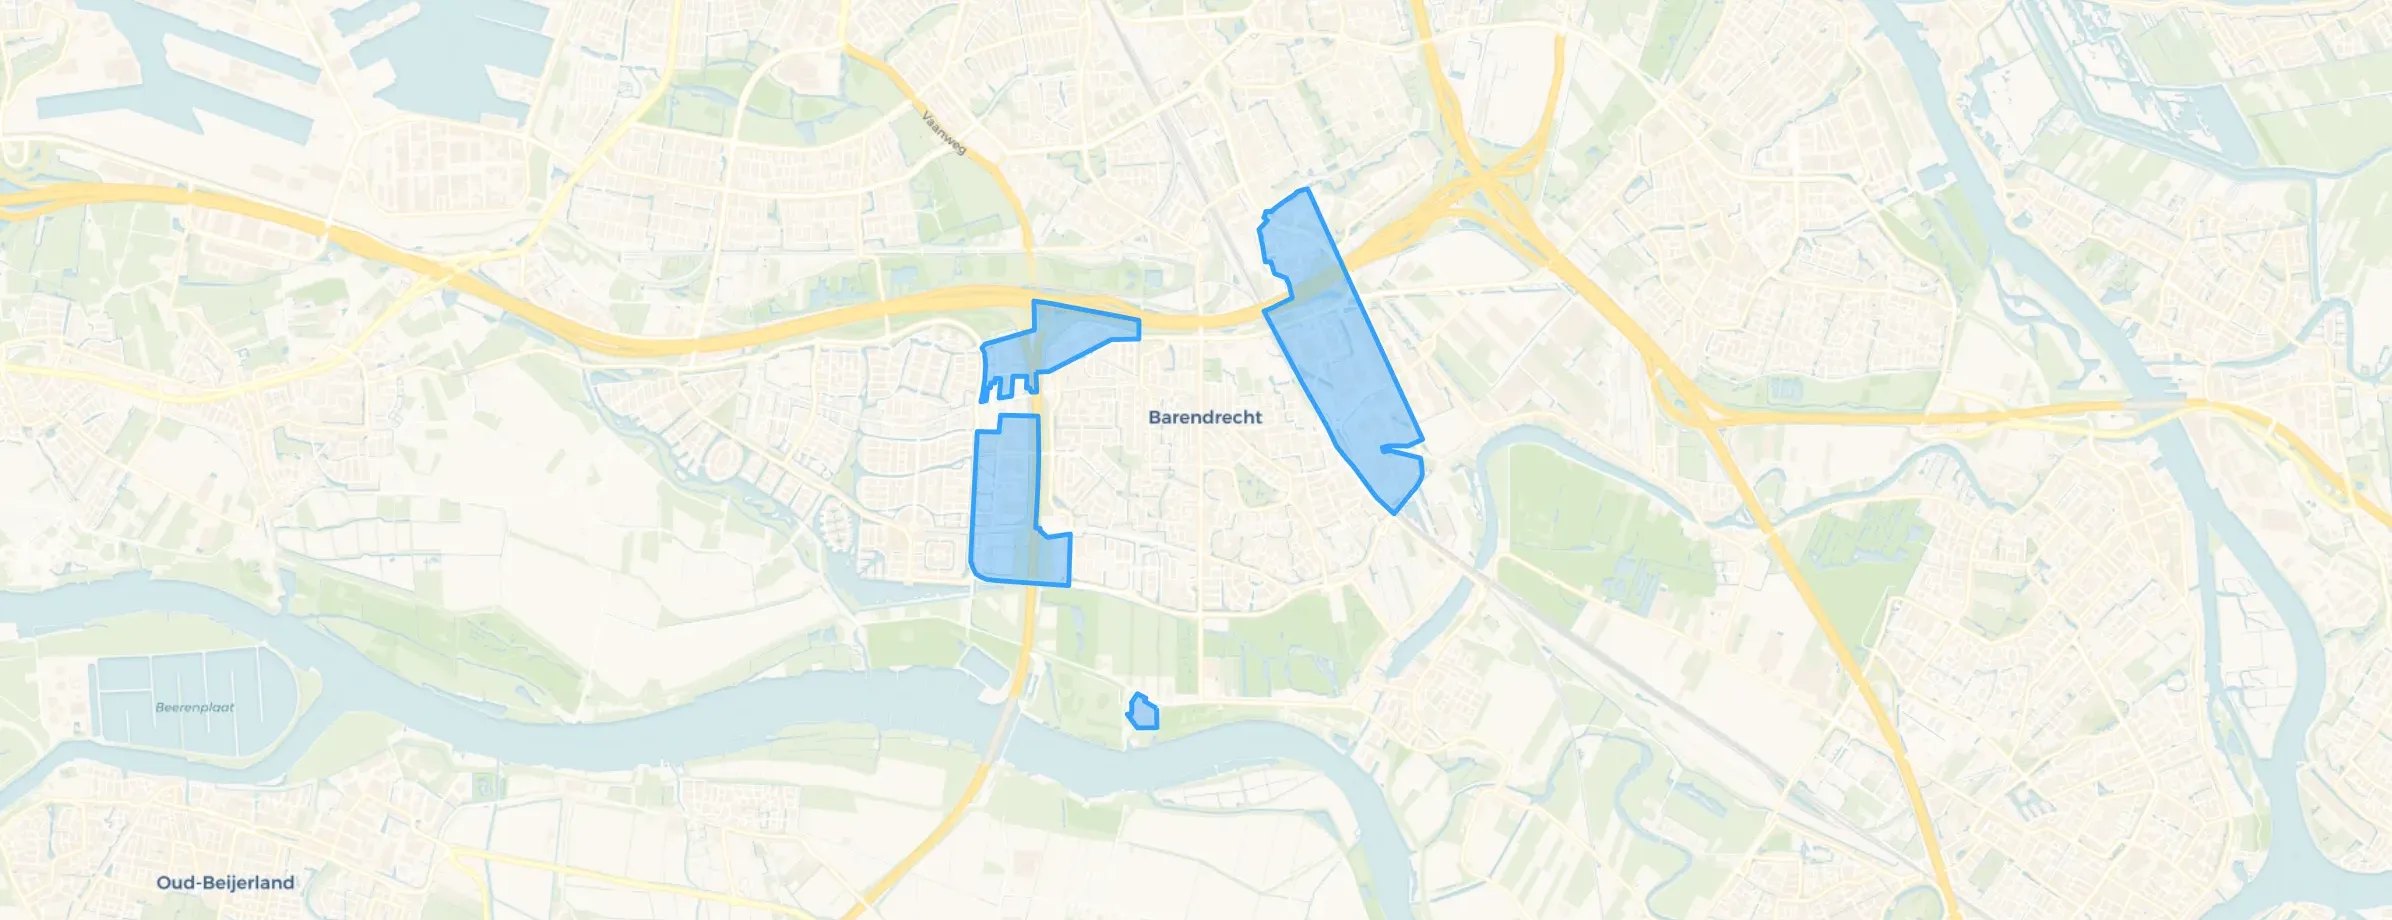
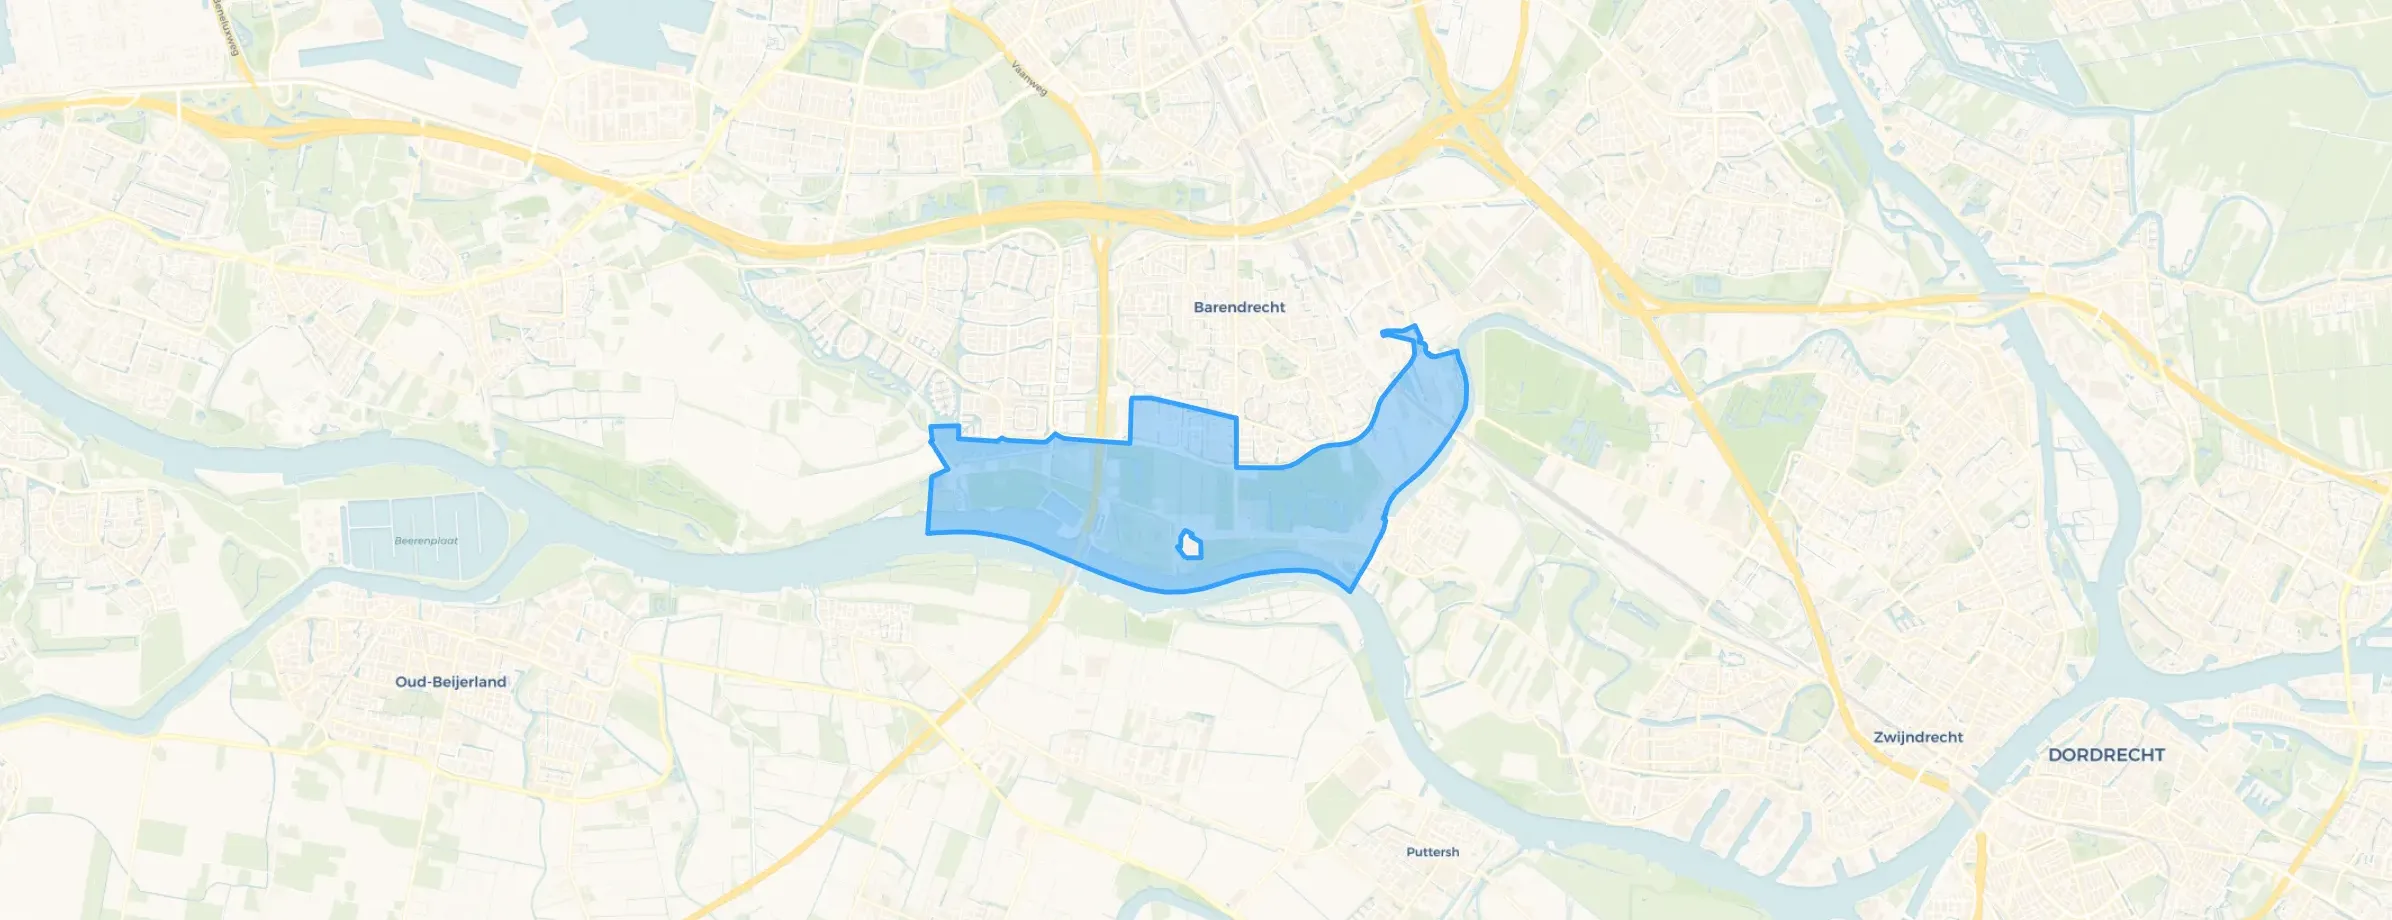
Barendrecht is located in the province of Zuid-Holland The municipality has a total area of 2.173 hectares, of which 1.958 hectares are land and 215 hectares are water. The municipality is coded as GM0489. The postcode area is 2991AA-2994LG.
Barendrecht has 48.550 residents. Of these, 49,1% are men and 50,9% are women. Most residents are 45 to 65 years (29,9%). The other age groups are 20,6% for '25 to 45 years', 20,1% for '65 years or older', 16,4% for '0 to 15 years' and 13,1% for '15 to 25 years'. Of the residents, 45,2% is unmarried, 43,3% is married, 6,9% is divorced and 4,5% is widowed. 33.881 residents originate from the Netherlands, 3.157 come from Europe and 11.512 come from countries outside Europe.
There are 19.719 households in Barendrecht. 27,2% of these are single-person households, 29,6% households without children and 43,2% households with children. The average household size is 2,4 persons. The national average is 2,1 persons.
In Barendrecht there are 38.800 income recipients. The average income per income recipient is €47.600, which is €5.400 (13%) higher than the national average of €42.200. Per resident, the average income is €38.400, which is €3.500 (10%) higher than the national average of €34.900. Most residents of Barendrecht are educated to an intermediate level. 42,8% have an intermediate education (HAVO, VWO or MBO 2-4), 33,0% have a university or higher professional education (HBO/WO) and 24,2% have a lower education (VMBO or MBO 1).
Of the 48.550 residents, around 74% are in paid employment, which amounts to 35.927 people. This is 2% higher than the national average of 72%. The majority of workers are in salaried employment (84%), while 16% are self-employed. In Barendrecht, 23% of residents receive a benefit. The largest group is those receiving a state pension (AOW). 8.720 people receive this benefit.
In Barendrecht there are 19.676 homes with an average assessed value (WOZ) of €447.000. Of these, around 98% are occupied and 2% unoccupied. Most homes are owner-occupied. This amounts to 30% rental homes and 70% owner-occupied homes. Of the homes, 70% privately owned, 21% owned by housing associations and 9% owned by other landlords. The most common construction periods in Barendrecht are 2000-2010 (35%) and 1990-2000 (22%).
There are currently no homes for sale in Barendrecht. The most recently listed home is De Zeeg 60 by Huysvisie, makelaar anno nu. op Funda. No homes were sold in Barendrecht over the past year.
There are currently no homes for rent in Barendrecht. The most recent home is Elandenburg 17, offered by VERRA Makelaars op Funda. No homes were let in Barendrecht over the past year.
No recent rental data available for Barendrecht.
In Barendrecht there are 13.328 addresses with a registered energy label. The most common labels are A (48%), B (20%) and C (12%). On average, an address in Barendrecht uses 2.770 kWh of electricity per year. This is 9% above the national average of 2.550 kWh. With an annual consumption of 760 m³ per address, natural gas consumption is 5% below the national average of 800 m³.
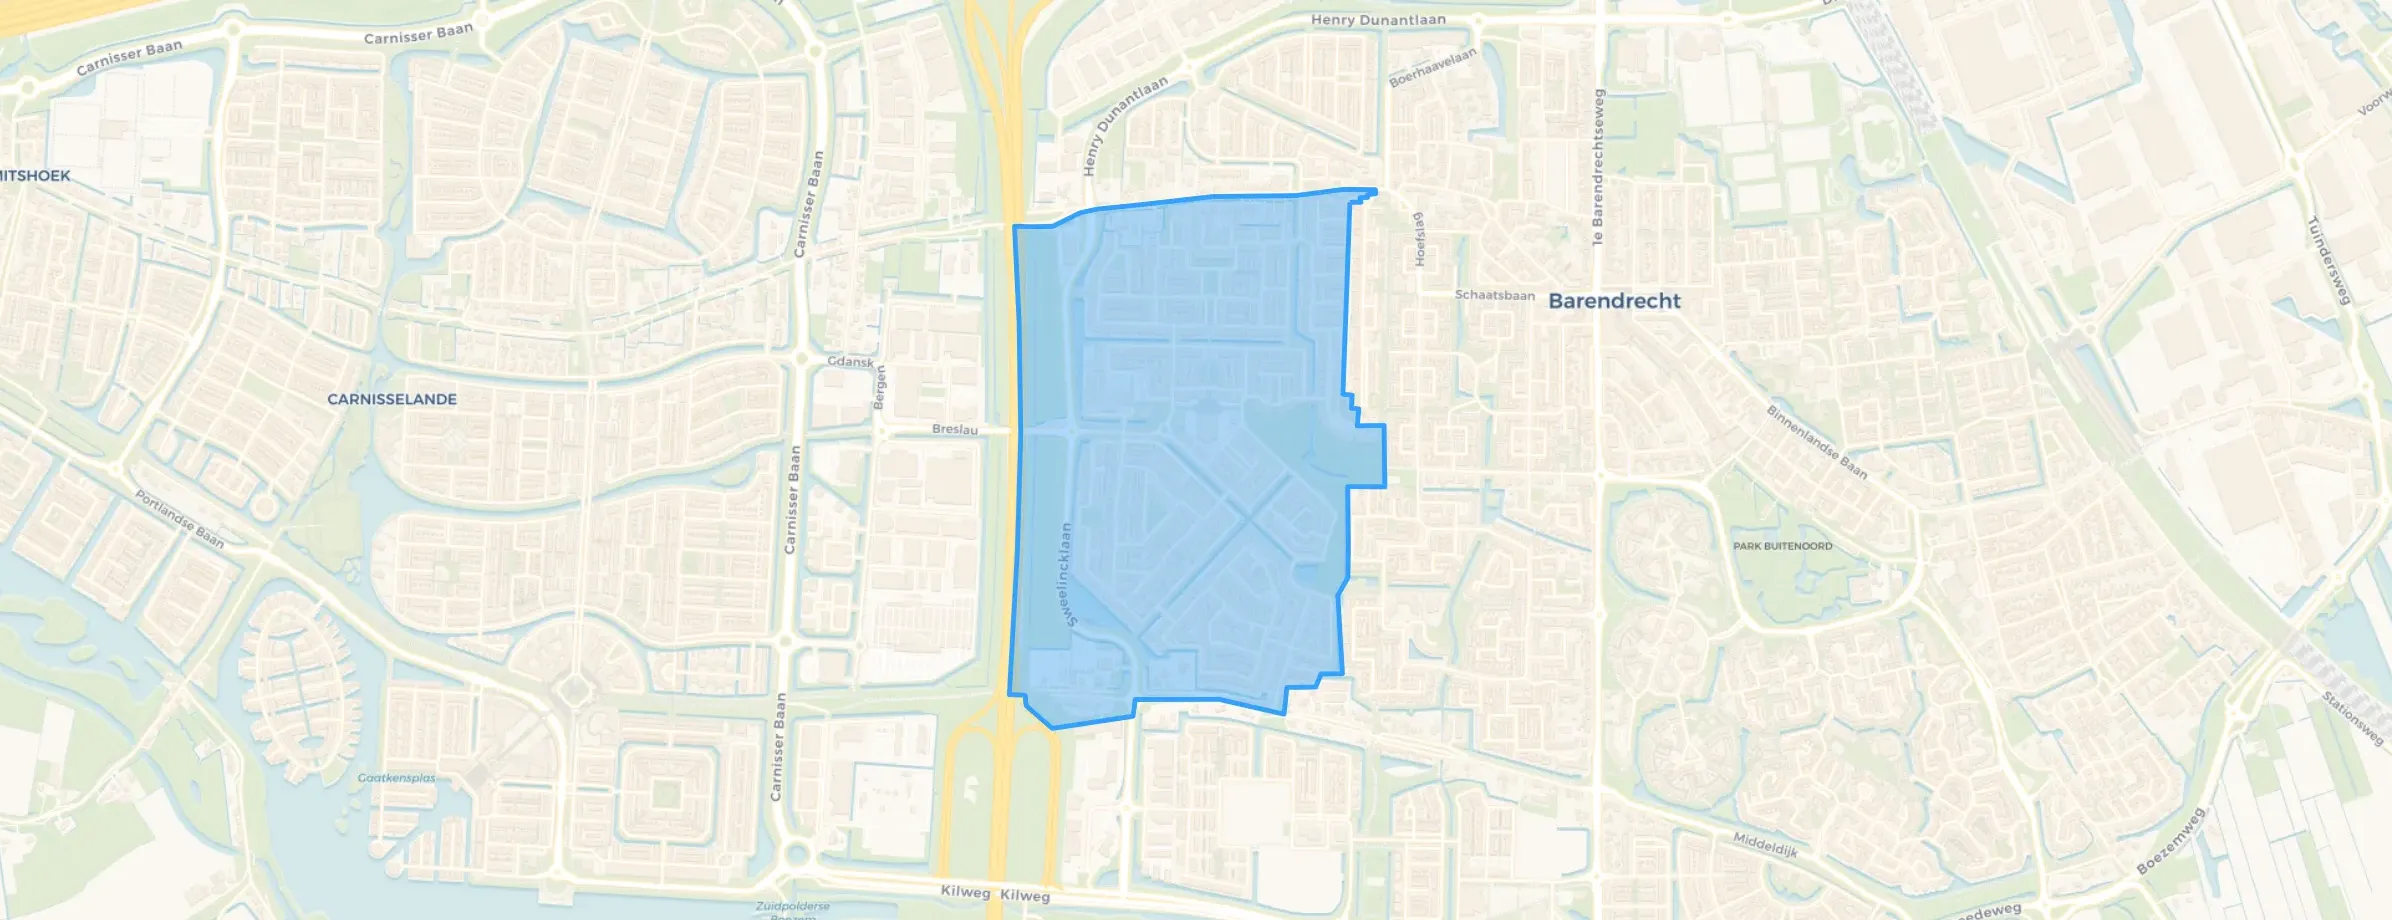
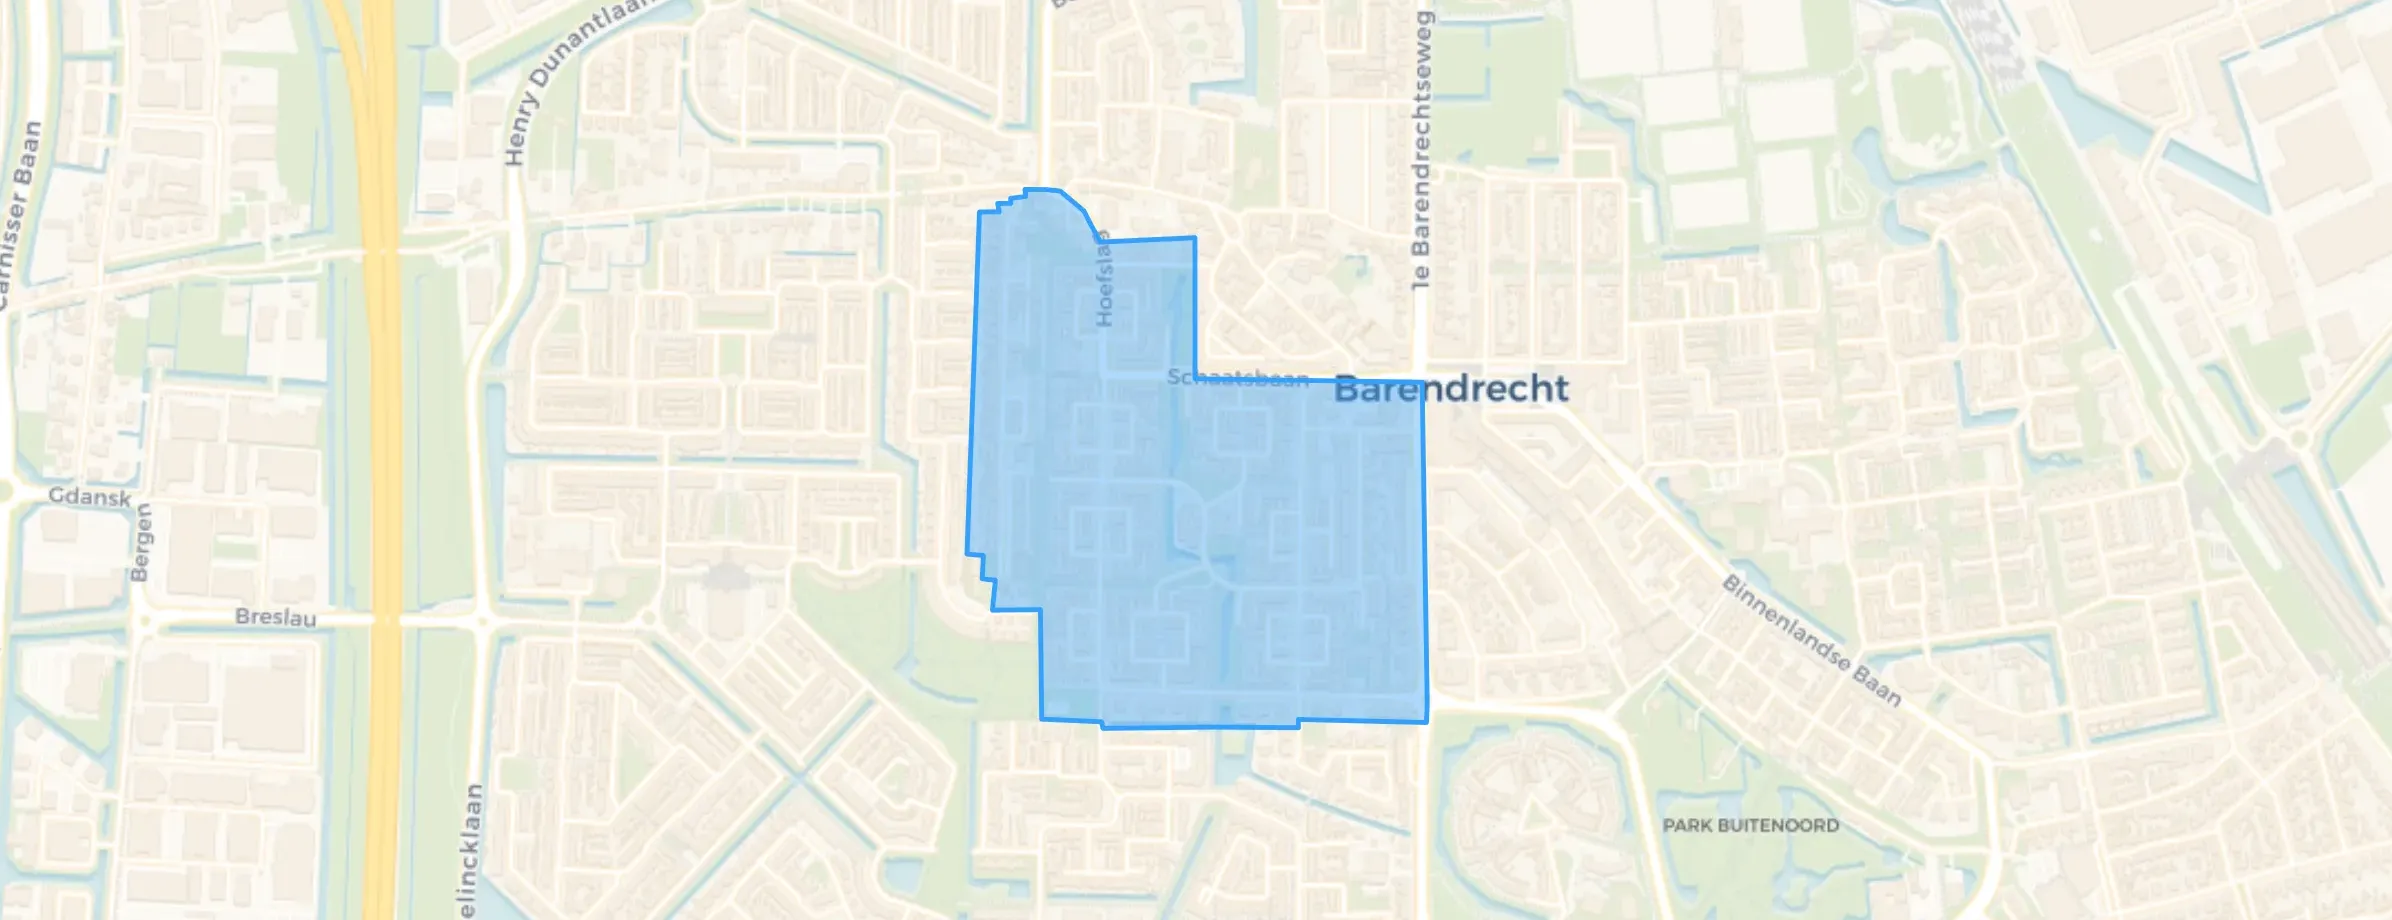
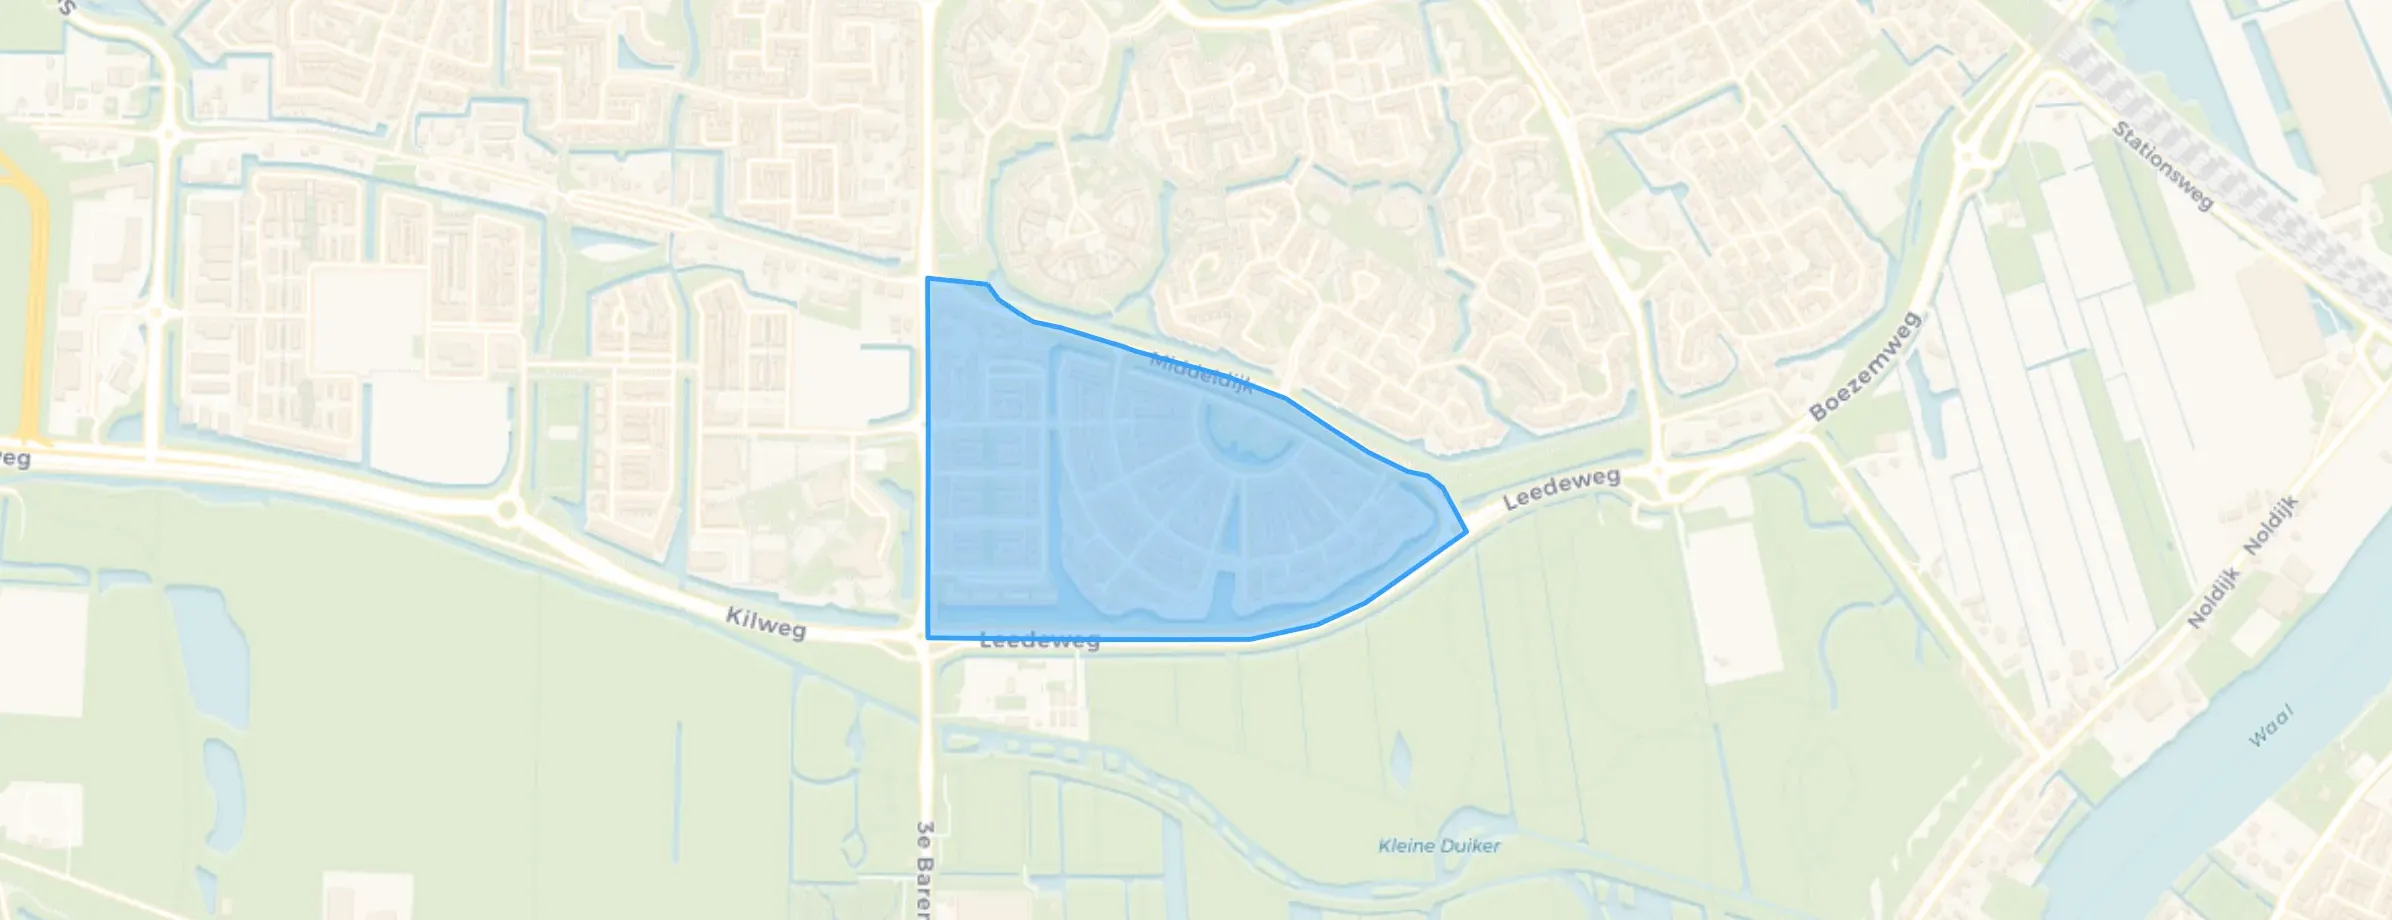
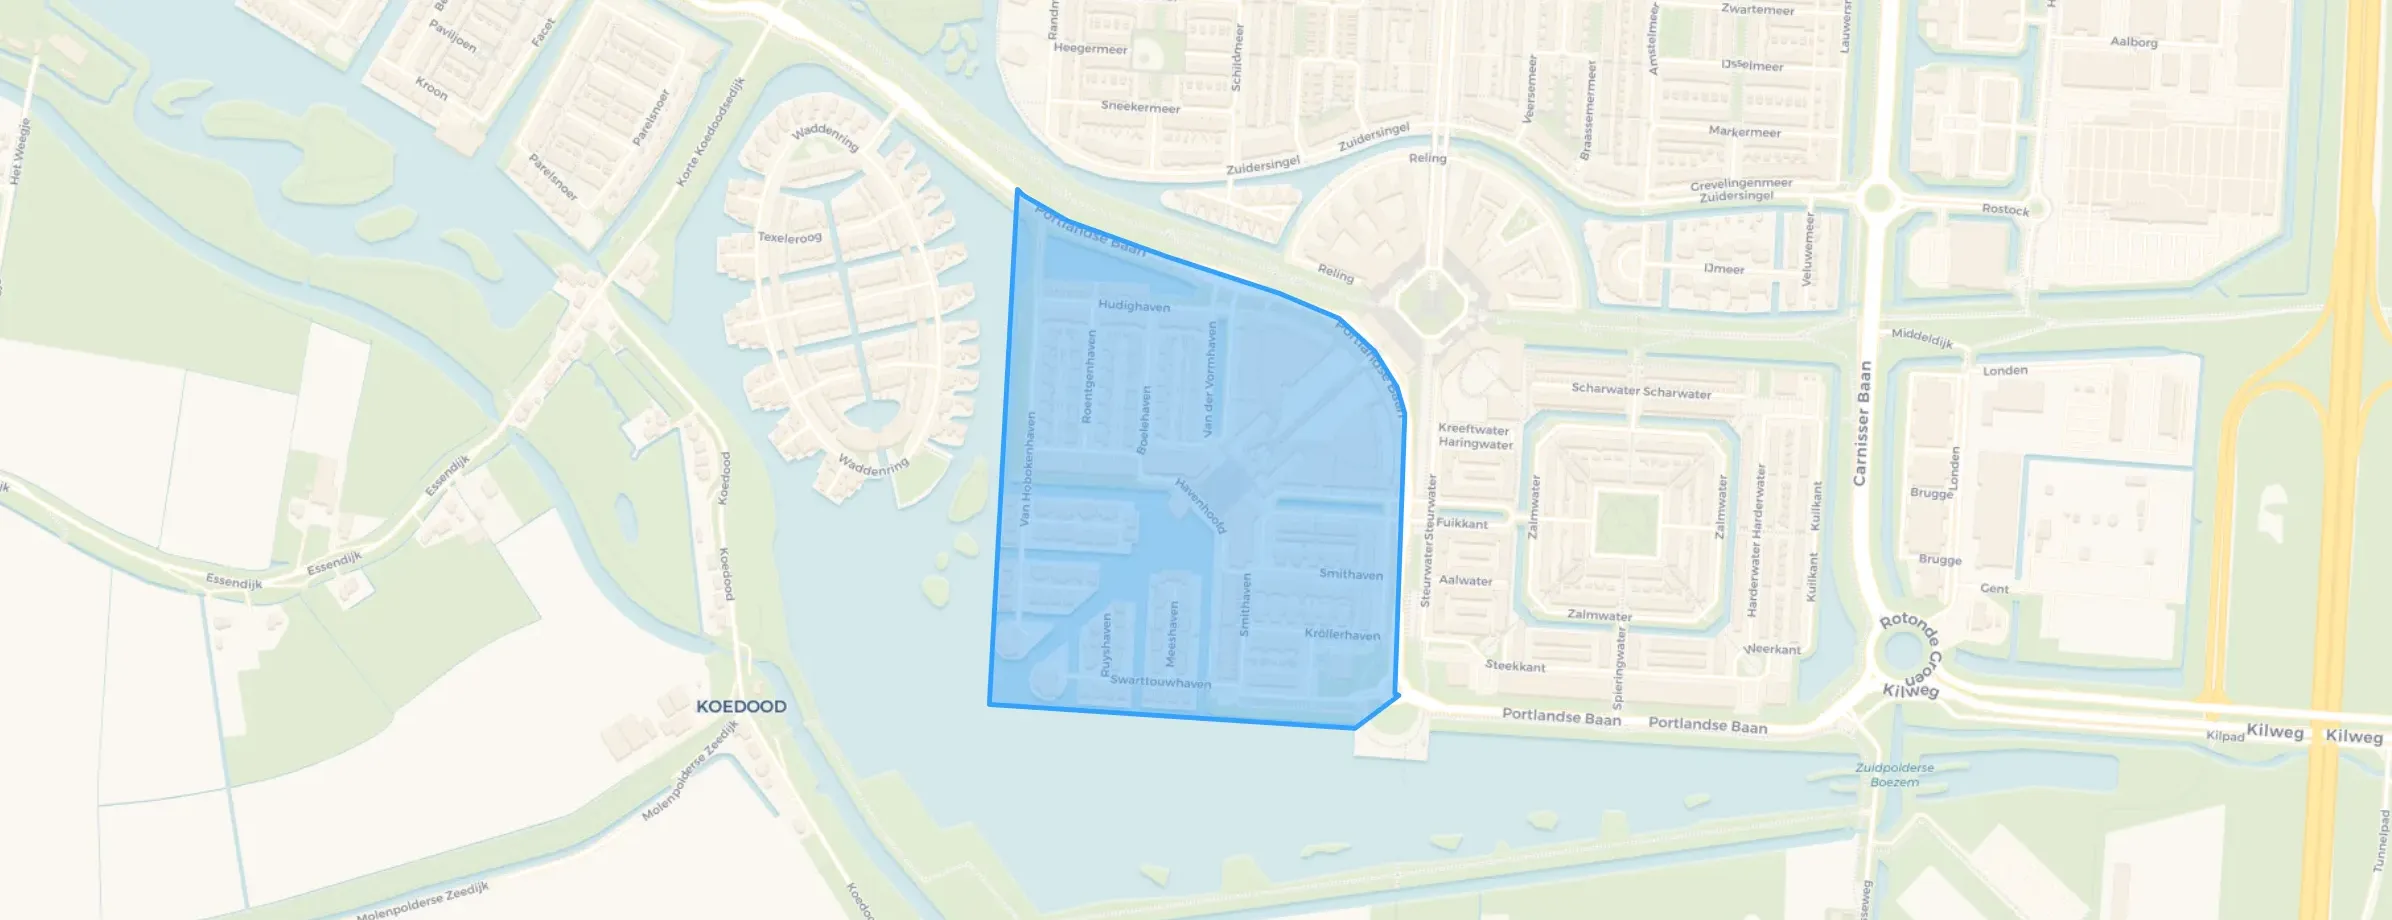
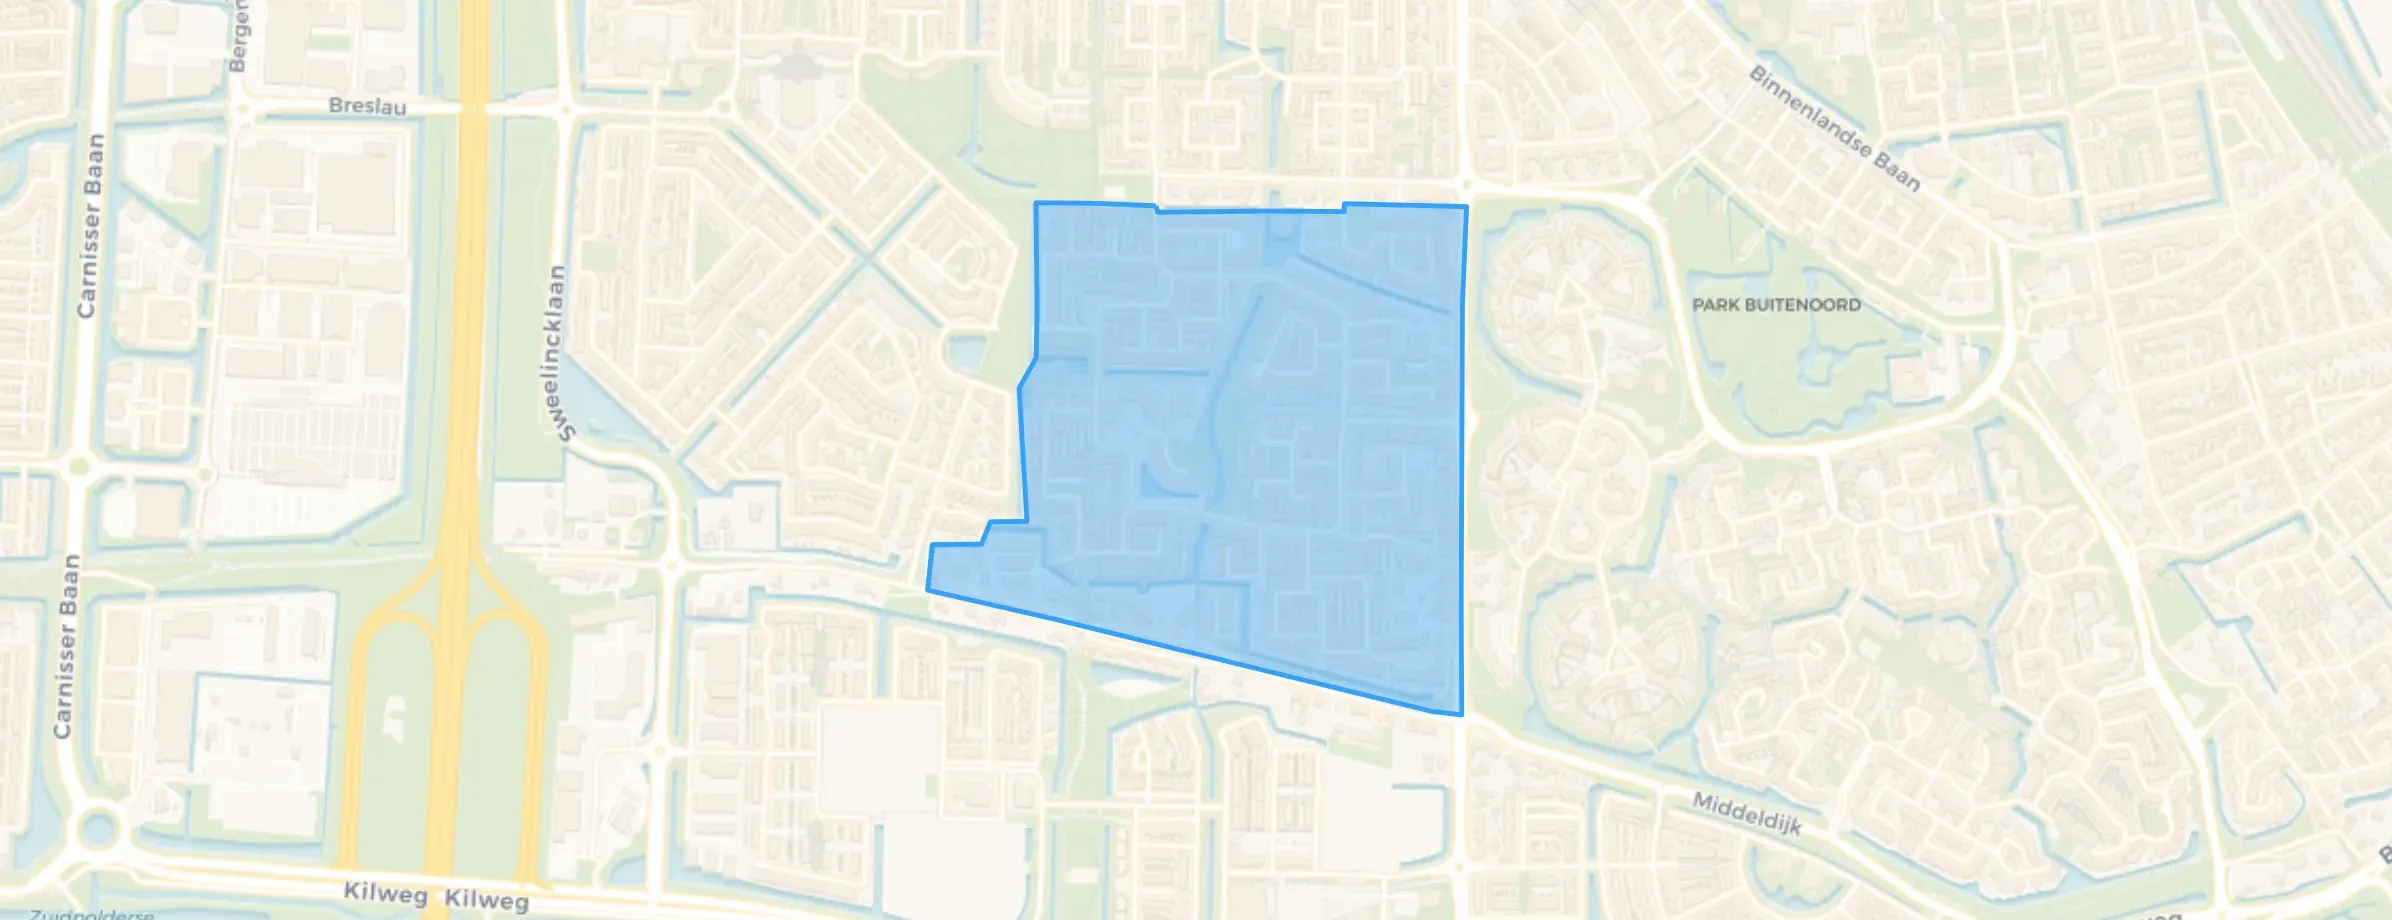
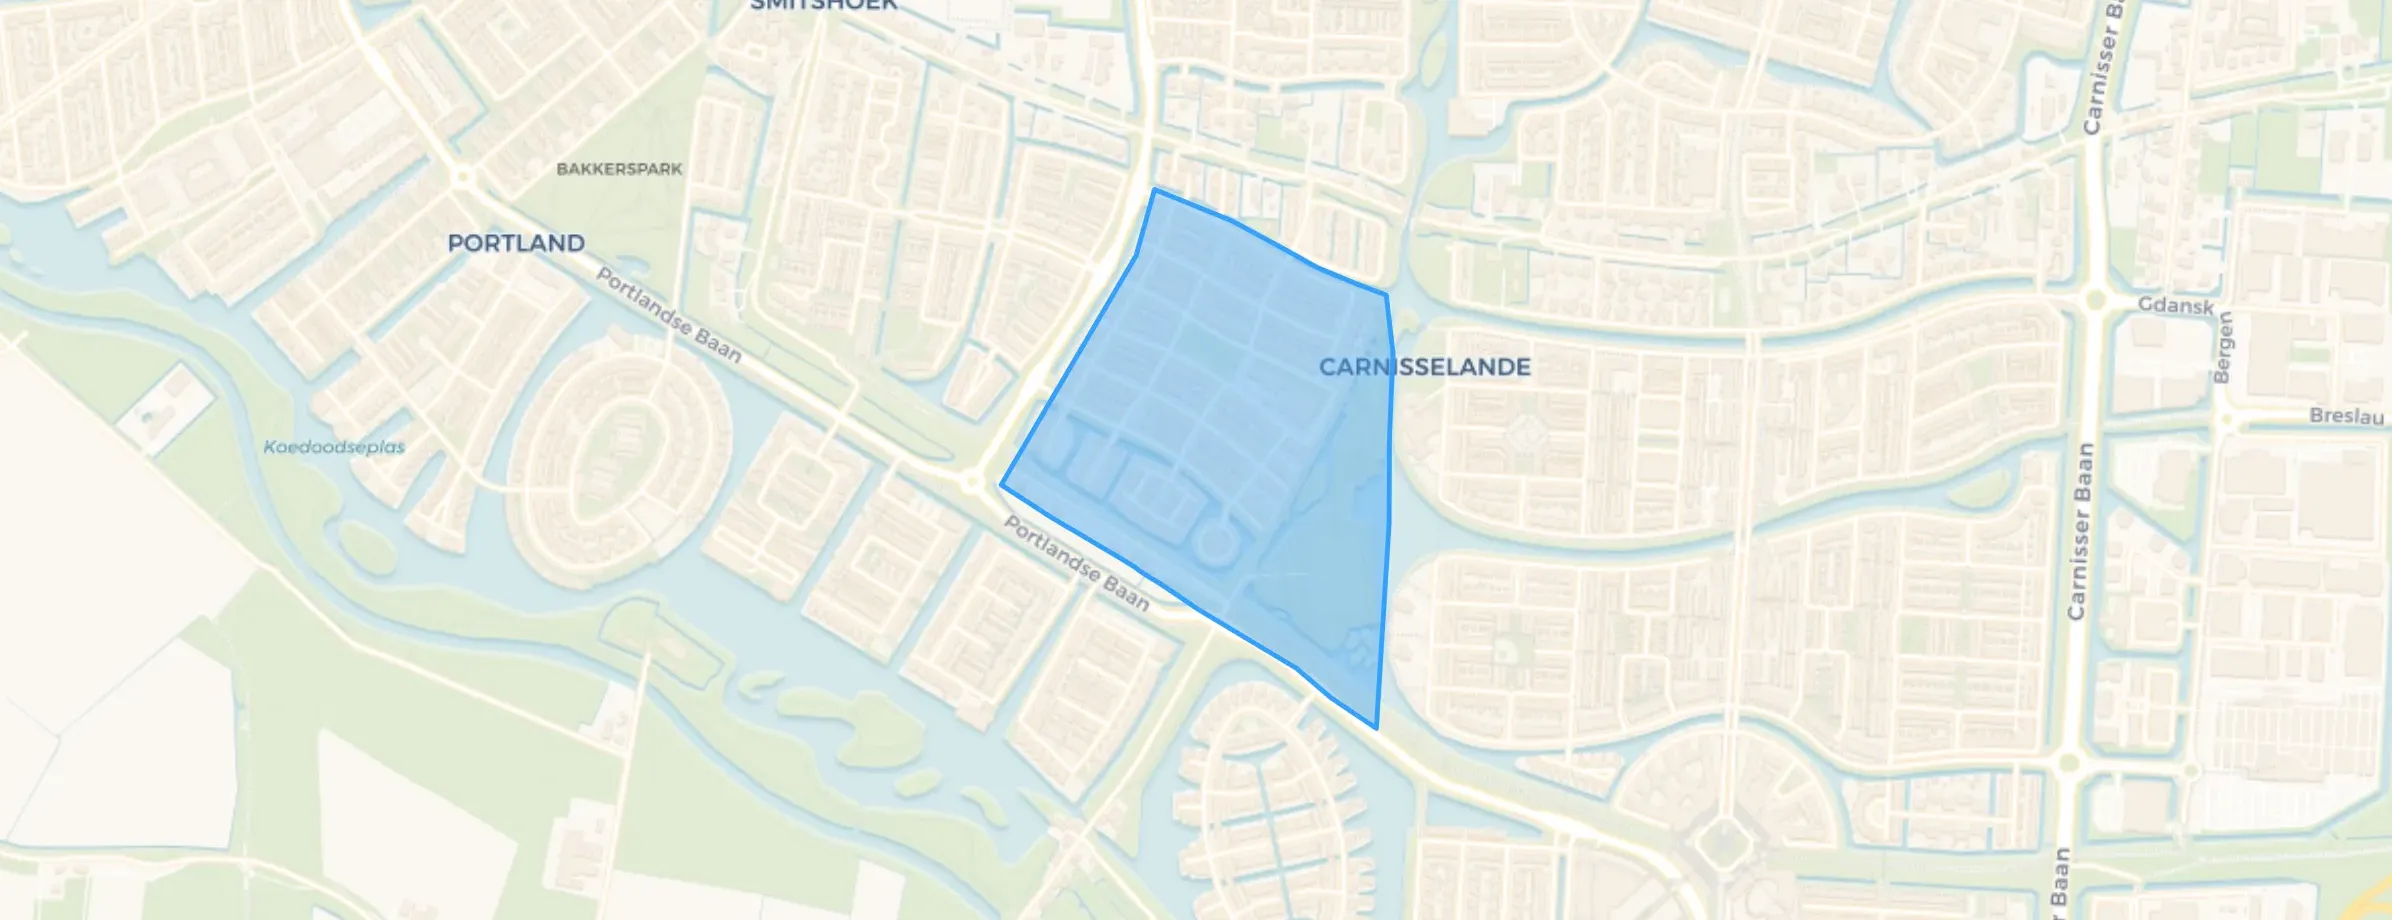
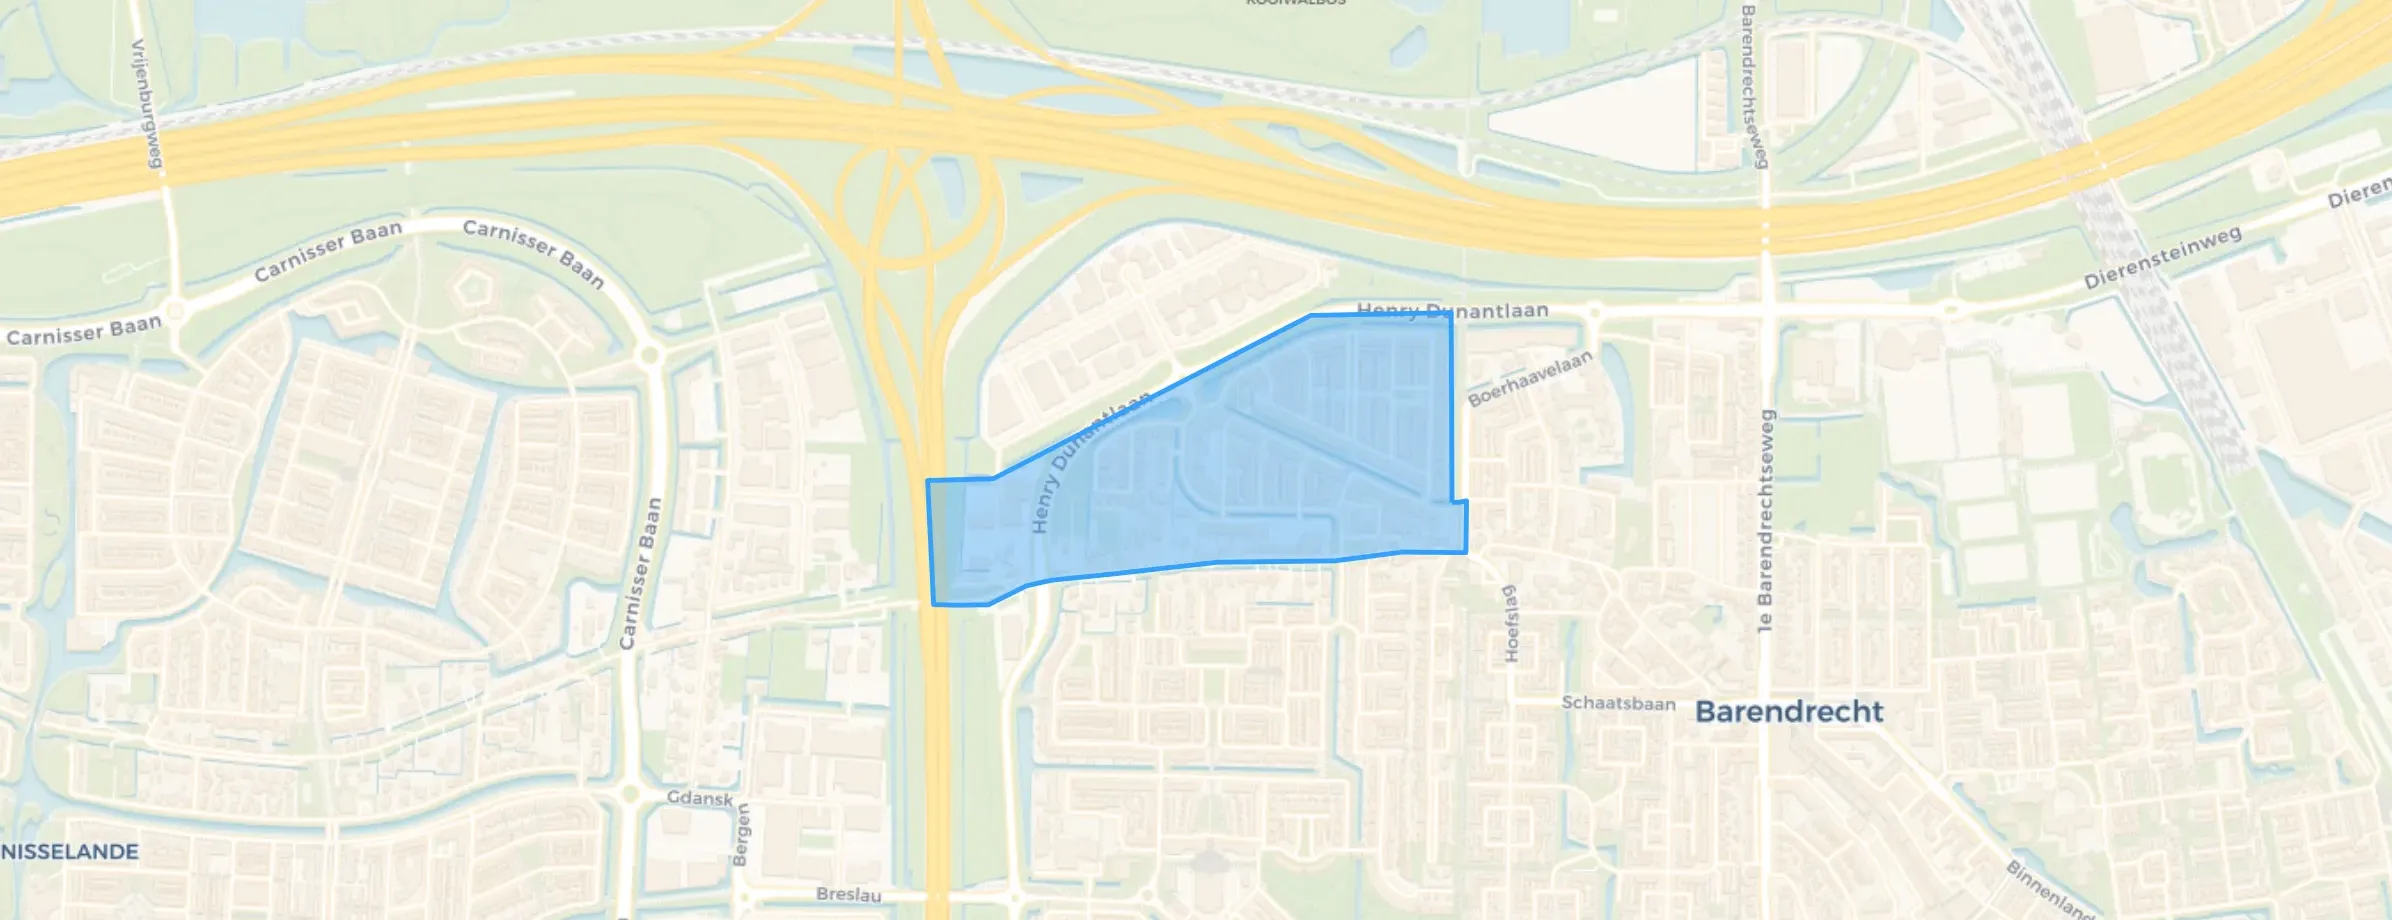
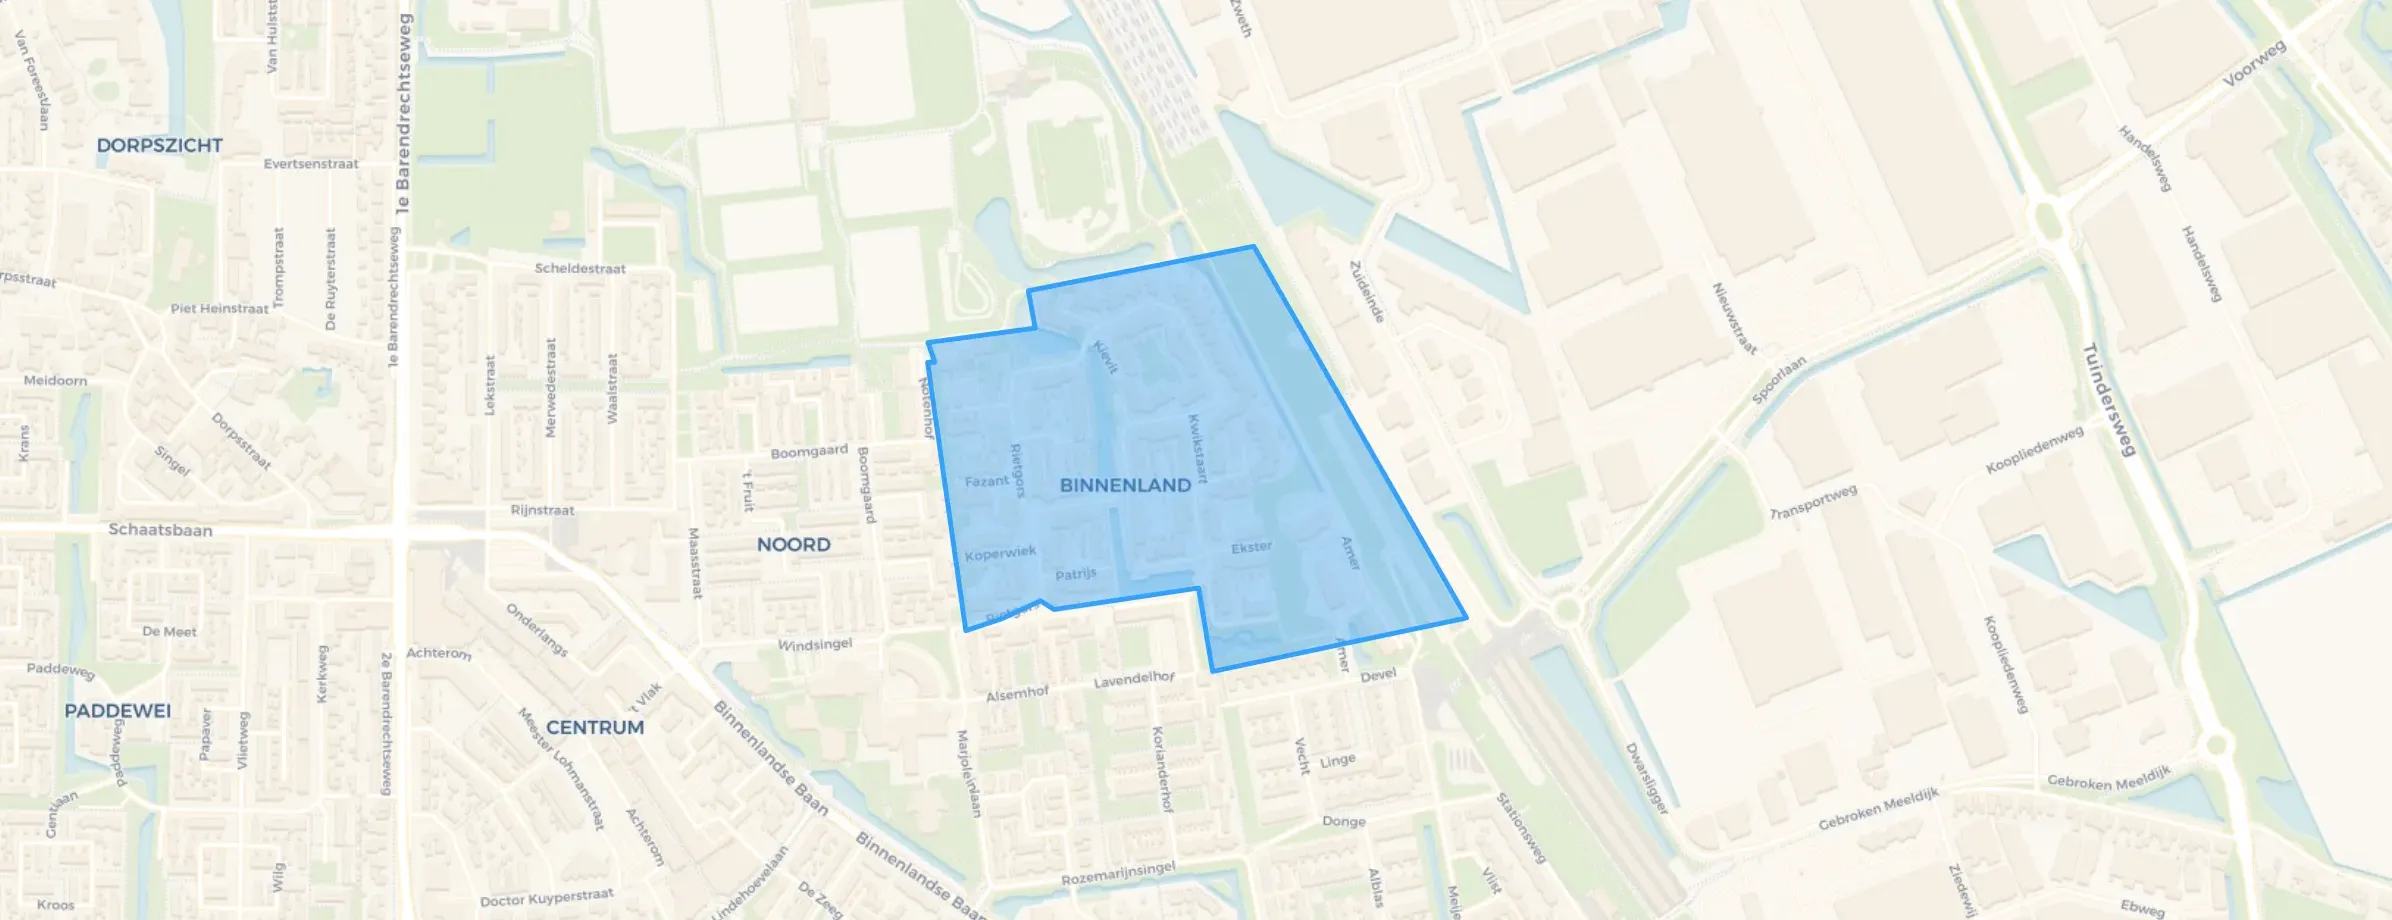
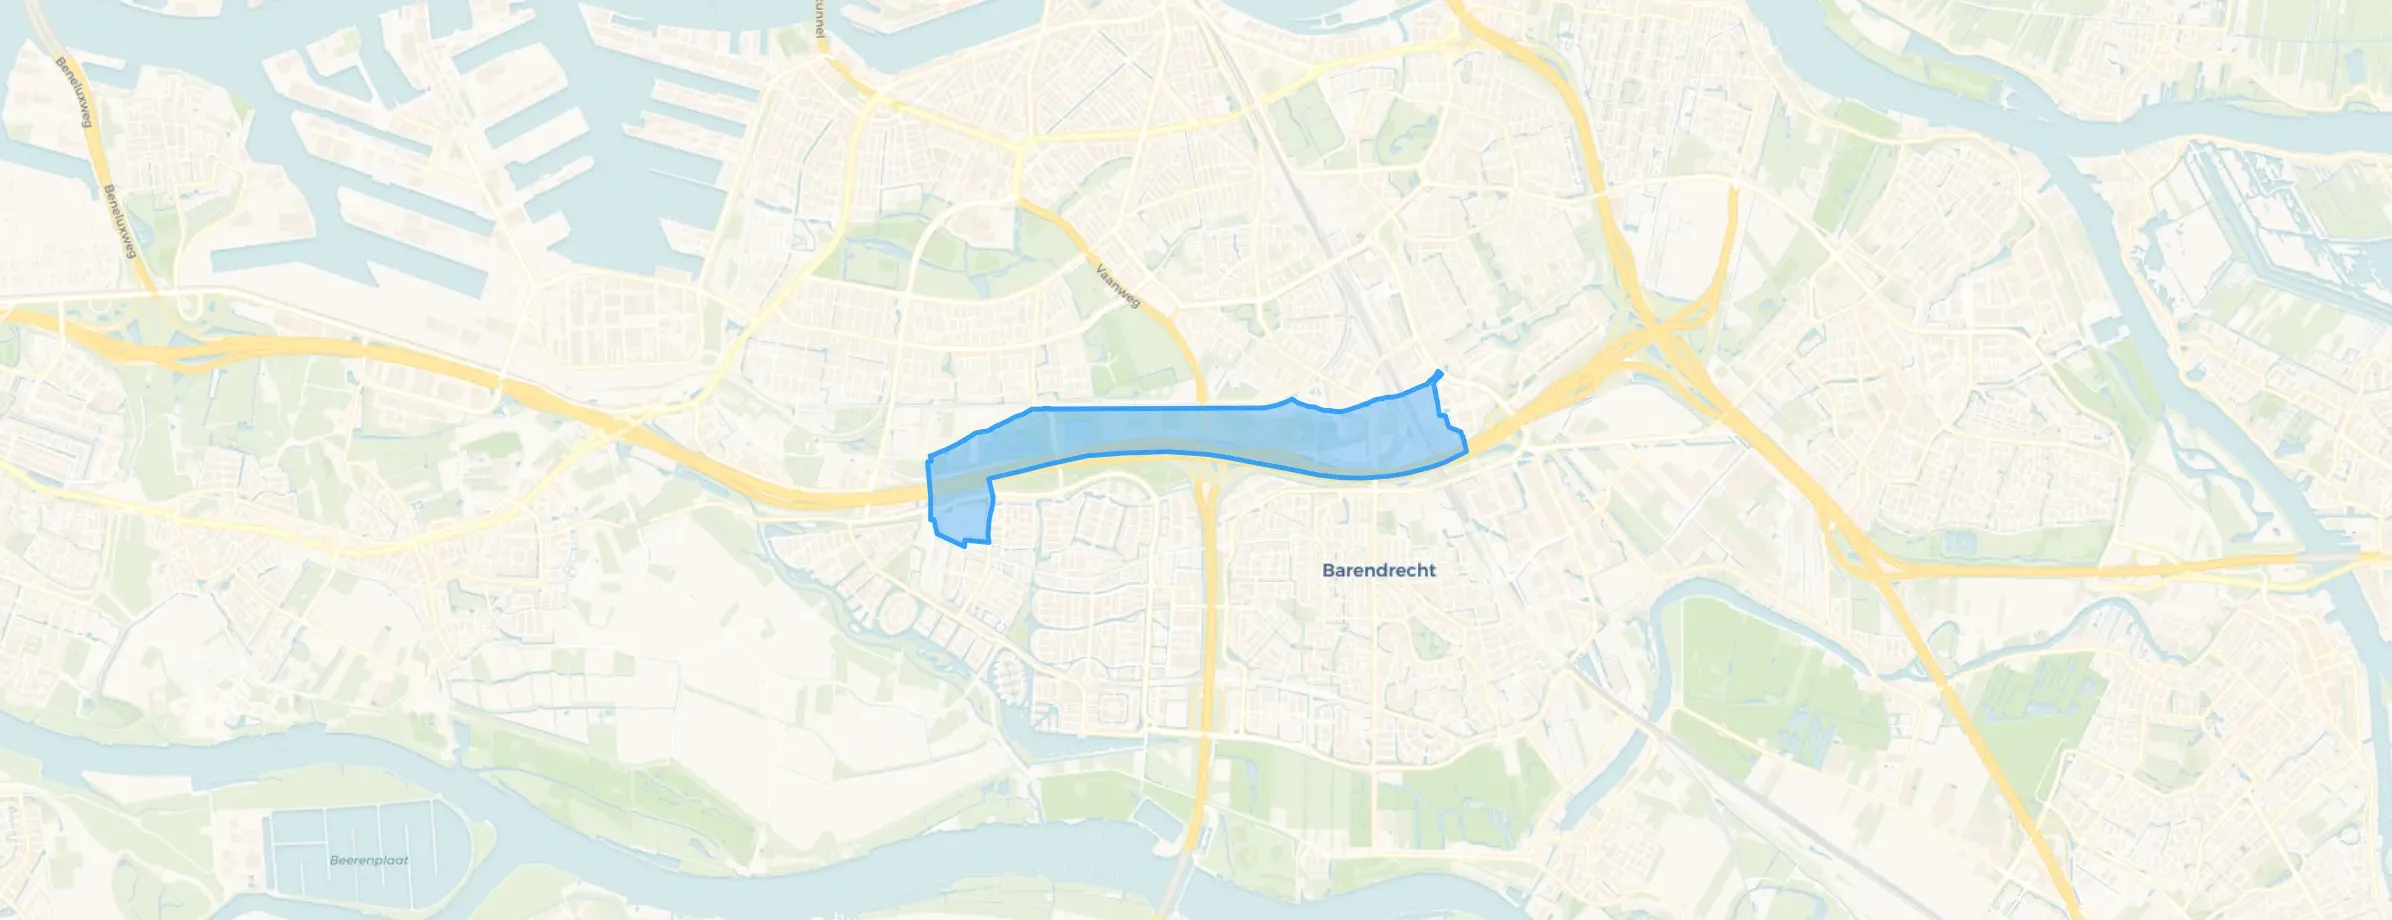
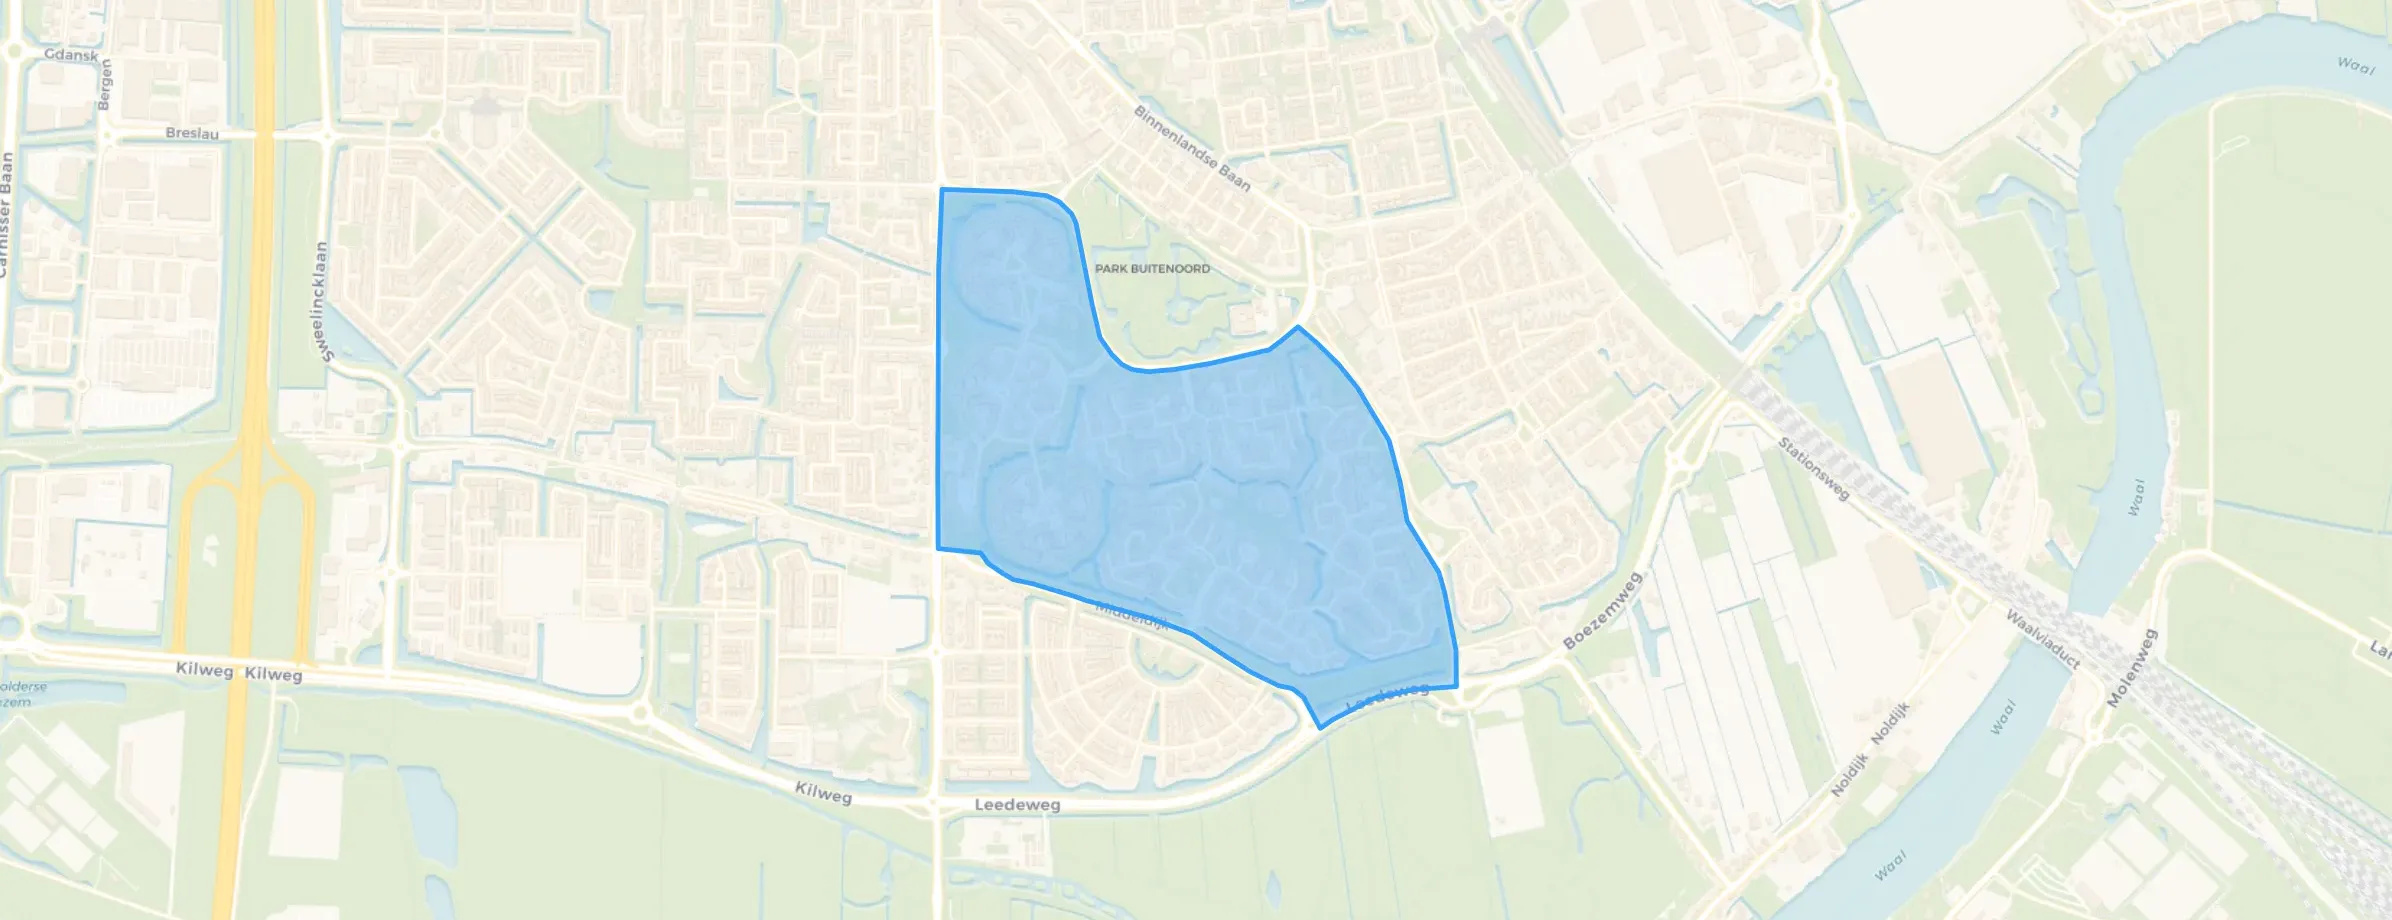
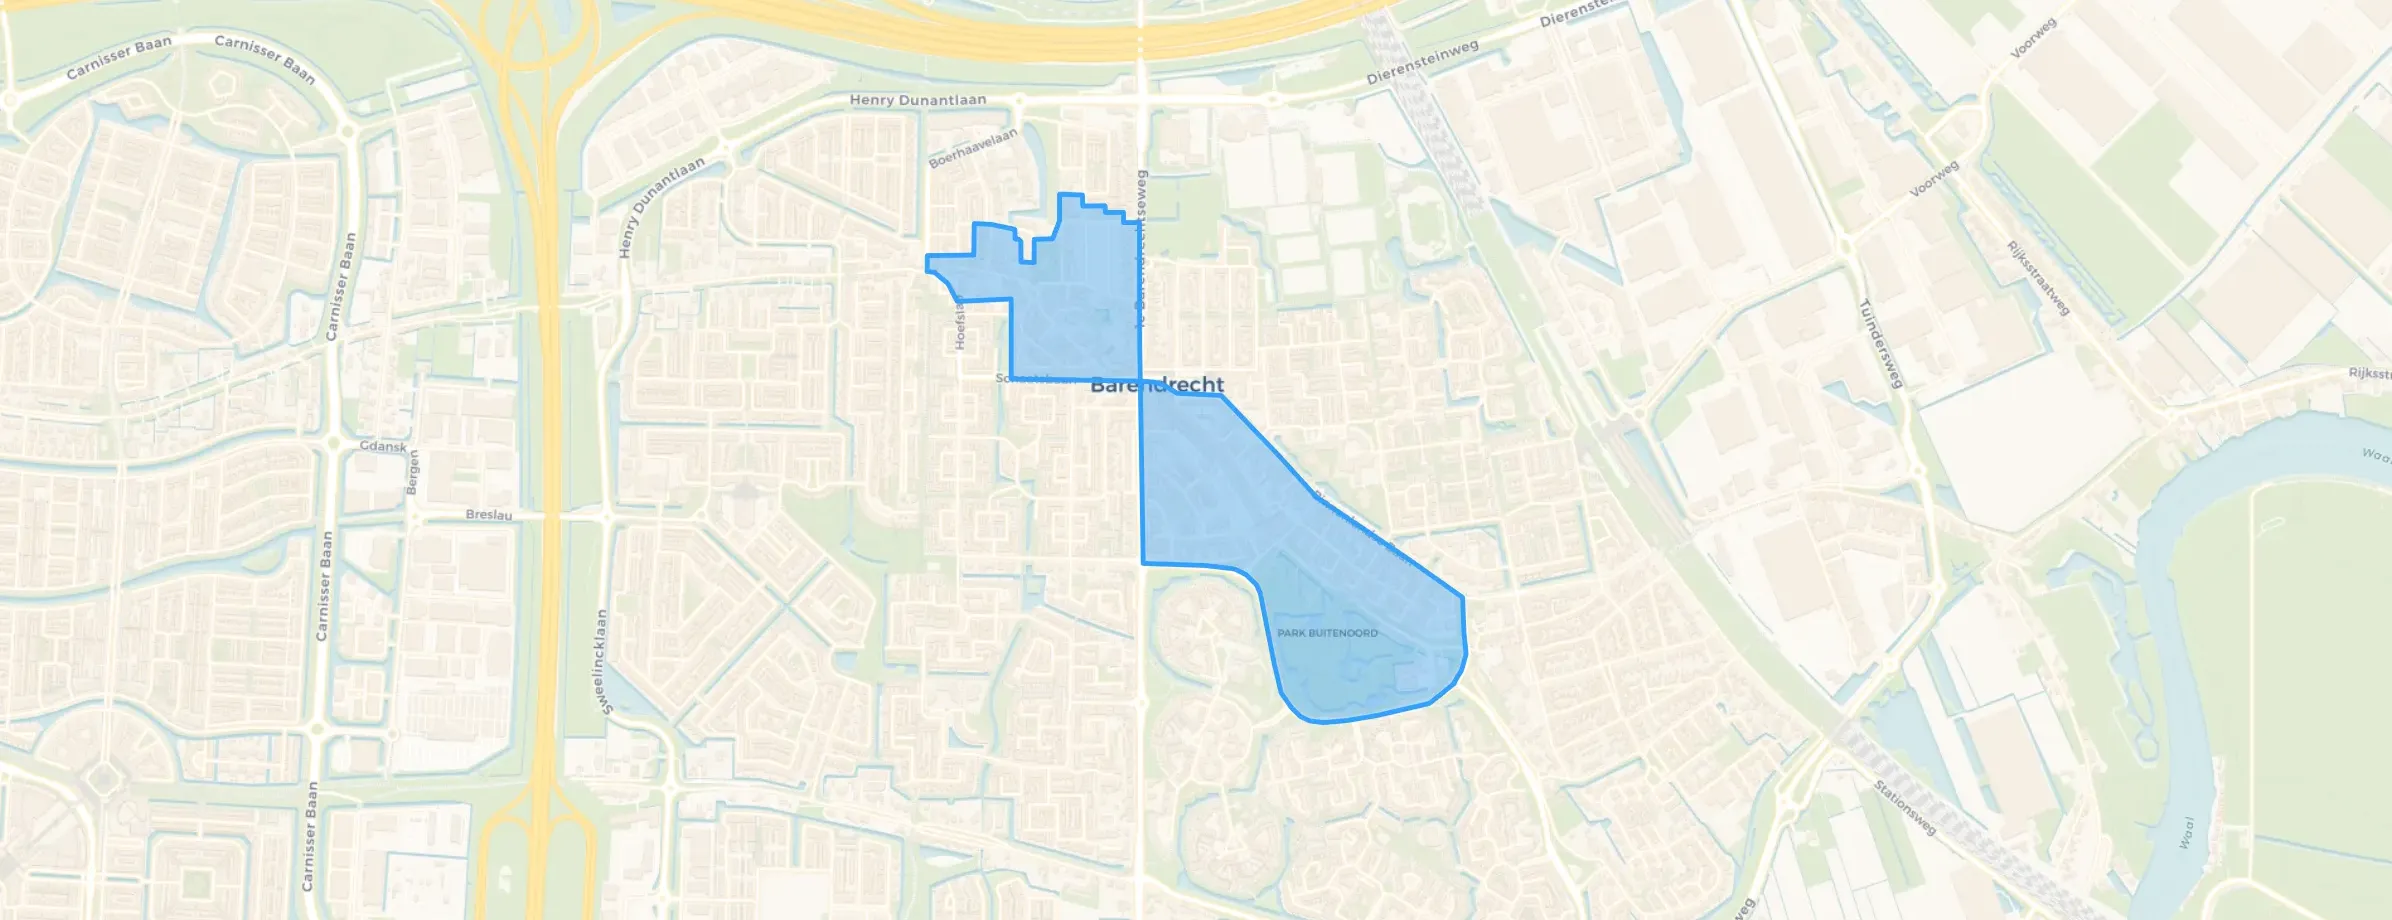
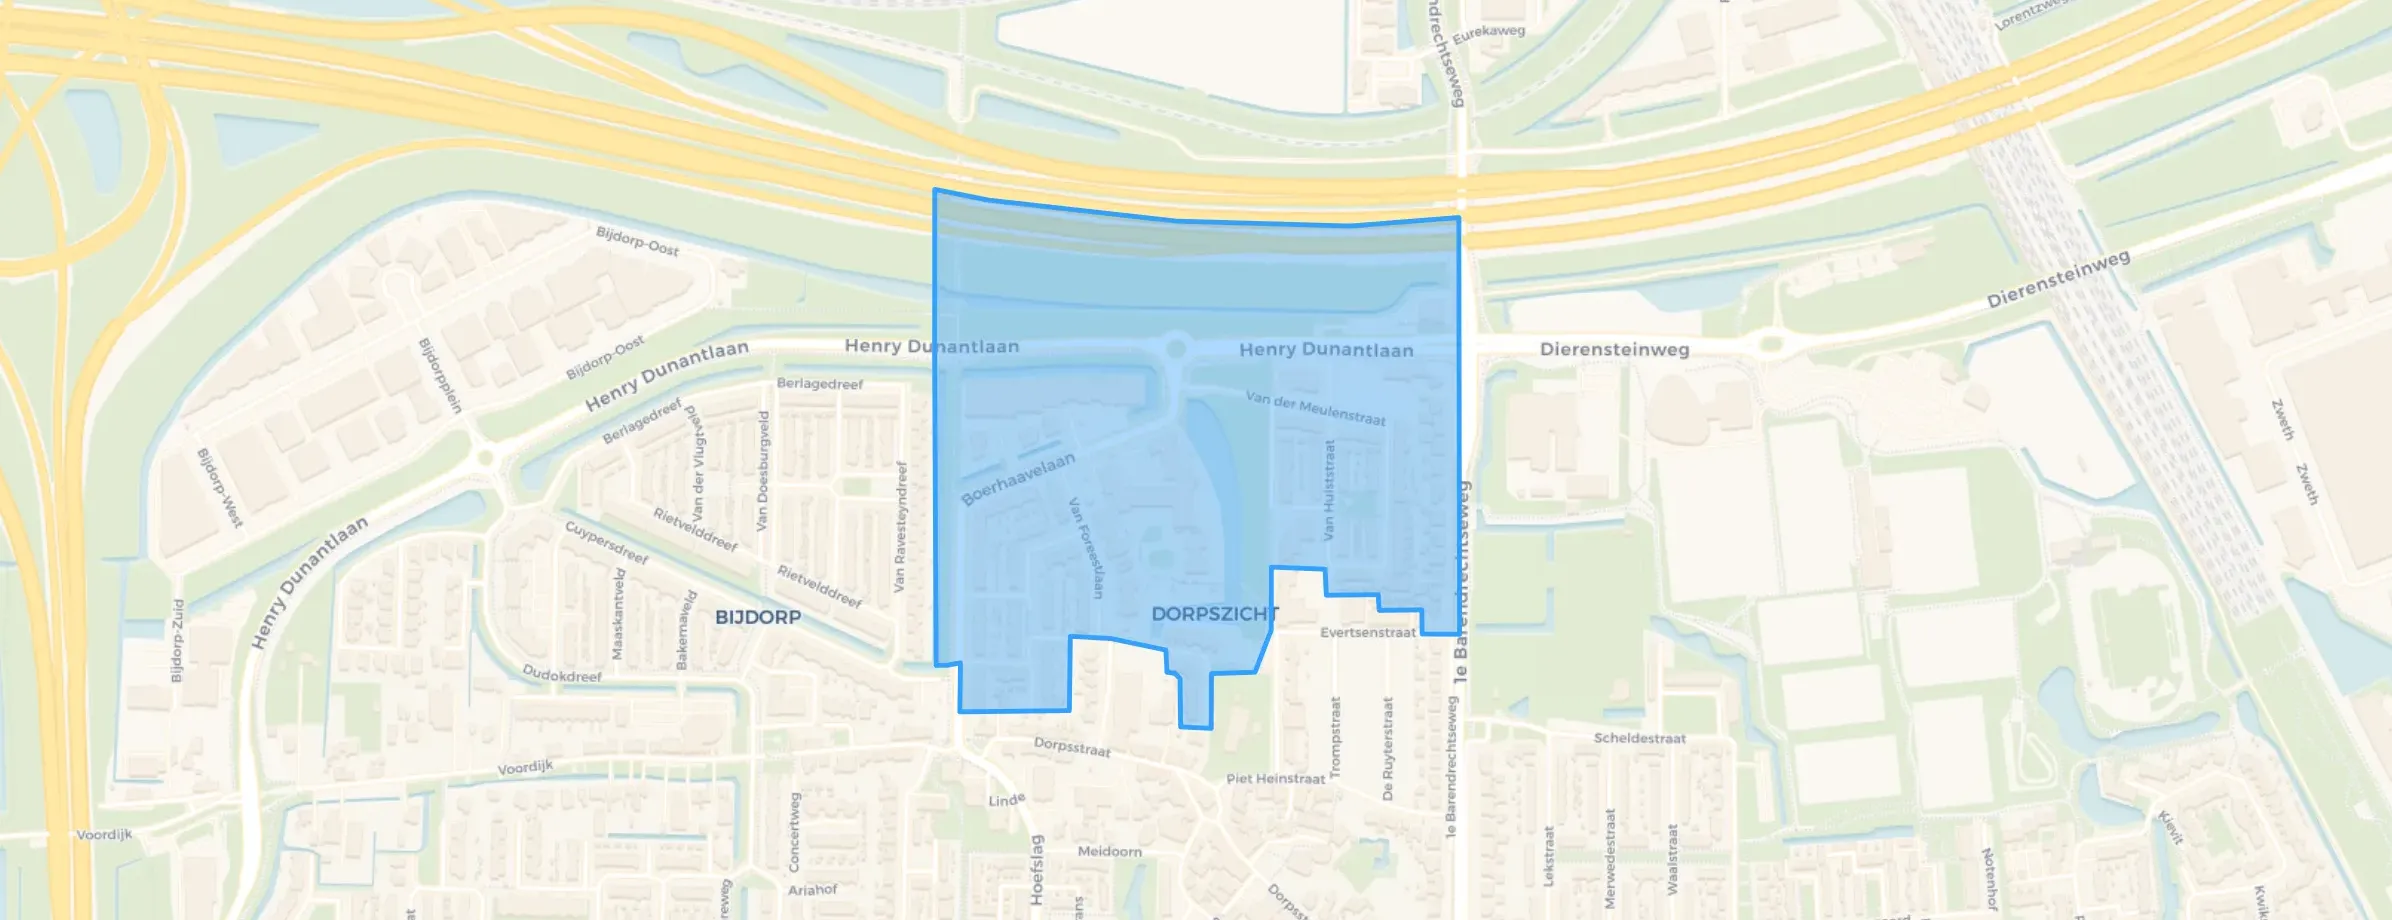
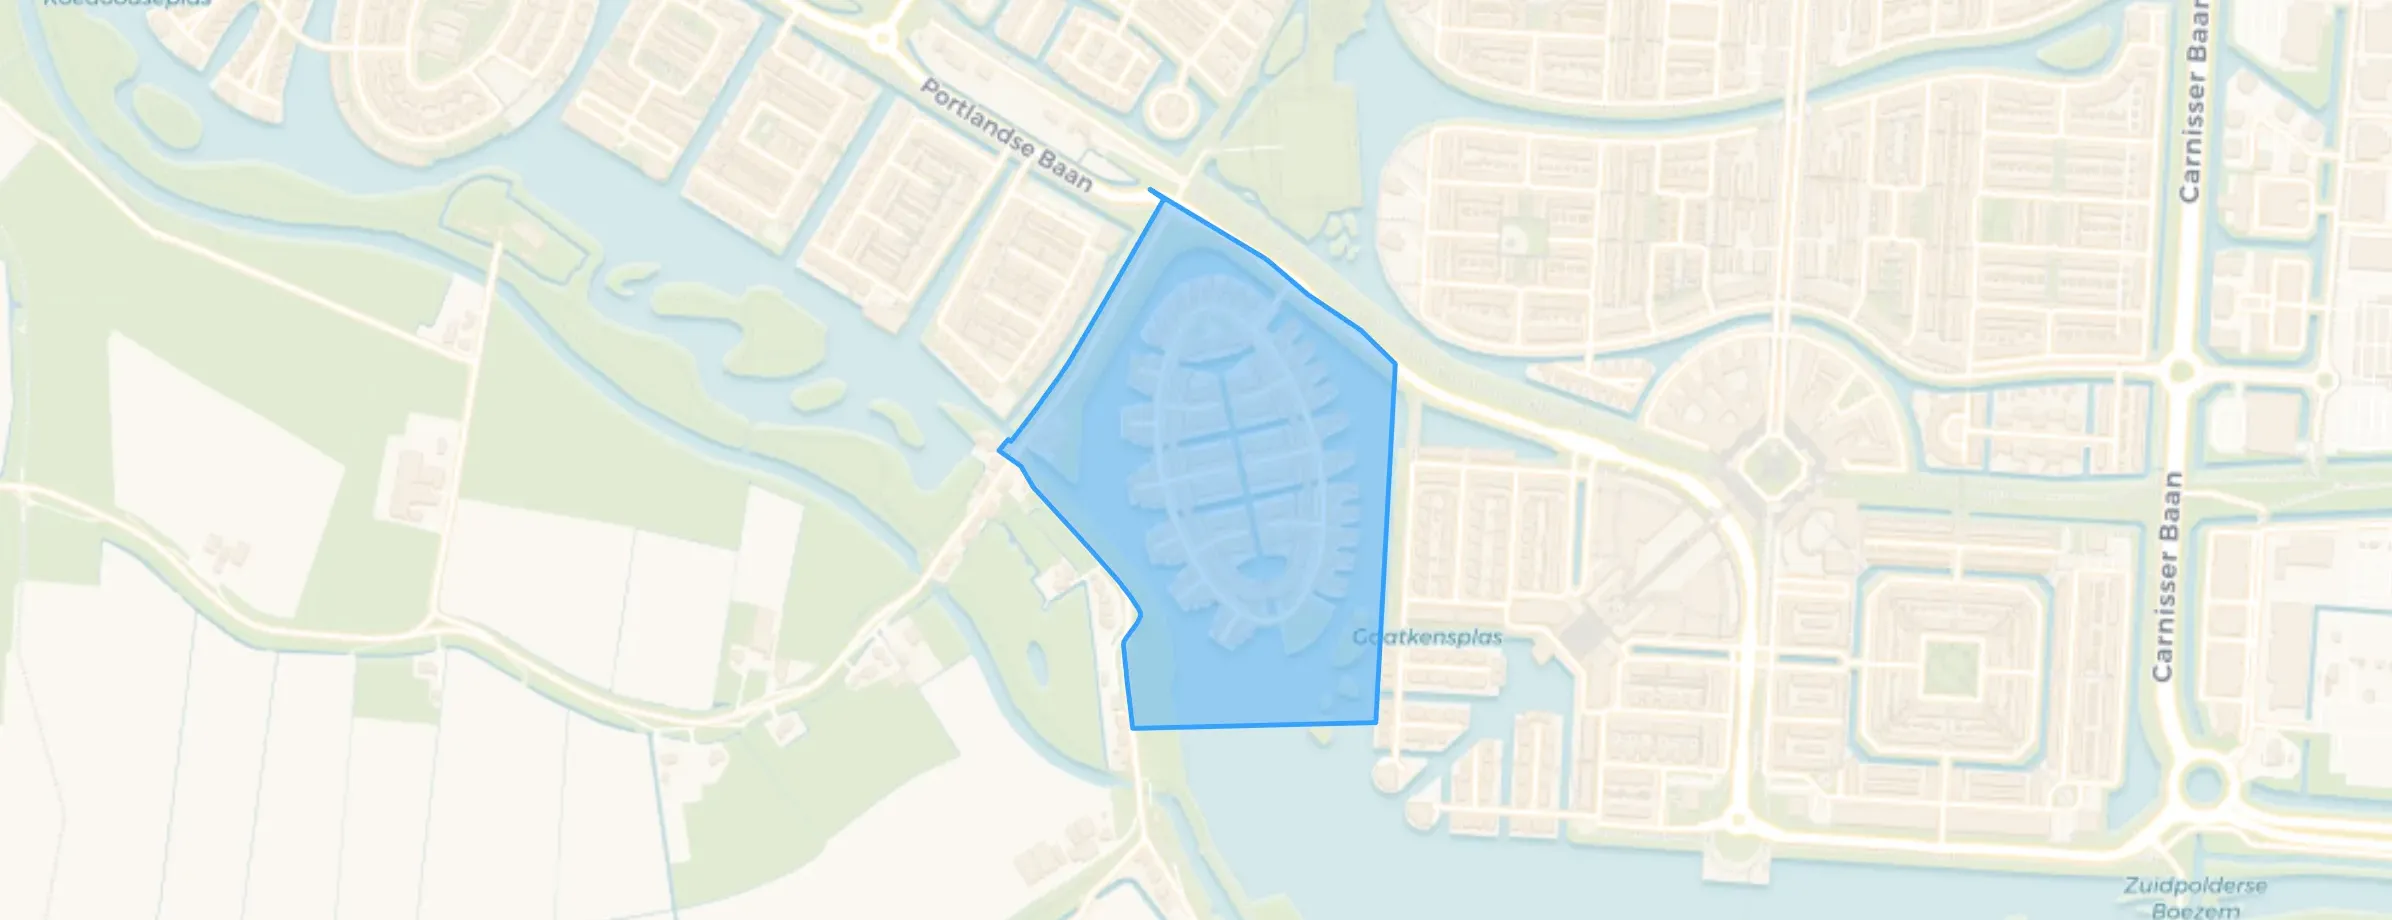
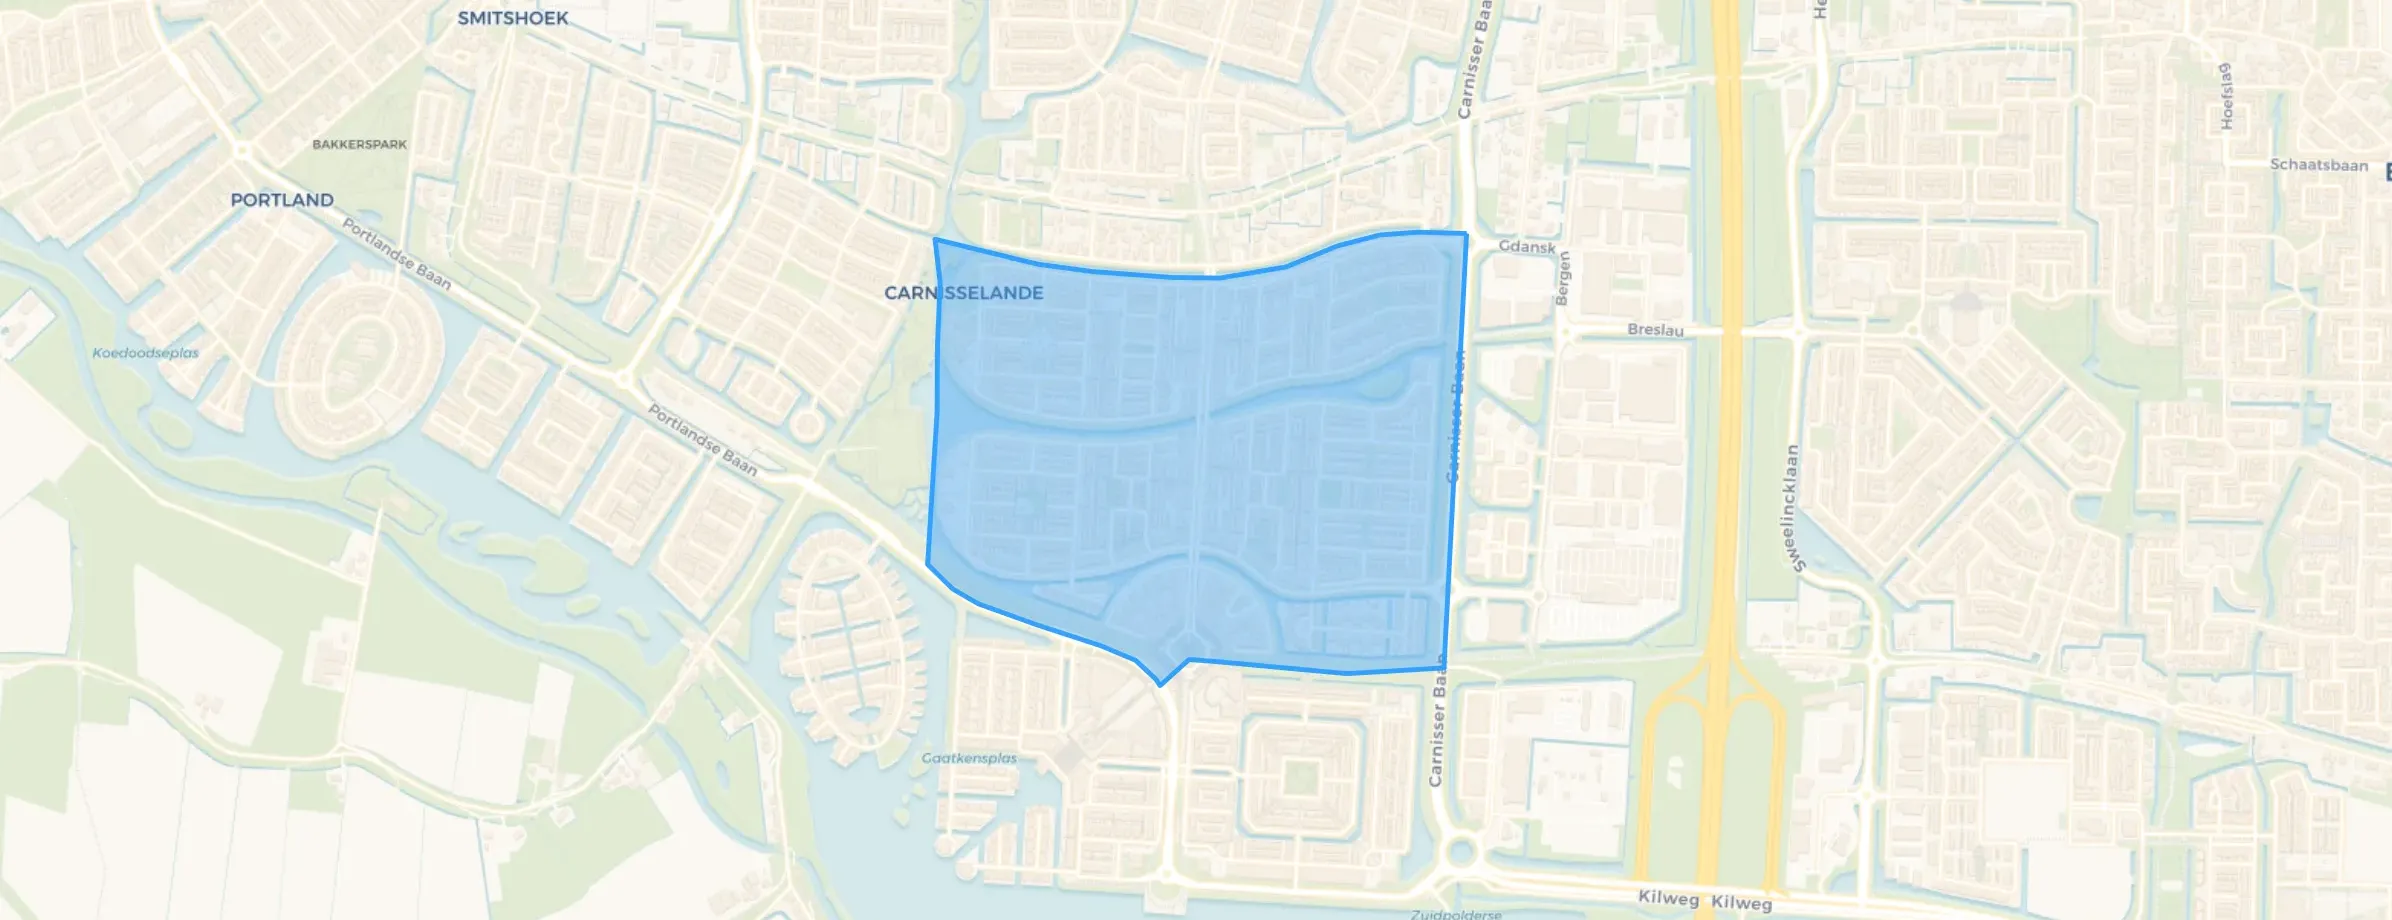
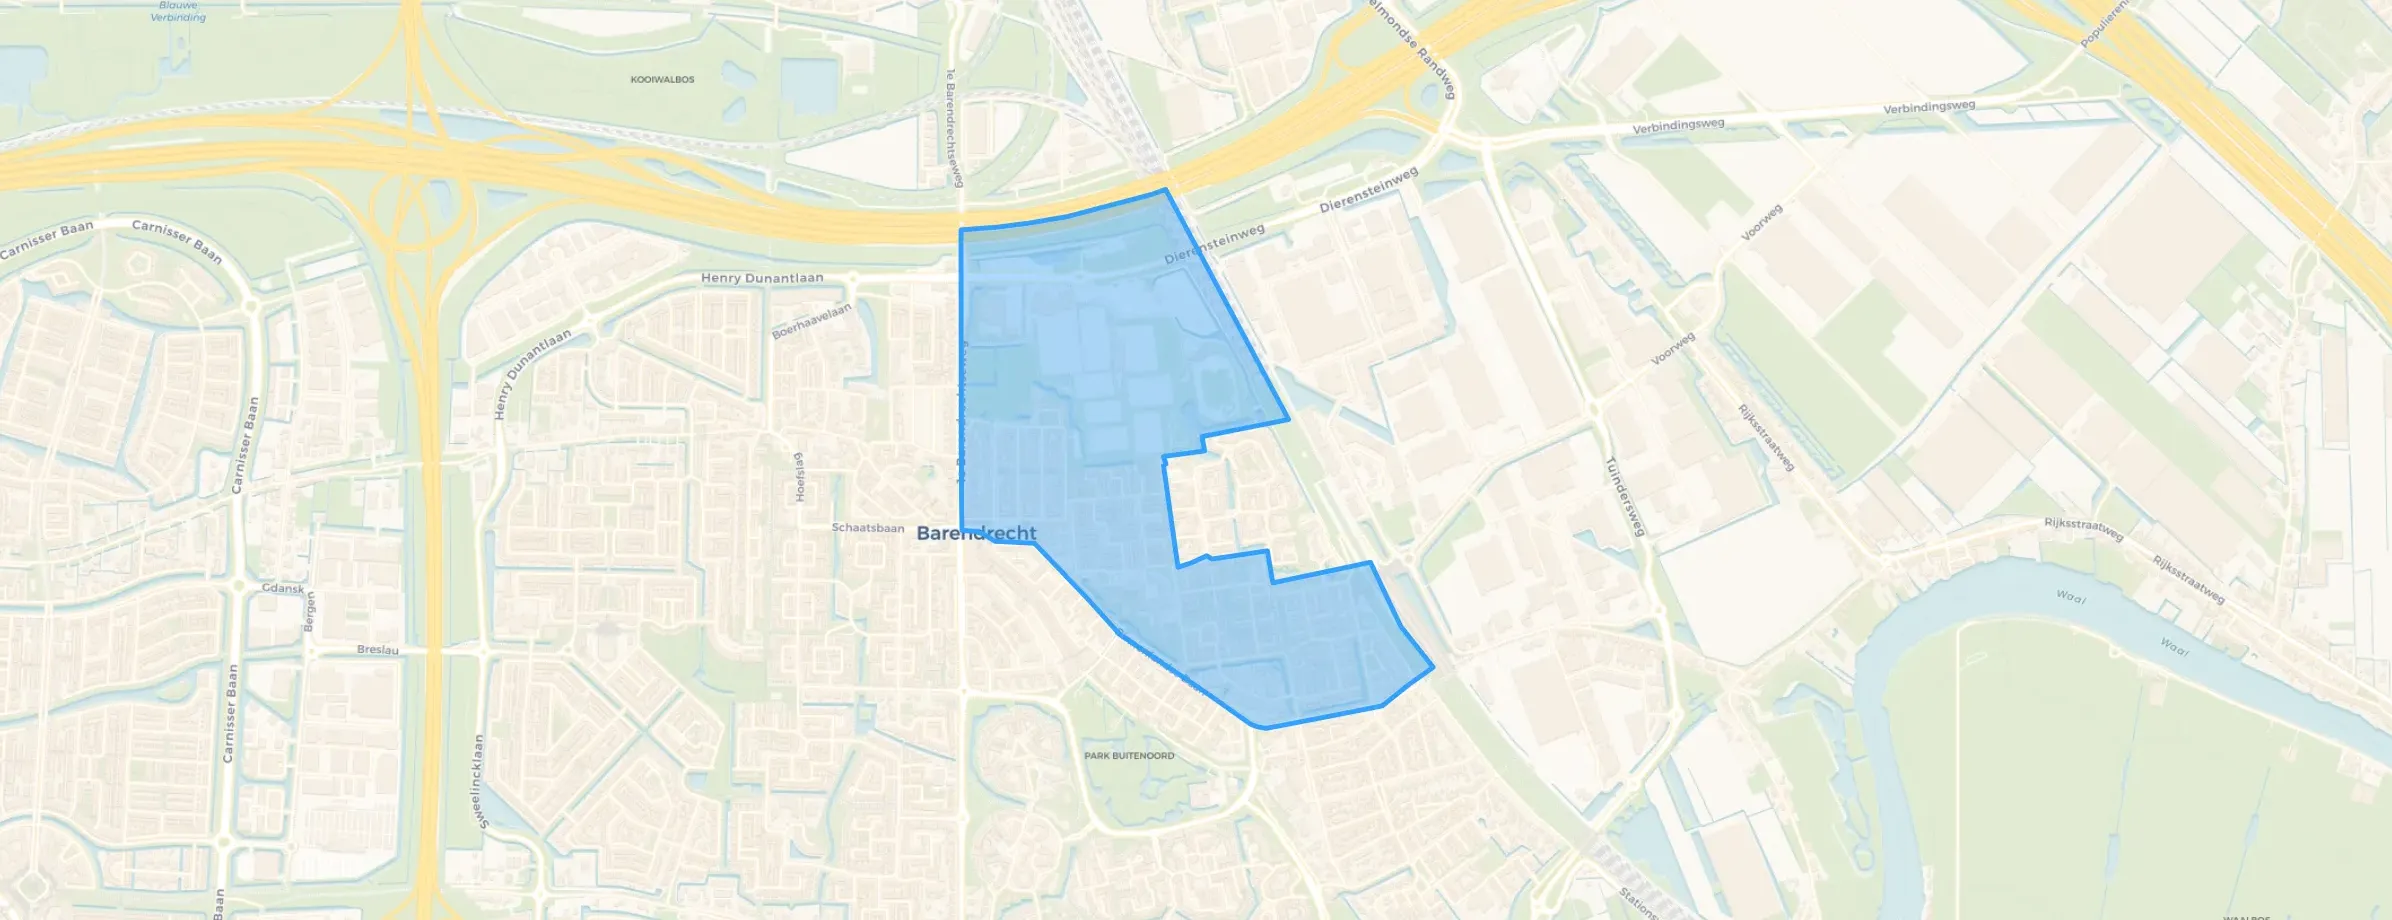
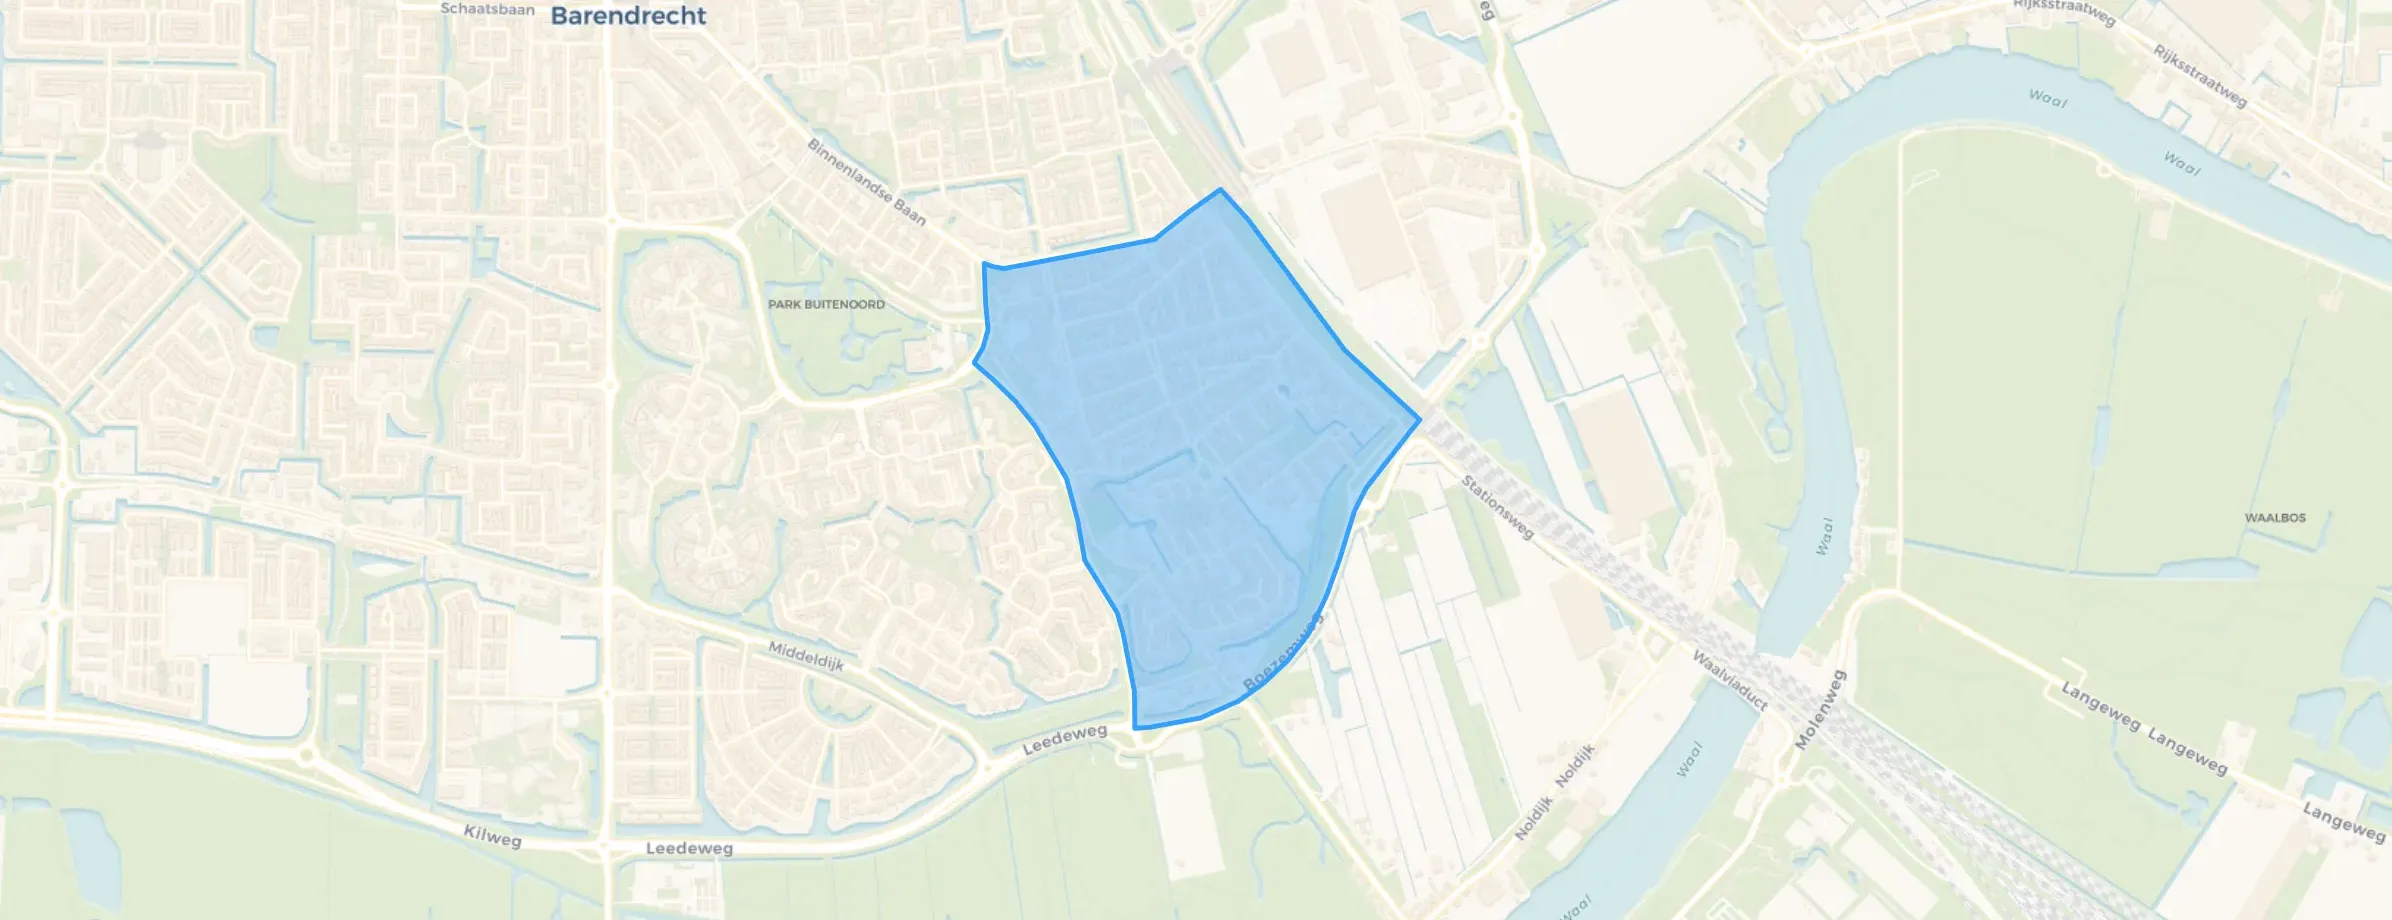
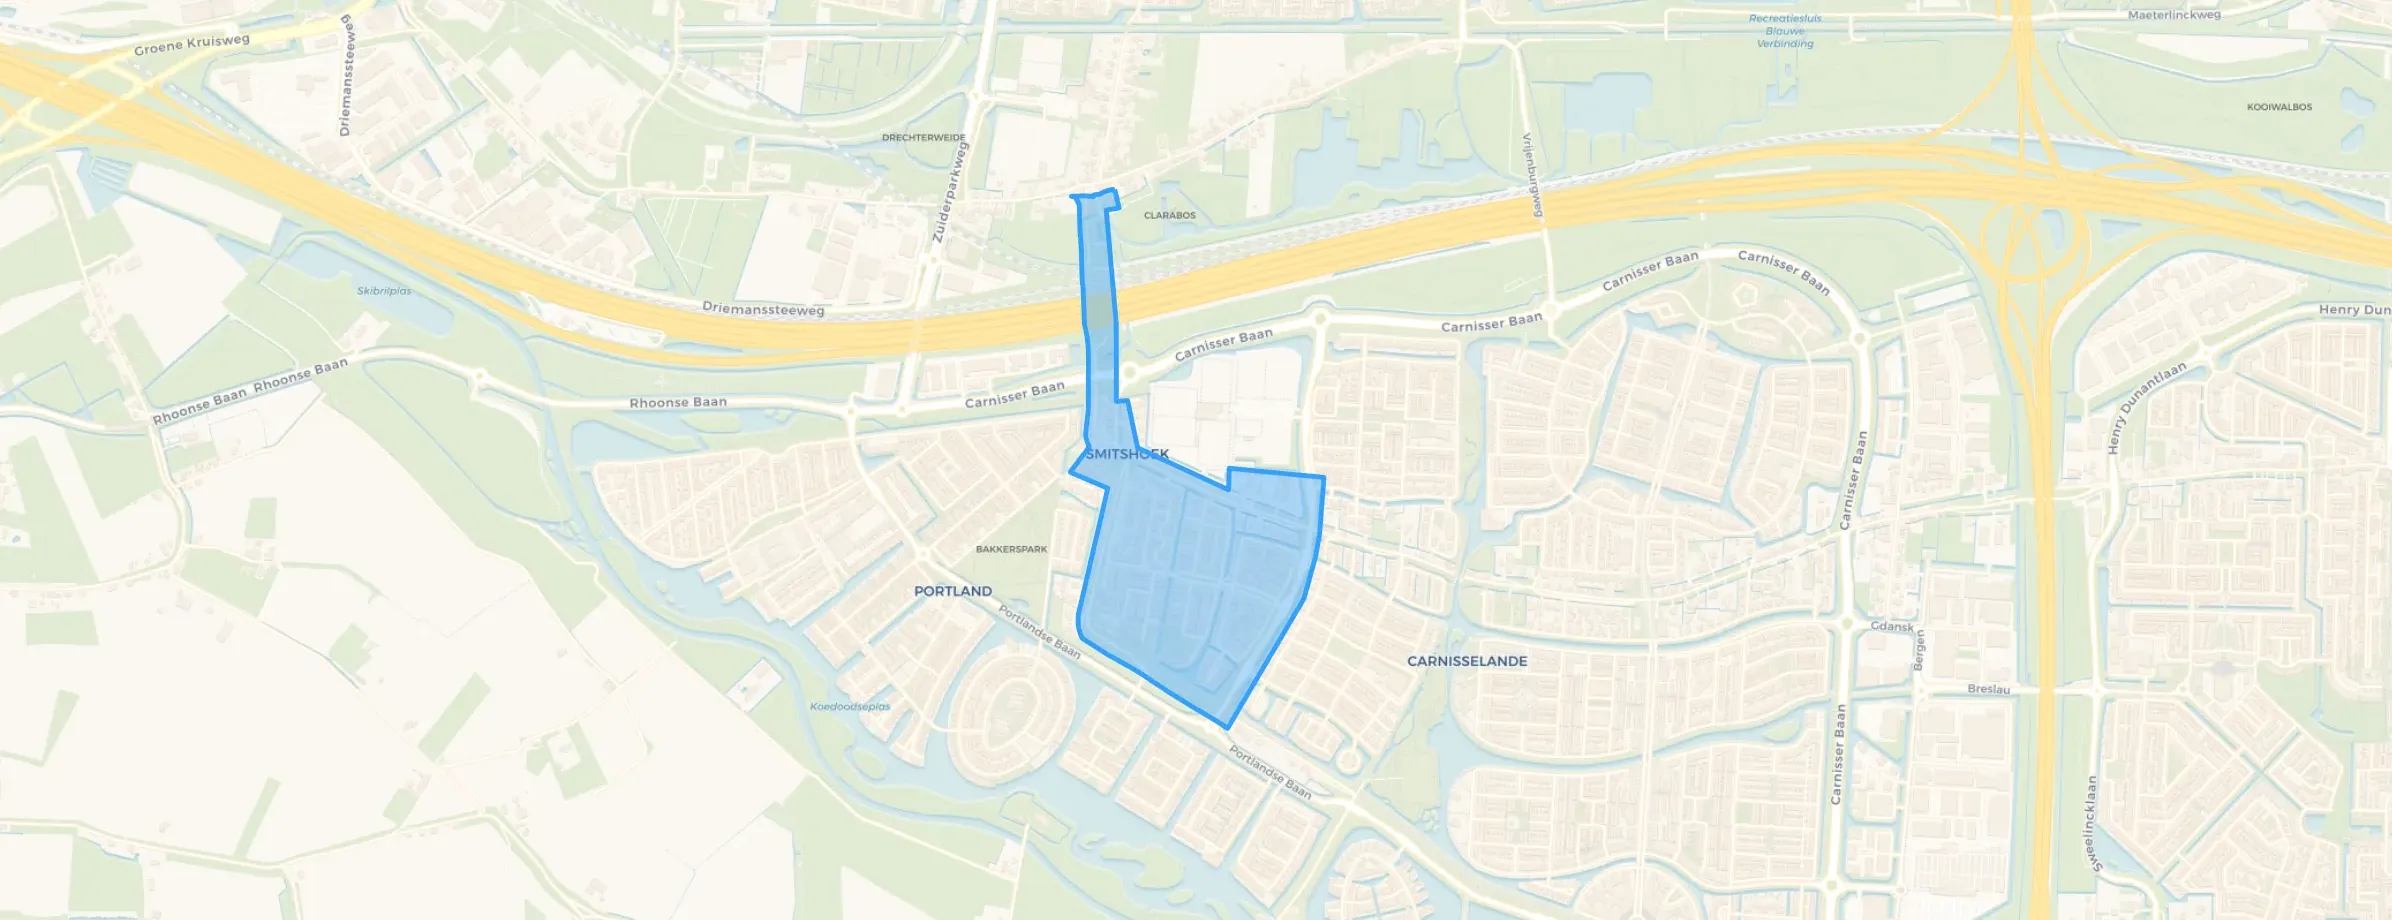
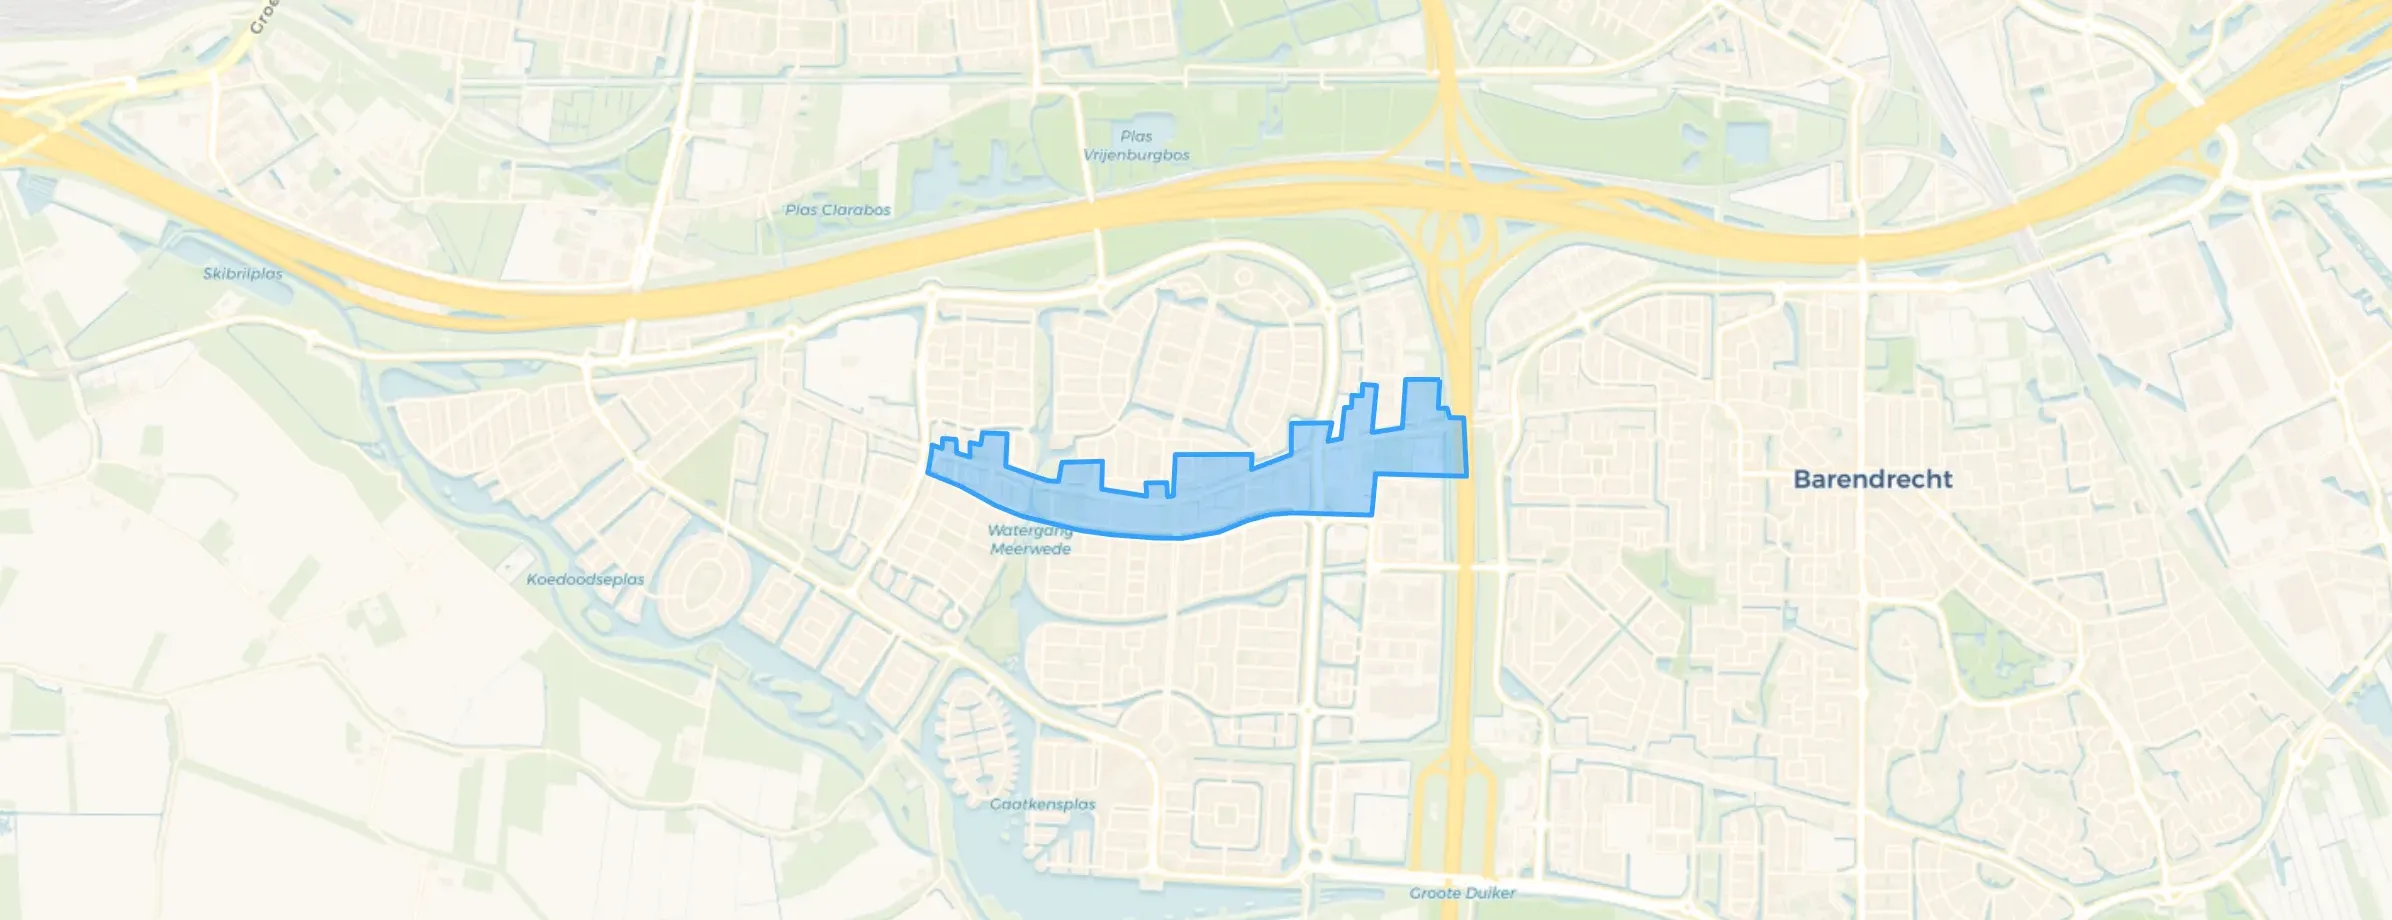
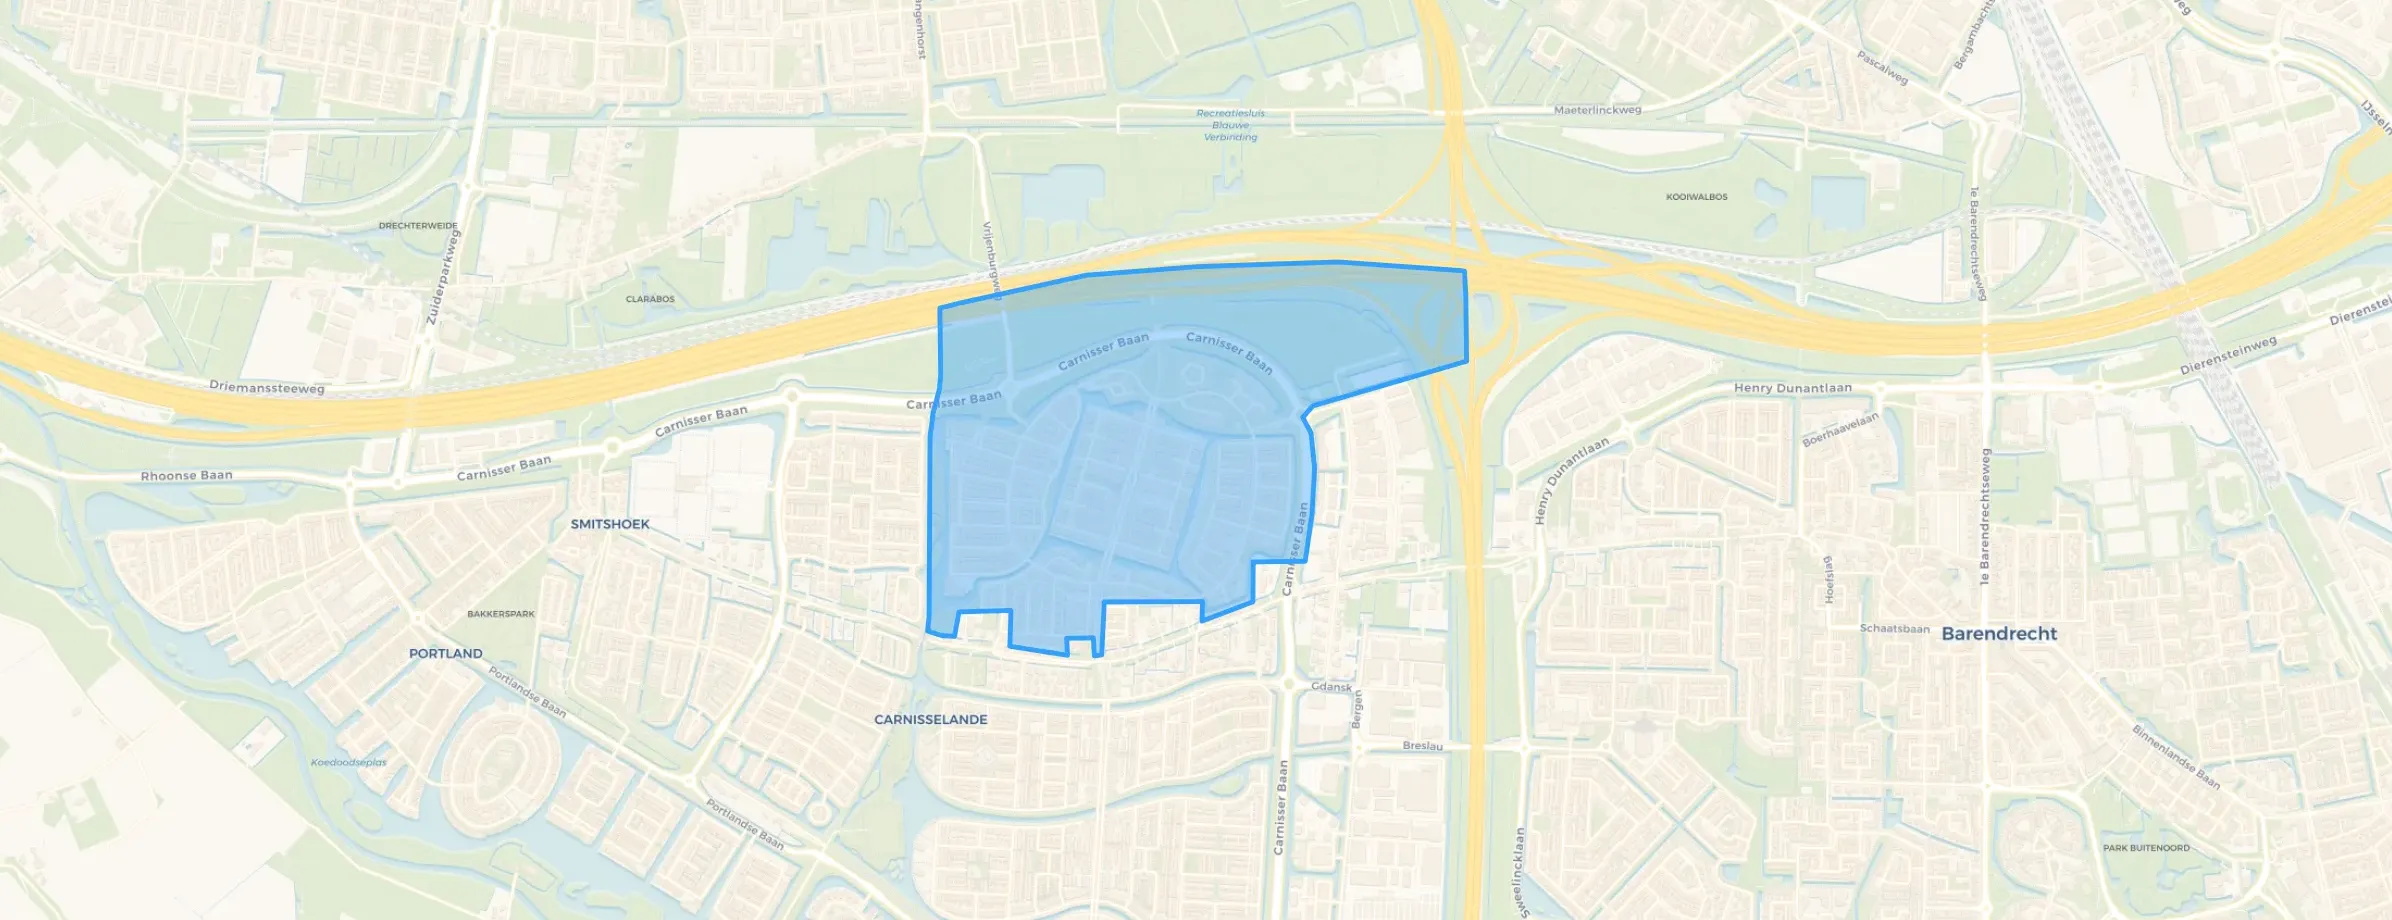
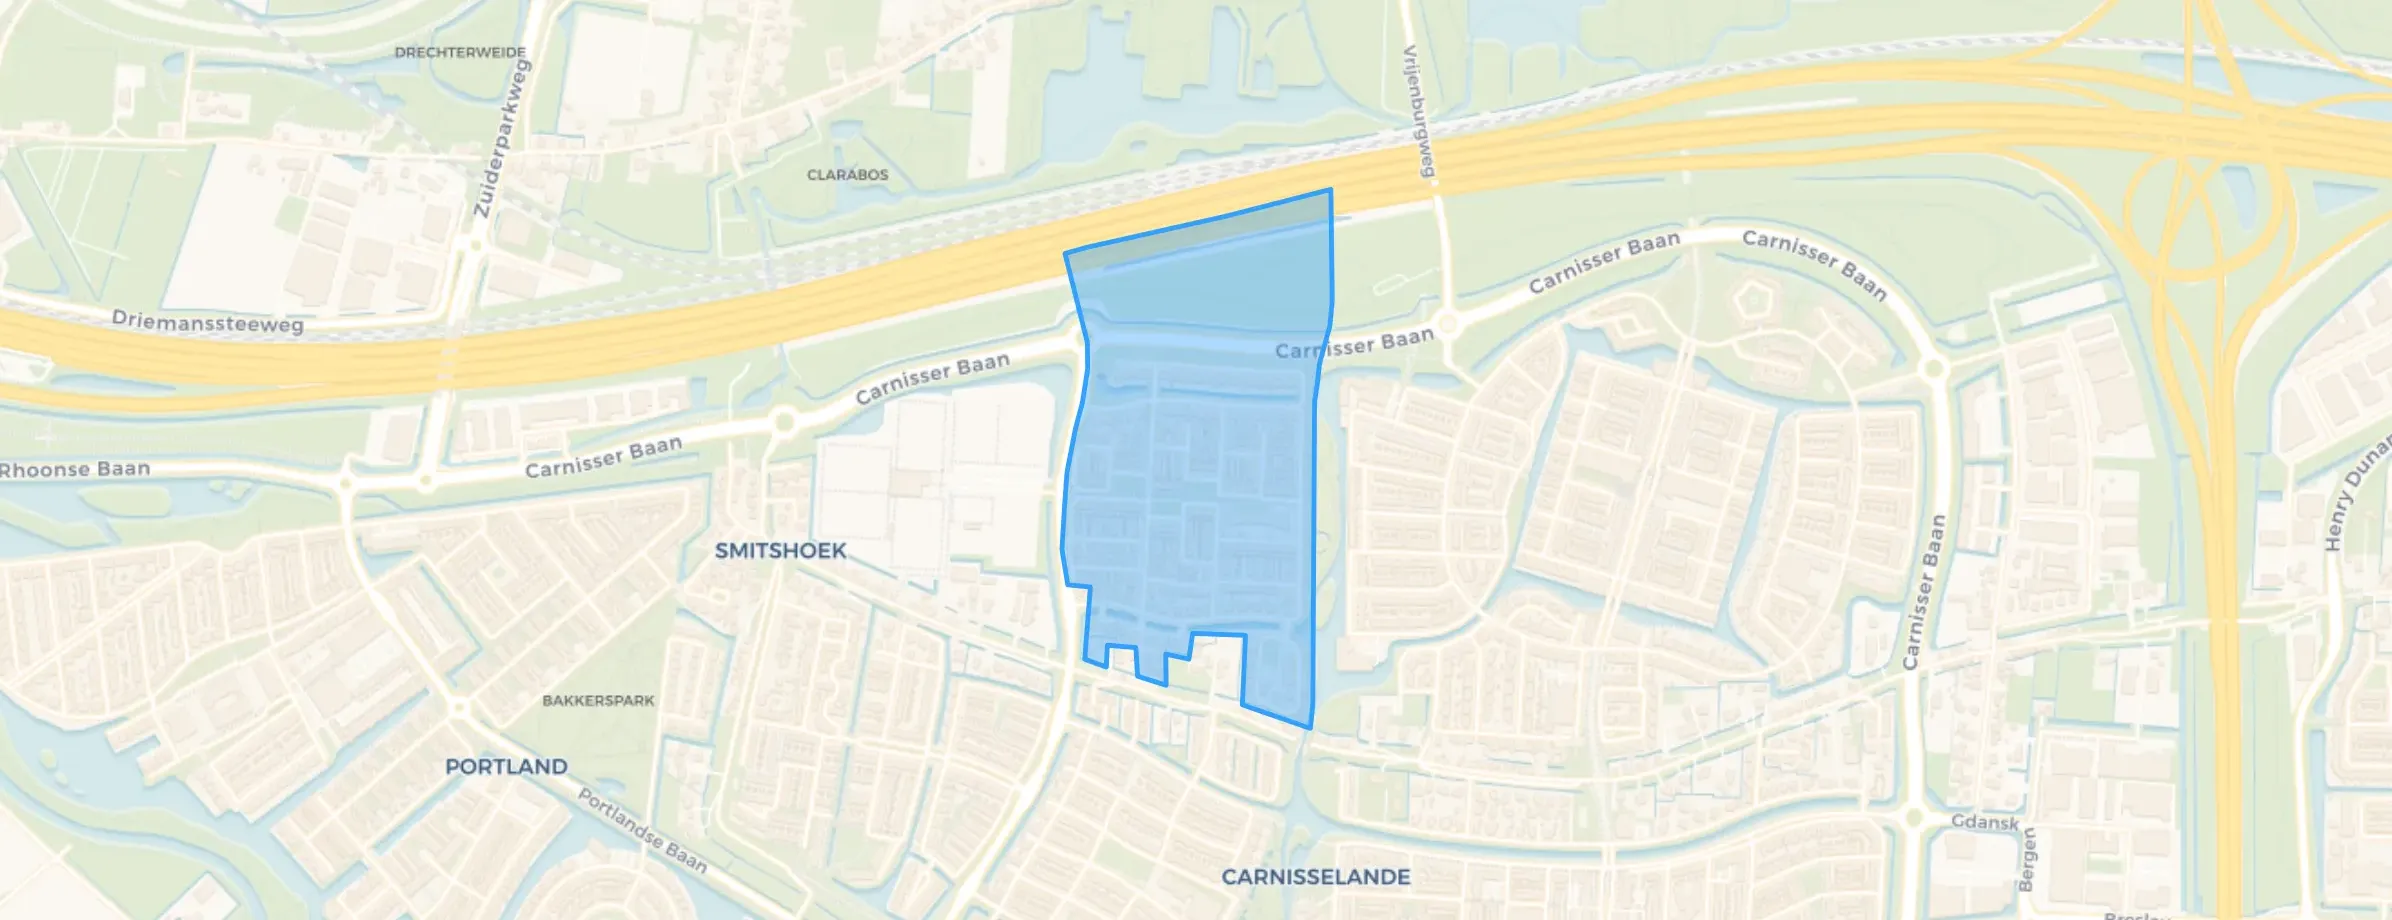
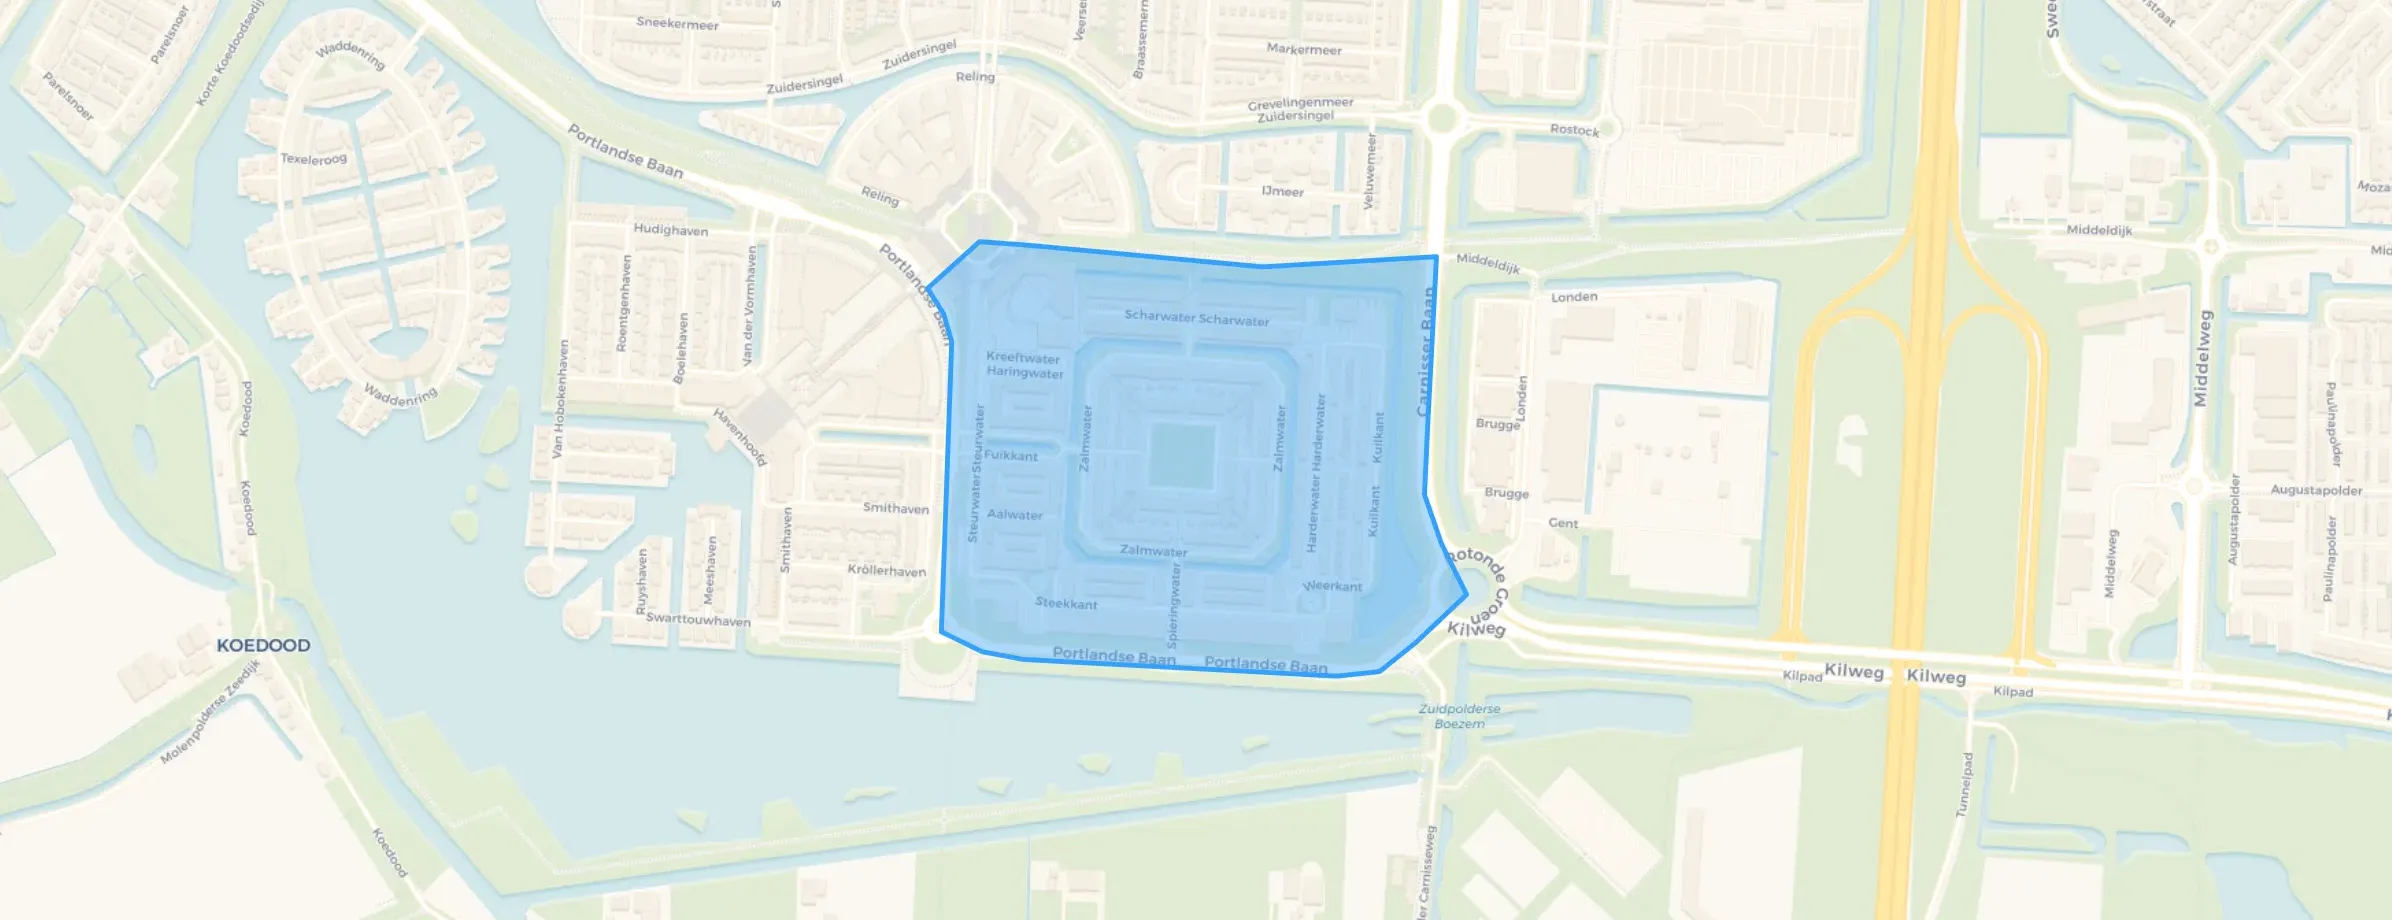
Right after New Year's Eve, everything was cleaned up immediately. A combination of good municipality and neighbourhood cooperation.
Auto-translated to English by AIFriendly people sometimes 1 in between who doesn't
Auto-translated to English by AIPleasant neighbourhood, beautiful houses
Auto-translated to English by AIVery nice neighbourhood, actually never any problems with the neighbours. I have a lot of contact with the neighbours. There are two secondary schools nearby which sometimes cause nuisance, but otherwise everything is great: nice houses, well maintained, and 4 playgrounds within a 3-minute walk, plus the petting zoo.
Auto-translated to English by AIAmazing, really nice neighbours, lots of playgrounds, everything is neat and clean, only sometimes there are loitering youths, really a lot of cosiness and sufficient facilities like wheelie bins and underground containers, there are many trees and grassy fields, there are 3 schools within 100 metres so that's great, only it sometimes causes nuisance, accessibility is also very good
Auto-translated to English by AINeat and friendly
Auto-translated to English by AIA good neighbourhood for people looking for peace and green. The presence of parks gives the area a relaxed and good atmosphere. In addition, there are sufficient amenities, such as schools and shops. Friendly people. I enjoy living here.
Auto-translated to English by AIAlways nice living here. Nothing ever happens and everyone helps each other
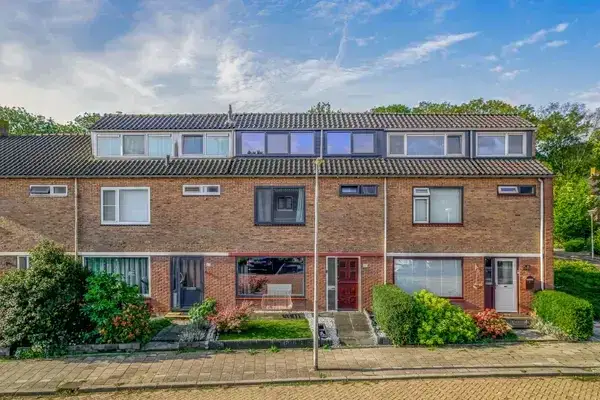
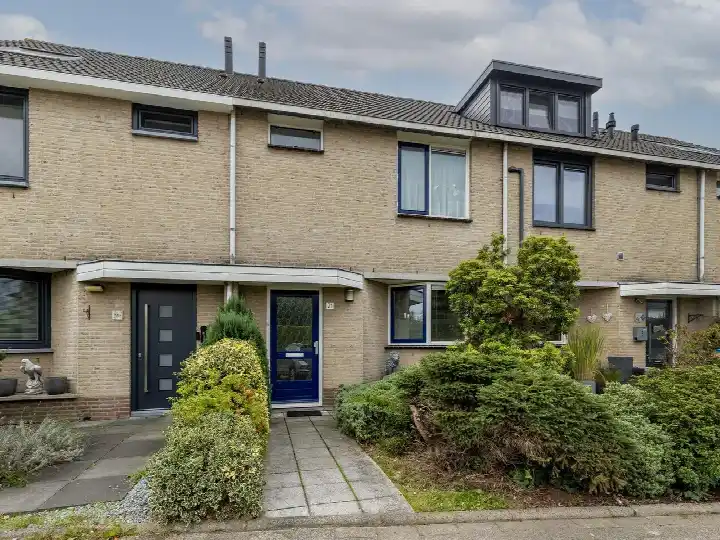
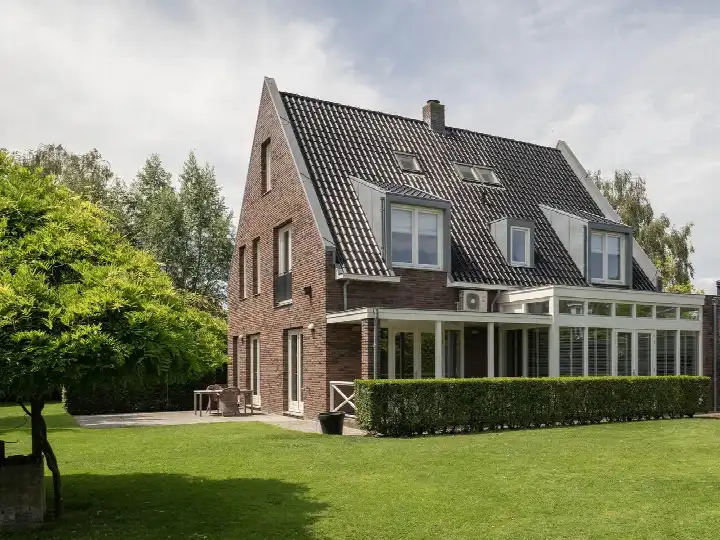
Auto-translated to English by AIThe housing stock is relatively young — 72% dates from after 1990. In addition, the most common type is terraced houses (40%).
Over the past year a home for sale in Barendrecht was listed for an average of €615,508 (€4,498 per m²). That is 16% above the Dutch national average.
A rental home in Barendrecht cost an average of €1,876 per month (€17 per m²). That is 13% below the national average.
Residents give Barendrecht a 8.3 out of 10 based on 10 reviews. Safety stands out with a 8.8; community lags behind with a 6.9.
Gemeente Barendrecht has 48,550 residents. The largest age group is 45 to 65 years (30%). Many families: 43% of the households have children.
The housing supply in Barendrecht is remarkably efficient: 81% has an A, A+ or B label. The average natural gas consumption per household is 760 m³ per year.
From Barendrecht you can on average reach a supermarket at 1.3 km, a GP at 1.4 km, a railway station at 3.8 km, a primary school at 0.9 km (as the crow flies, source: CBS).
Right now you will find 240 homes for sale and 9 homes for rent in Barendrecht.