Give feedback Report a problem
Neighbourhood in De WoldenDe Wijk
Drenthe›De Wolden›De Wijk›De Wijk

Neighbourhood De Wijk

Municipality of De Wolden

De Wijk has 2,660 residentsMost are 65 years or older old
There are 1,258 homes in De WijkCurrently there are 13 for sale and 0 for rent
Energy label A is the most common in De WijkBased on registered homes

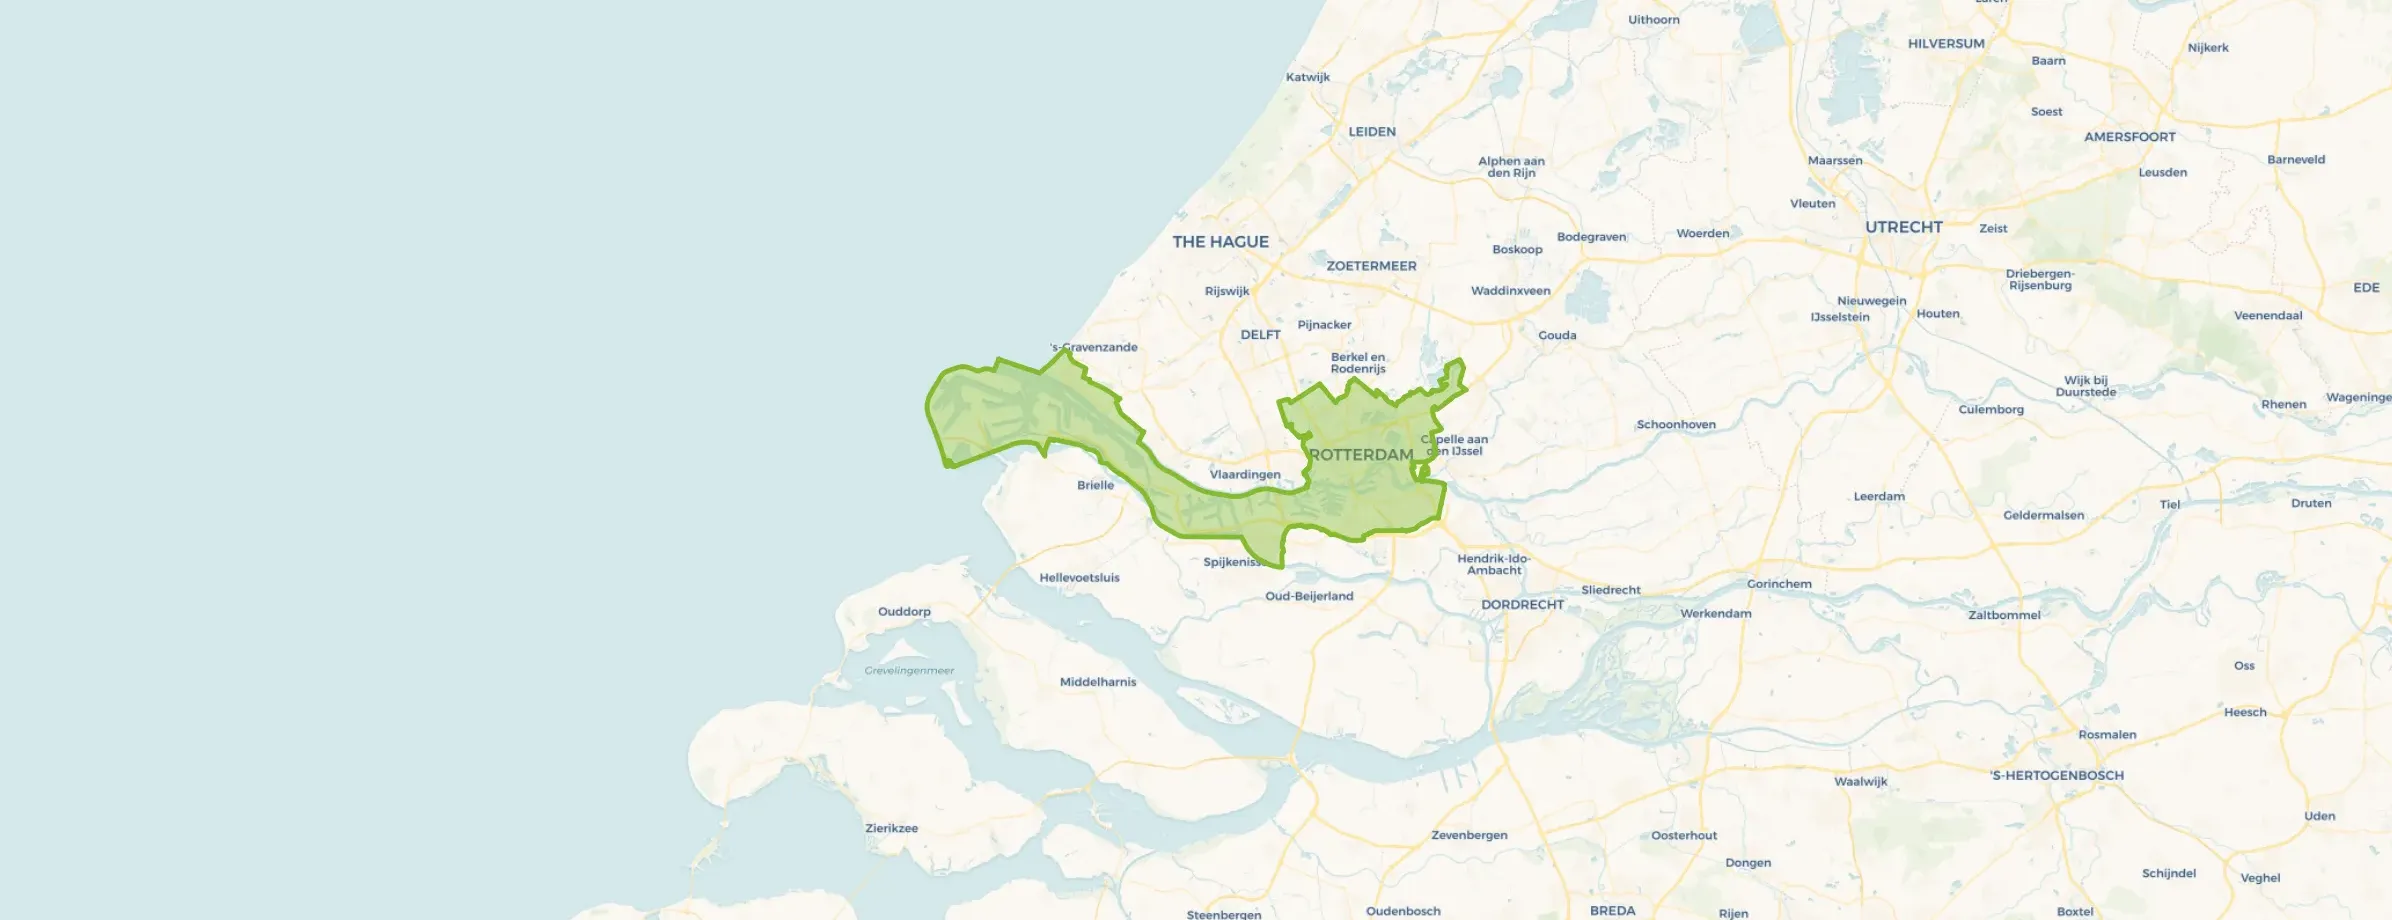
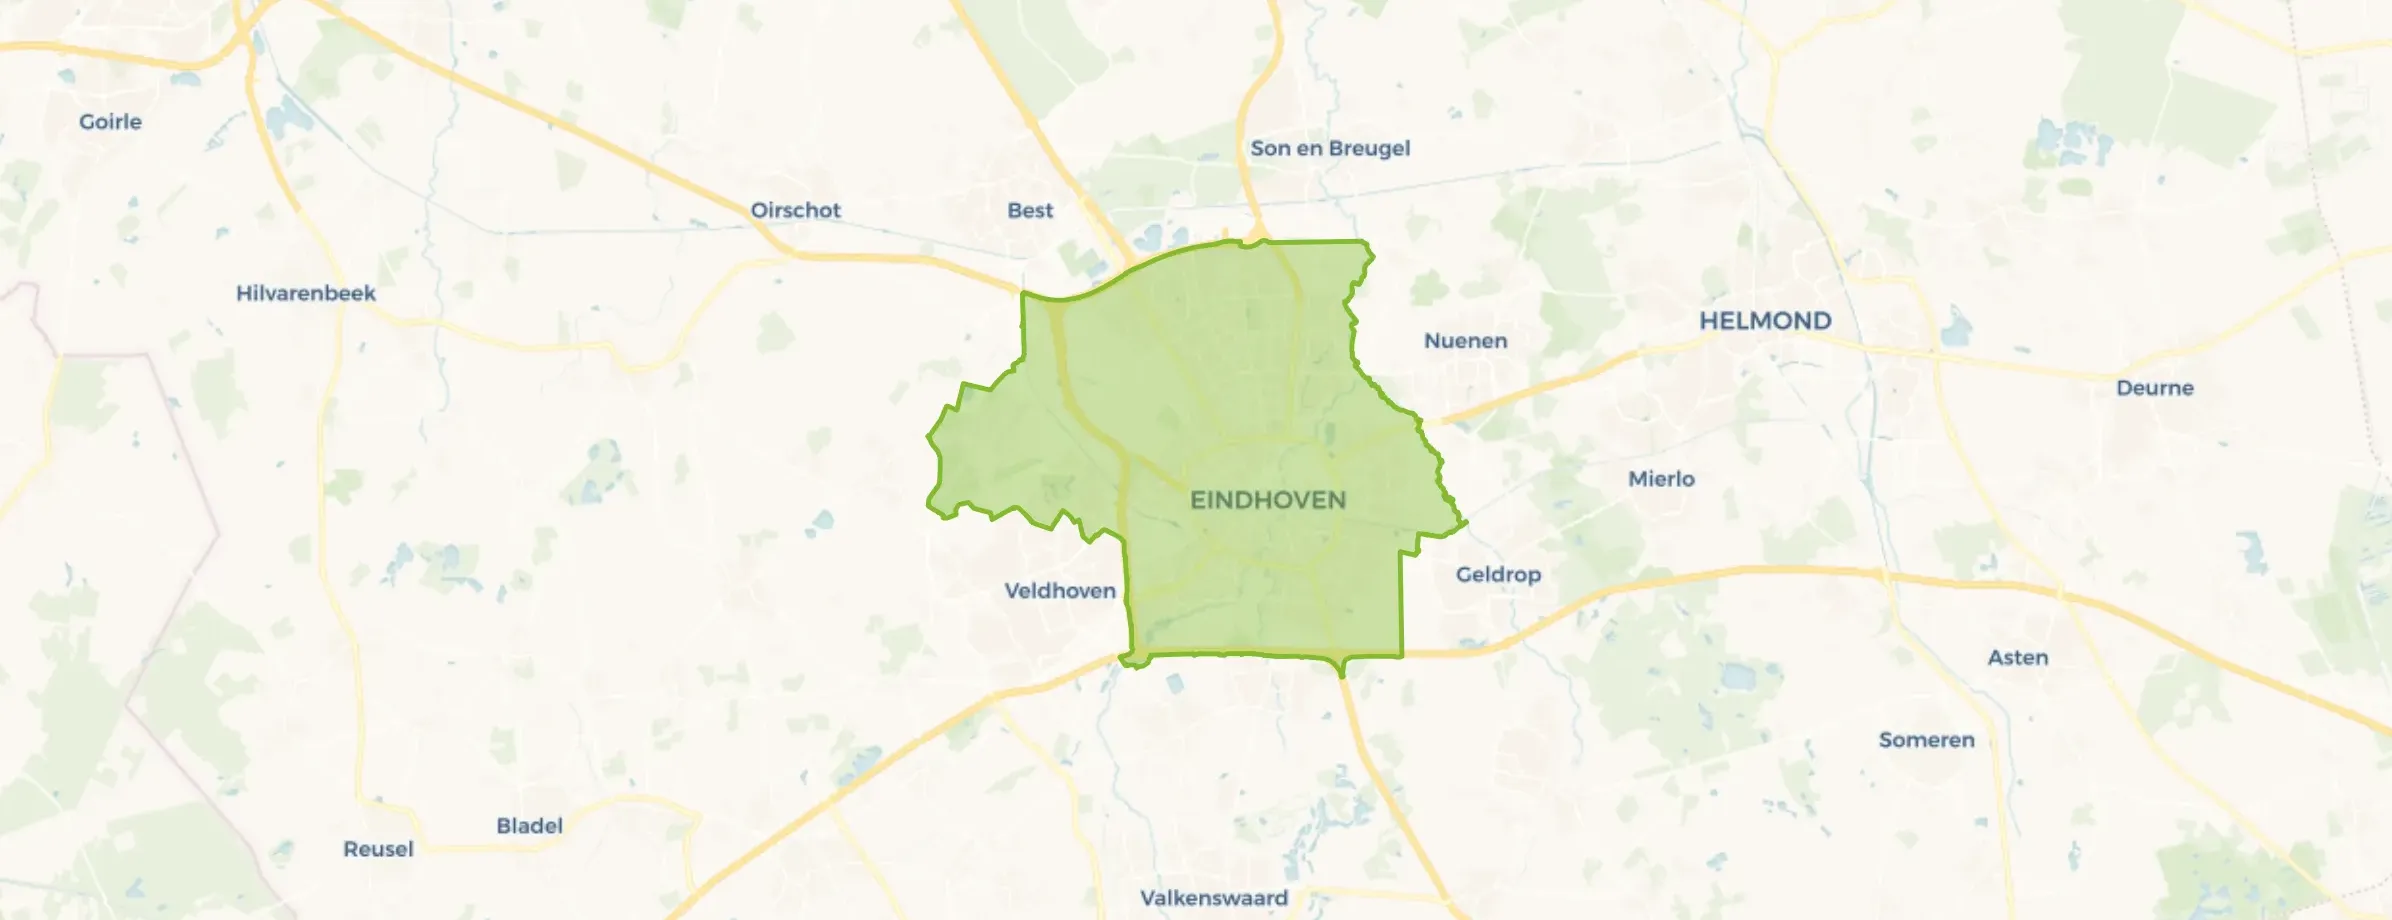
De Wijk is located in the province of Drenthe, in the municipality of De Wolden, in the district De Wijk. The neighbourhood has a total area of 143 hectares, of which 143 hectares are land and 0 hectares are water. The neighbourhood is coded as BU16901300. The postcode area is 7957AA-7957ND.

Residents

De Wijk has 2.660 residents. Of these, 49,6% are men and 50,4% are women. Most residents are 65 years or older (31,4%). The other age groups are 27,4% for '45 to 65 years', 17,7% for '25 to 45 years', 13,5% for '0 to 15 years' and 9,8% for '15 to 25 years'. Of the residents, 39,8% is unmarried, 46,1% is married, 7,3% is divorced and 6,8% is widowed. 2.430 residents originate from the Netherlands, 85 come from Europe and 140 come from countries outside Europe.

There are 1.215 households in De Wijk. 30,0% of these are single-person households, 41,2% households without children and 28,8% households with children. The average household size is 2,2 persons. The national average is 2,1 persons.

In De Wijk there are 2.200 income recipients. The average income per income recipient is €38.200, which is €4.000 (9%) lower than the national average of €42.200. Per resident, the average income is €34.700, which is €200 (1%) lower than the national average of €34.900. Most residents of De Wijk are educated to an intermediate level. 39,7% have an intermediate education (HAVO, VWO or MBO 2-4), 32,8% have a university or higher professional education (HBO/WO) and 27,5% have a lower education (VMBO or MBO 1).

Of the 2.660 residents, around 69% are in paid employment, which amounts to 1.835 people. This is 3% lower than the national average of 72%. The majority of workers are in salaried employment (85%), while 15% are self-employed. In De Wijk, 35% of residents receive a benefit. The largest group is those receiving a state pension (AOW). 770 people receive this benefit.

Housing

In De Wijk there are 1.258 homes with an average assessed value (WOZ) of €372.000. Of these, around 98% are occupied and 2% unoccupied. Most homes are owner-occupied. This amounts to 33% rental homes and 67% owner-occupied homes. Of the homes, 67% privately owned, 25% owned by housing associations and 8% owned by other landlords. The most common construction periods in De Wijk are 1950-1970 (22%) and 1970-1980 (21%).

Homes for sale in De Wijk

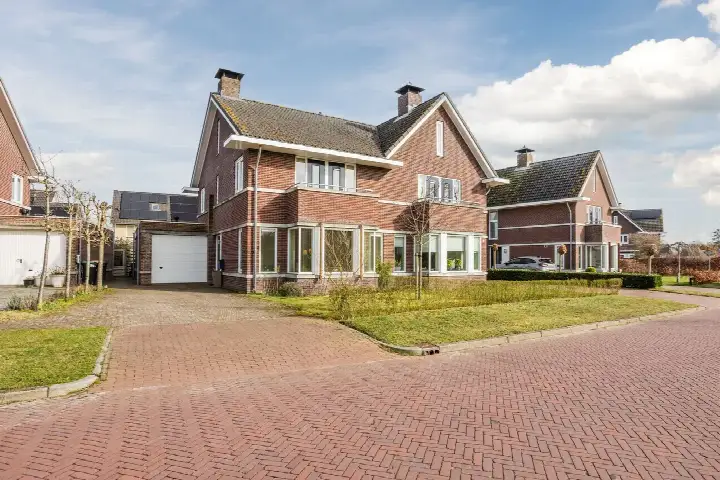
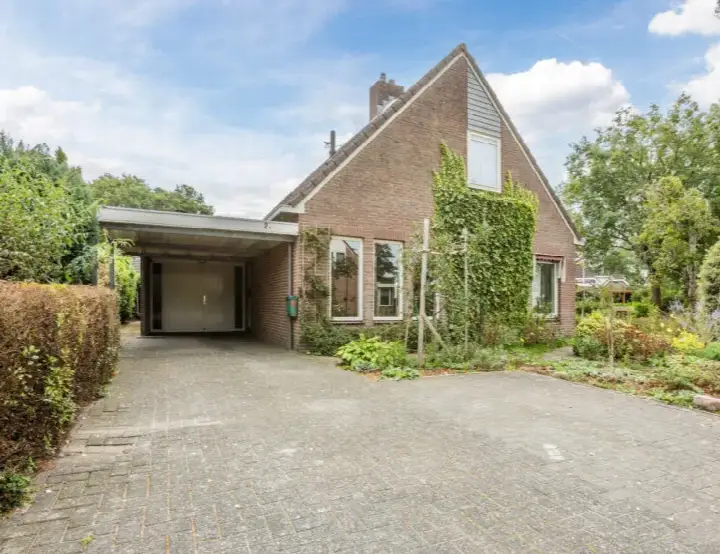
There are currently 13 homes for sale in De Wijk. The most recently listed home is Postweg 43C by Jan Weide Makelaars op Funda. Over the past year, 27 homes were sold in De Wijk. On average, a home was sold within 32 days.

The average asking price for a home for sale in De Wijk over the past year was €471.481. This is 27% higher than the average assessed value (WOZ) of €372.000. The average asking price per m² of floor area is €3.400.

Rental homes in De Wijk

There are currently no homes for rent in De Wijk. The most recent home is Burgemeester De la Saussaye Briëtweg 4, offered by www.thuiskompas.nl. No homes were let in De Wijk over the past year.

No recent rental data available for De Wijk.

Energy

In De Wijk there are 834 addresses with a registered energy label. The most common labels are A (30%), C (21%) and D (15%). On average, an address in De Wijk uses 2.650 kWh of electricity per year. This is 4% above the national average of 2.550 kWh. Natural gas consumption, at 1.020 m³ per year, is 28% above the national average of 800 m³.

Street names

  • Kokkerije
  • Parkweg
  • Slenkenweg
  • Nicolaas ten Woldeweg
  • Broeksteeg
  • Woert
  • Commissieweg
  • Vijverweg
  • De Stobbe
  • De Doelenkamp
  • J.L. Nijsinghweg
  • Struuckweg
  • Kerkweg
  • Oldenhof
  • Oosterwijkerweg
  • Wiltenweg
  • Burgemeester De la Saussaye Briëtweg
  • Nic Ten Woldeweg
  • Secretaris A.W.G. Goldsteinplantsoen
  • Boschstuk
  • Oosterakker
  • Jan Poortmanweg
  • Willem Koopsweg
  • Albert van Kuyckweg
  • Julianaweg
  • Prins Clauslaan
  • Dunningerhof
  • Burgemeester Veenhovenplein
  • Dickningerpad
  • Postweg
  • Secretaris D.J.M.C. Ottermanweg
  • Beatrixweg
  • Luchtenstein
  • Cockserve
  • Haalweidigerweg
  • Hebelenakker
  • Hendrik Tillemaweg
  • Wilhelminaweg
  • Nicolaas Oostinghweg
  • De Vos van Steenwijkstraat
  • Professor Blinkweg
  • Molenstraat
  • De Kaamp
  • Dorpsstraat
  • Emmaweg

Amenities

GP
0,7 km
Pharmacy
0,7 km
Hospital
6,8 km
Supermarket
0,7 km
Railway station
8,5 km
Day nursery
0,4 km
Primary school
0,6 km
Secondary school
8,1 km
Rate De Wijk

Share your opinion and help improve the neighbourhood.

  • Takes less than 2 minutes
  • Help home seekers
  • Improve your neighbourhood
Write a review
–
De Wijk has no ratings yet
Ratings can be submitted via the button below
Write a review
Safety
Housing
Cleanliness
Amenities
Education
Community
Greenery
Accessibility

Statistics about the residents

Ages

Residents per age category

Household composition

Households per category
365Single-person households
500Households without children
350Households with children

Gender

Residents by gender
Men
Women

Marital status

Residents by marital status
Married
Unmarried
Divorced
Widowed

Origin

Residents per category of origin
Netherlands
Europe
Outside Europe

Work & income

Labour participation and average income
€34,700 P.A.average per resident1% below the national average
€38,200 P.A.average per income recipient9% below the national average
85%of the employed are in paid employment
15%of the employed are self-employed
69%
of the residents are employed
72%
is the national average

Education level

Residents per education level
VMBO, MBO 1
HAVO/VWO, MBO 2-4
HBO/WO

Wealth

Median wealth per household
De Wijk
Netherlands

Benefits

Residents per benefit type
Social assistance
Disability
Unemployment

Housing market in De Wijk

Sale price · Q4 2026
€486.786
average▼ 3,1%
€465.000
median▼ 4,1%
7 sales · vs. Q3 2026
€/m² for sale · Q4 2026
€3.769
average▲ 9,0%
€3.811
median▲ 13,8%
-10% vs. national average

Sales market

Market speed and dynamics, last 12 months
32 days ▼ 63,1%
average time listed · vs. last year
27
sales in the past year
151 m²
average living area
-10%
cheaper than the national average

Year built

Age of the housing stock

Energy labels

Sustainability of the housing stock

Living area

Distribution of home sizes

Statistics about the homes

Home types

Addresses per home type

Construction periods

Addresses per construction period

Labels

Addresses per energy label

Energy consumption

Average per address, compared with the Netherlands
Natural gas (m³)
De Wijk
1.020
Netherlands
800
Electricity (kWh)
De Wijk
2.650
Netherlands
2.550

Frequently asked questions about De Wijk

What kind of houses make up De Wijk?

The housing stock is mainly post-war — 54% was built between 1945 and 1990.

What is the average asking price in De Wijk?

Over the past year a home for sale in De Wijk was listed for an average of €471,481 (€3,400 per m²). That is 10% below the Dutch national average.

How is the population of De Wijk composed?

Buurt De Wijk has 2,660 residents. The largest age group is 65+ years (31%).

How far are amenities from De Wijk?

From De Wijk you can on average reach a supermarket at 0.7 km, a GP at 0.7 km, a railway station at 8.5 km, a primary school at 0.6 km (as the crow flies, source: CBS).

How many homes are currently for sale in De Wijk?

Right now you will find 13 homes for sale in De Wijk.

Homes Rate your neighbourhood
Buurtje.nl
Buurtje.nl in the appSearch faster and respond first
Open