Neighbourhood in Amsterdam
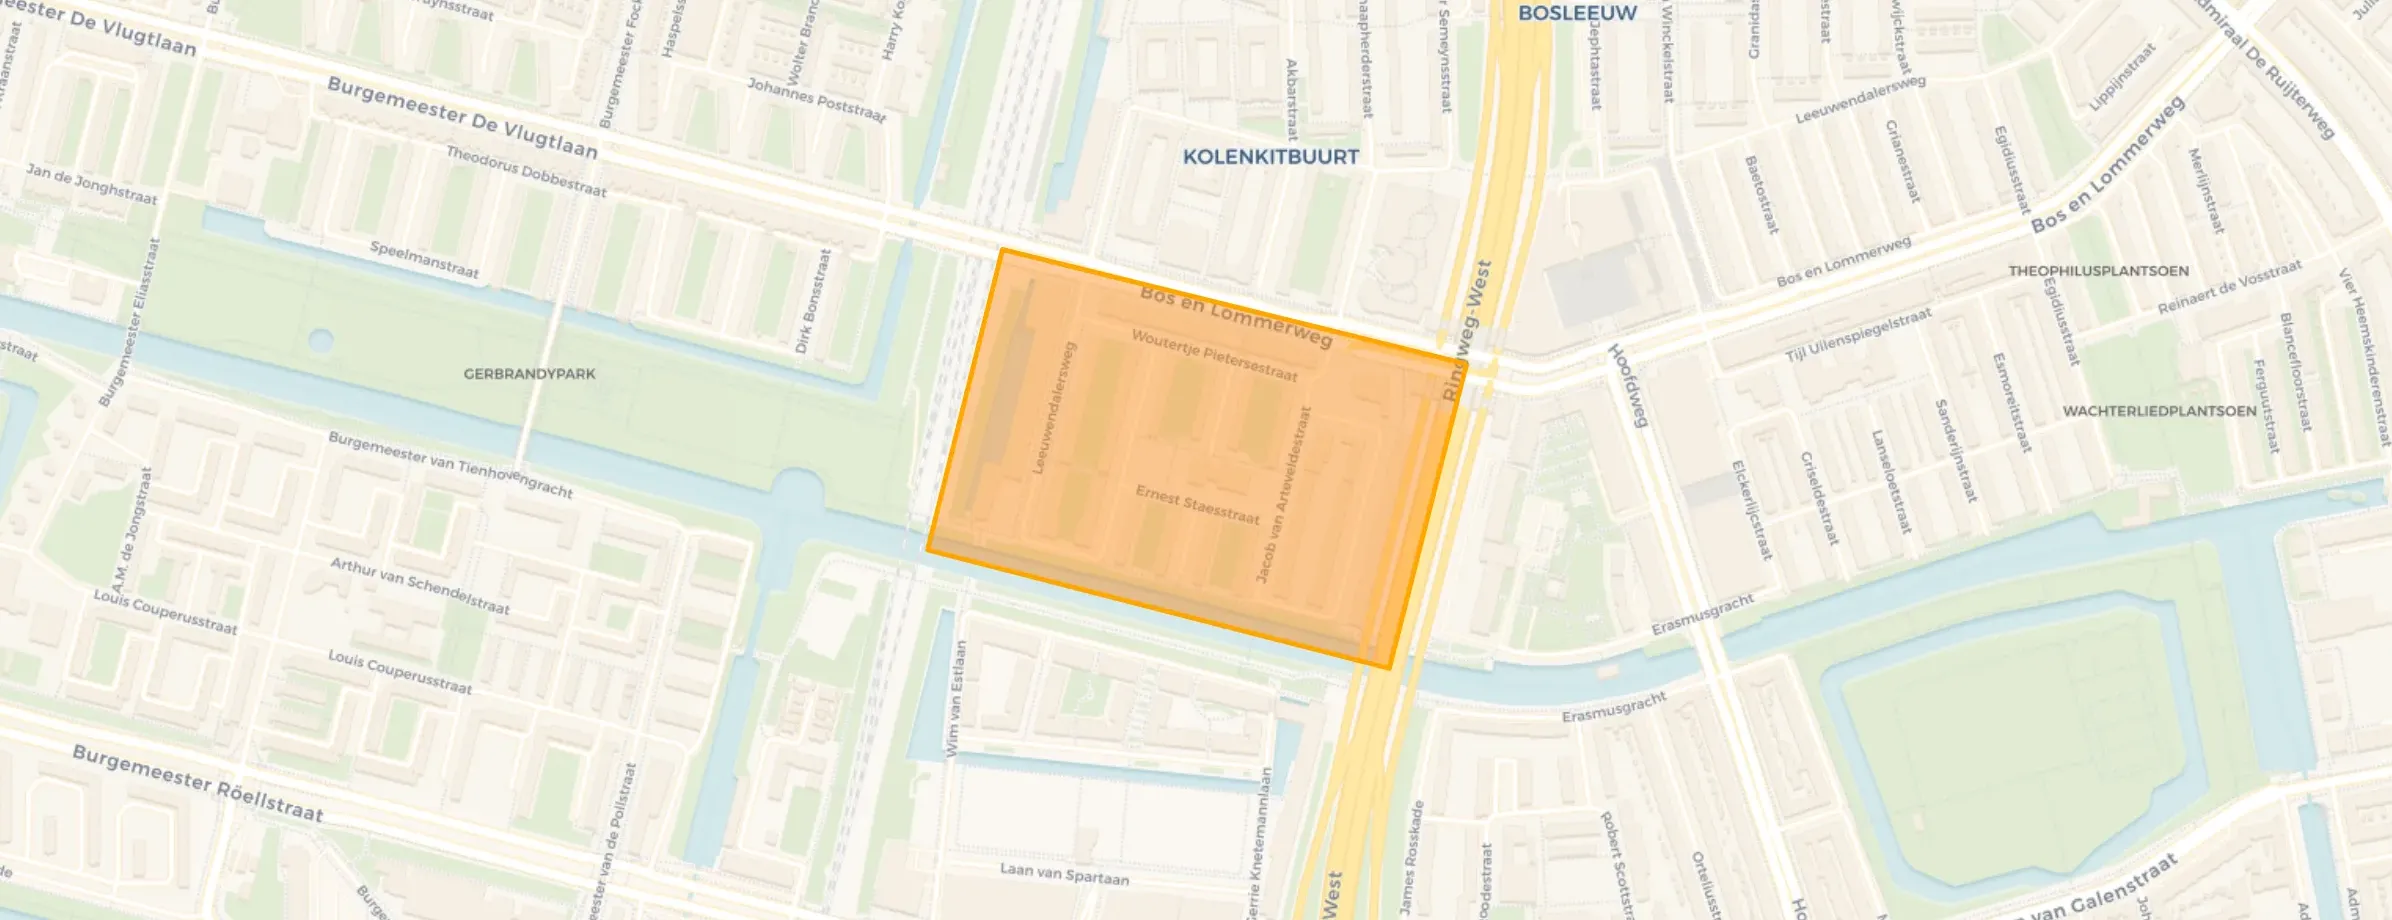
Kolenkitbuurt-Zuid is located in the province of Noord-Holland, in the municipality of Amsterdam, in the district De Kolenkit The neighbourhood has a total area of 13 hectares, of which 12 hectares are land and 1 hectares are water. The neighbourhood is coded as BU0363ED02. The postcode area is 1055RW-1061ZZ.
Three residents rate the neighbourhood as good with a score of 7.4. They describe it as 'My experience is that I am safe and have good neighbours', 'My neighbourhood doesn't work well together' and 'Nice'. Residents experience big differences in this neighbourhood: accessibility, safety, education receive high ratings, while greenery and cleanliness are mentioned as weak points.
Kolenkitbuurt-Zuid has 2.220 residents. Of these, 49,1% are men and 50,9% are women. Most residents are 25 to 45 years (40,1%). The other age groups are 20,7% for '45 to 65 years', 15,1% for '0 to 15 years', 12,8% for '15 to 25 years' and 11,3% for '65 years or older'. Of the residents, 60,4% is unmarried, 29,5% is married, 7,4% is divorced and 2,7% is widowed. 480 residents originate from the Netherlands, 265 come from Europe and 1.470 come from countries outside Europe.
There are 1.075 households in Kolenkitbuurt-Zuid. 47,0% of these are single-person households, 24,7% households without children and 28,4% households with children. The average household size is 2,0 persons. The national average is 2,1 persons.
In Kolenkitbuurt-Zuid there are 1.600 income recipients. The average income per income recipient is €41.200, which is €1.000 (2%) lower than the national average of €42.200. Per resident, the average income is €33.000, which is €1.900 (5%) lower than the national average of €34.900. Most residents of Kolenkitbuurt-Zuid are highly educated. 39,2% have a university or higher professional education (HBO/WO), 35,1% have a lower education (VMBO or MBO 1) and 25,7% have an intermediate education (HAVO, VWO or MBO 2-4).
Of the 2.220 residents, around 67% are in paid employment, which amounts to 1.487 people. This is 5% lower than the national average of 72%. The majority of workers are in salaried employment (82%), while 18% are self-employed. In Kolenkitbuurt-Zuid, 23% of residents receive a benefit. The largest group is those receiving a state pension (AOW). 220 people receive this benefit.
In Kolenkitbuurt-Zuid there are 1.126 homes with an average assessed value (WOZ) of €444.000. Of these, around 92% are occupied and 8% unoccupied. Most homes are rental properties. This amounts to 76% rental homes and 24% owner-occupied homes. Of the homes, 24% privately owned, 65% owned by housing associations and 11% owned by other landlords. The most common construction periods in Kolenkitbuurt-Zuid are 1950-1970 (33%) and 2010-2020 (32%).
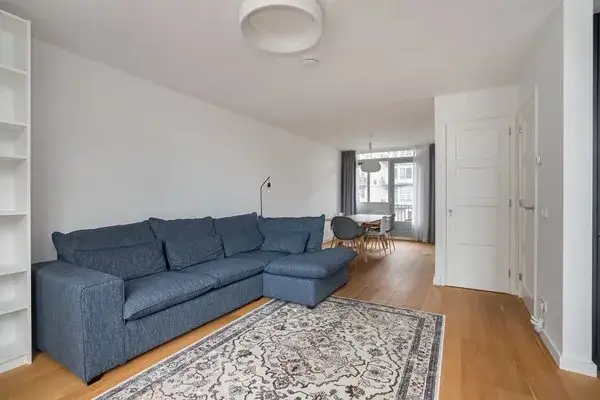
There are currently 6 homes for sale in Kolenkitbuurt-Zuid. The most recently listed home is Leeuwendalersweg 737 by Visch & van Zeggelaar Groot Amsterdam. Over the past year, 67 homes were sold in Kolenkitbuurt-Zuid. On average, a home was sold within 33 days.
The average asking price for a home for sale in Kolenkitbuurt-Zuid over the past year was €581.097. This is 31% higher than the average assessed value (WOZ) of €444.000. The average asking price per m² of plot is €8.673.
There is 1 homes for rent in Kolenkitbuurt-Zuid. The most recent home is Blauwvoetstraat 4H, offered by www.vva.amsterdam. Over the past year, 63 homes were let in Kolenkitbuurt-Zuid. On average, a listing was let within 14 days.
The average rent for a rental home in Kolenkitbuurt-Zuid over the past year was €2.500 per month. Per m² of plot area that is €32 per month.
In Kolenkitbuurt-Zuid there are 904 addresses with a registered energy label. The most common labels are A (78%), A+ (12%) and A++ (3%). On average, an address in Kolenkitbuurt-Zuid uses 1.760 kWh of electricity per year. This is 31% below the national average of 2.550 kWh. With an annual consumption of 190 m³ per address, natural gas consumption is 76% below the national average of 800 m³.
My experience is good
Auto-translated to English by AIMy experience is: that the people don't get along with each other, don't want to make an effort for each other and don't know how to keep your neighbourhood clean and that is the problem of my neighbourhood
Auto-translated to English by AII really like living in Bos en Lommer, it's easily accessible and close to the centre and my school. I never really feel unsafe, even at night, and there's plenty to do. The only thing I regret is that there isn't much nature in the neighbourhood; I wouldn't quickly go for a nice walk, which I did in Friesland. Also, it's not always very clean, there's a lot of litter on the ground.
Auto-translated to English by AIThe housing stock is mainly post-war — 50% was built between 1945 and 1990. In addition, the most common type is flats (100%).
Over the past year a home for sale in Kolenkitbuurt-Zuid was listed for an average of €583,977 (€6,961 per m²).
A rental home in Kolenkitbuurt-Zuid cost an average of €2,130 per month (€29 per m²).
Residents give Kolenkitbuurt-Zuid a 7.4 out of 10 based on 3 reviews. Especially accessibility (9.7) scores well; cleanliness (5.3) receives the lowest rating.
Buurt Kolenkitbuurt-Zuid has 2,220 residents. The largest age group is 25 to 45 years (40%).
The housing supply in Kolenkitbuurt-Zuid is remarkably efficient: 95% has an A, A+ or B label. The average natural gas consumption per household is 190 m³ per year.
From Kolenkitbuurt-Zuid you can on average reach a supermarket at 0.2 km, a GP at 0.4 km, a railway station at 2.7 km, a primary school at 0.4 km (as the crow flies, source: CBS).