Neighbourhood in Eindhoven
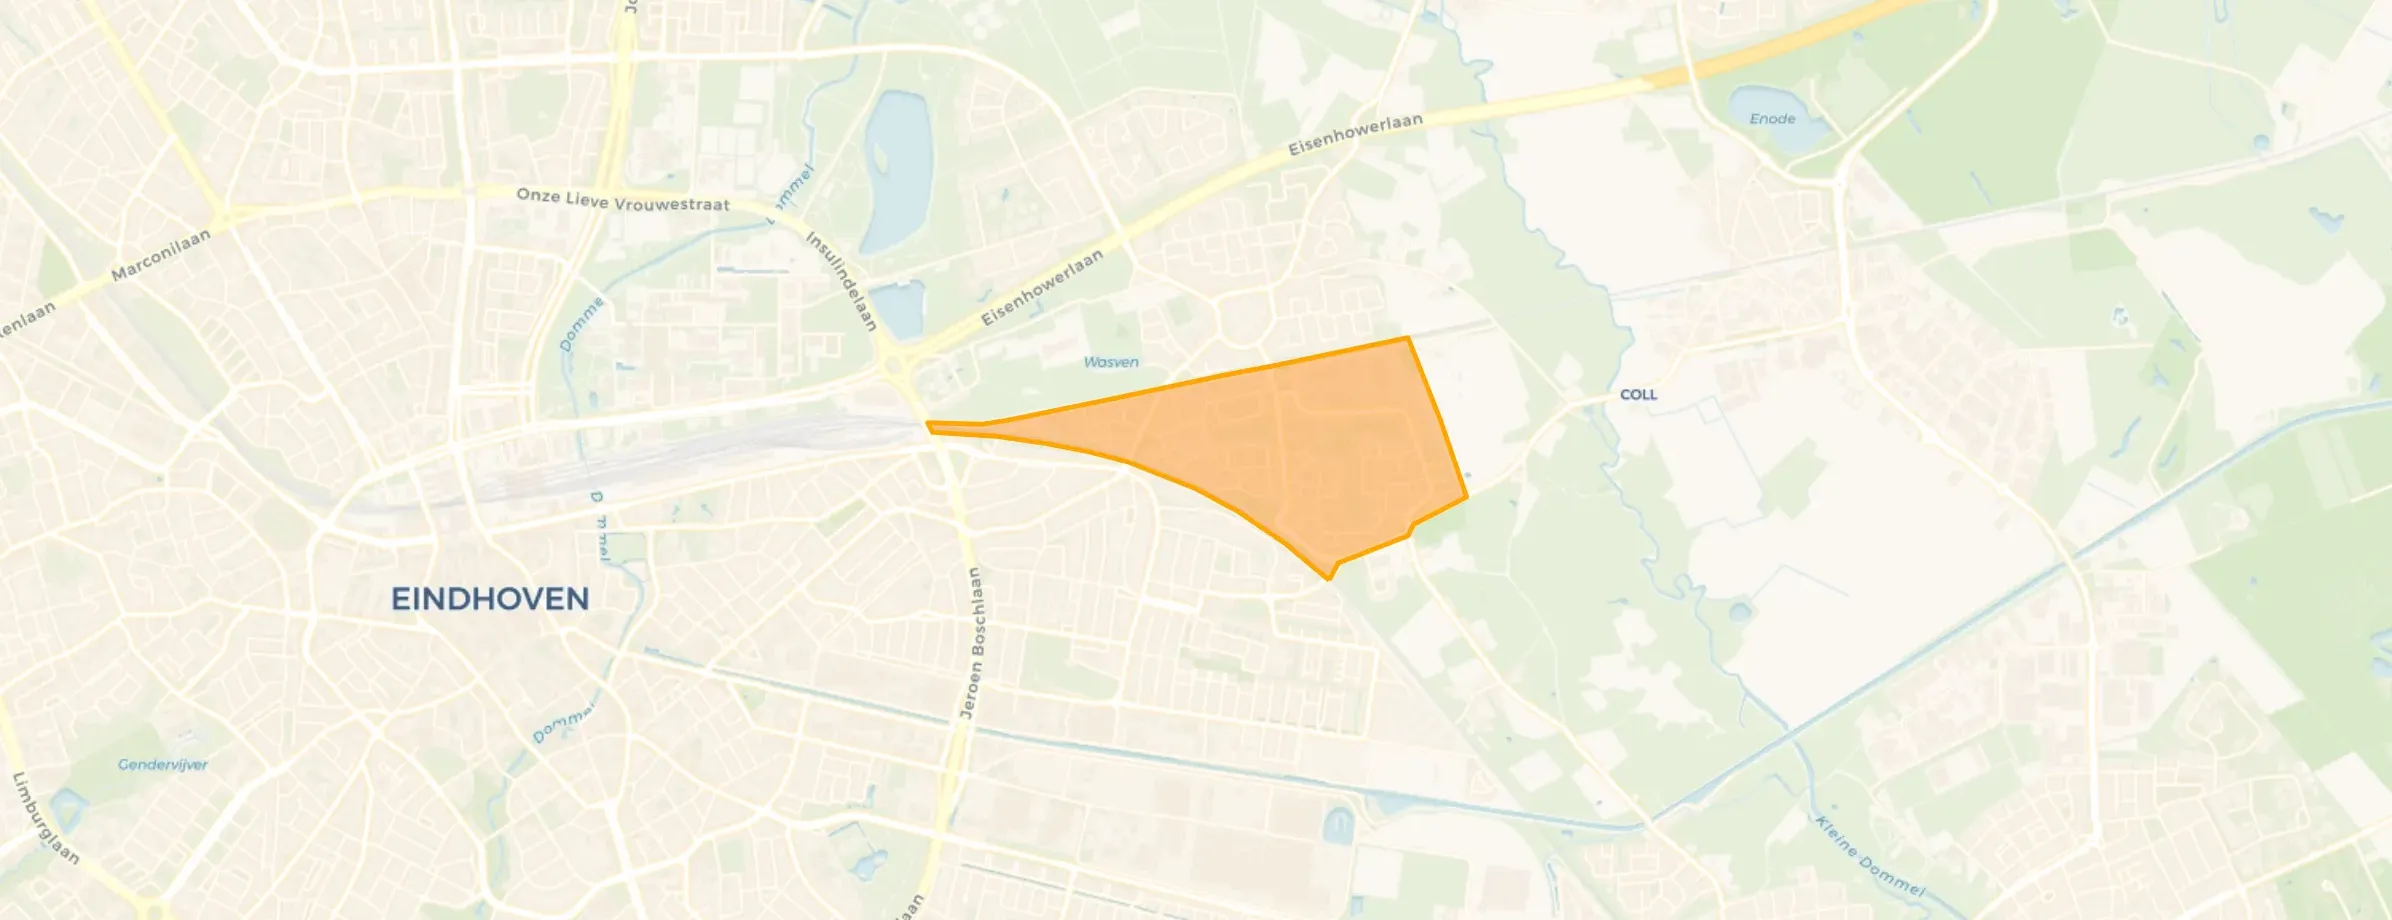
Muschberg Geestenberg is located in the province of Noord-Brabant, in the municipality of Eindhoven, in the district Oud-Tongelre The neighbourhood has a total area of 77 hectares, of which 77 hectares are land and 0 hectares are water. The neighbourhood is coded as BU07723330. The postcode area is 5641AV-5641WZ.
Three residents rate the neighbourhood as good with a score of 7.0. They describe it as 'Simple, but Fine', 'Safe neighbourhood' and 'Tongelre'. Aspects such as greenery, safety, community are rated well in this neighbourhood, while education and accessibility score less well.
Muschberg Geestenberg has 4.010 residents. Of these, 51,9% are men and 48,0% are women. Most residents are 25 to 45 years (31,0%). The other age groups are 23,8% for '45 to 65 years', 18,2% for '65 years or older', 13,6% for '0 to 15 years' and 13,3% for '15 to 25 years'. Of the residents, 54,5% is unmarried, 32,2% is married, 9,9% is divorced and 3,6% is widowed. 2.200 residents originate from the Netherlands, 540 come from Europe and 1.265 come from countries outside Europe.
There are 2.100 households in Muschberg Geestenberg. 48,1% of these are single-person households, 24,8% households without children and 27,1% households with children. The average household size is 1,9 persons. The national average is 2,1 persons.
In Muschberg Geestenberg there are 3.300 income recipients. The average income per income recipient is €36.400, which is €5.800 (14%) lower than the national average of €42.200. Per resident, the average income is €30.600, which is €4.300 (12%) lower than the national average of €34.900. Most residents of Muschberg Geestenberg are educated to an intermediate level. 39,9% have an intermediate education (HAVO, VWO or MBO 2-4), 33,8% have a lower education (VMBO or MBO 1) and 26,3% have a university or higher professional education (HBO/WO).
Of the 4.010 residents, around 67% are in paid employment, which amounts to 2.687 people. This is 5% lower than the national average of 72%. The majority of workers are in salaried employment (88%), while 12% are self-employed. In Muschberg Geestenberg, 27% of residents receive a benefit. The largest group is those receiving a state pension (AOW). 650 people receive this benefit.
In Muschberg Geestenberg there are 1.898 homes with an average assessed value (WOZ) of €341.000. Of these, around 97% are occupied and 3% unoccupied. In Muschberg Geestenberg there are roughly as many rental as owner-occupied homes. This amounts to 53% rental homes and 47% owner-occupied homes. Of the homes, 47% privately owned, 44% owned by housing associations and 9% owned by other landlords. The most common construction periods in Muschberg Geestenberg are 1970-1980 (77%) and 1980-1990 (5%).
There are currently 19 homes for sale in Muschberg Geestenberg. The most recently listed home is Laar 11 by Hoeks Makelaardij. Over the past year, 116 homes were sold in Muschberg Geestenberg. On average, a home was sold within 47 days.
The average asking price for a home for sale in Muschberg Geestenberg over the past year was €419.703. This is 23% higher than the average assessed value (WOZ) of €341.000. The average asking price per m² of plot is €3.305.
There are currently no homes for rent in Muschberg Geestenberg. The most recent home is Urkhovenseweg 198, offered by www.wooniezie.nl. Over the past year, 42 homes were let in Muschberg Geestenberg. On average, a listing was let within 43 days.
No recent rental data available for Muschberg Geestenberg.
In Muschberg Geestenberg there are 1.622 addresses with a registered energy label. The most common labels are C (37%), B (18%) and A (18%). On average, an address in Muschberg Geestenberg uses 2.230 kWh of electricity per year. This is 13% below the national average of 2.550 kWh. Natural gas consumption, at 830 m³ per year, is 4% above the national average of 800 m³.
I've been living here for a year now, and it's an affordable place to live in Eindhoven. Clearly a lower-income household area, but definitely safe and pleasant. Supermarkets are always nearby; I personally would have liked more recreational facilities, such as sports. I'm also quite disappointed in the accessibility by public transport. There is only one bus in my neighbourhood, which runs only once an hour during many parts of the day. It only goes to the station. I would have liked to see more buses with different routes and destinations running more frequently. There is plenty of green space in principle, which is very nice, but I would have liked to see more larger walking areas with routes, especially on the edge of the city.
Auto-translated to English by AII can just walk safely on the street at night, I never had that feeling in Woensel Zuid (Kronehoeve). Many families live here, a few students. You're in nature in no time, lovely place to live.
Auto-translated to English by AITongelre is a quiet neighbourhood and a pleasant neighbourhood.
Auto-translated to English by AIThe housing stock is mainly post-war — 89% was built between 1945 and 1990. In addition, the most common type is terraced houses (51%).
Over the past year a home for sale in Muschberg Geestenberg was listed for an average of €421,059 (€3,624 per m²). That is 20% below the Dutch national average.
Residents give Muschberg Geestenberg a 7.0 out of 10 based on 3 reviews. Especially nature and greenery (7.7) scores well; accessibility (5.7) receives the lowest rating.
Buurt Muschberg Geestenberg has 4,010 residents. The largest age group is 25 to 45 years (31%).
From Muschberg Geestenberg you can on average reach a supermarket at 0.6 km, a GP at 0.8 km, a railway station at 3.1 km, a primary school at 0.9 km (as the crow flies, source: CBS).
Right now you will find 24 homes for sale and 1 homes for rent in Muschberg Geestenberg.