Neighbourhood in Rotterdam
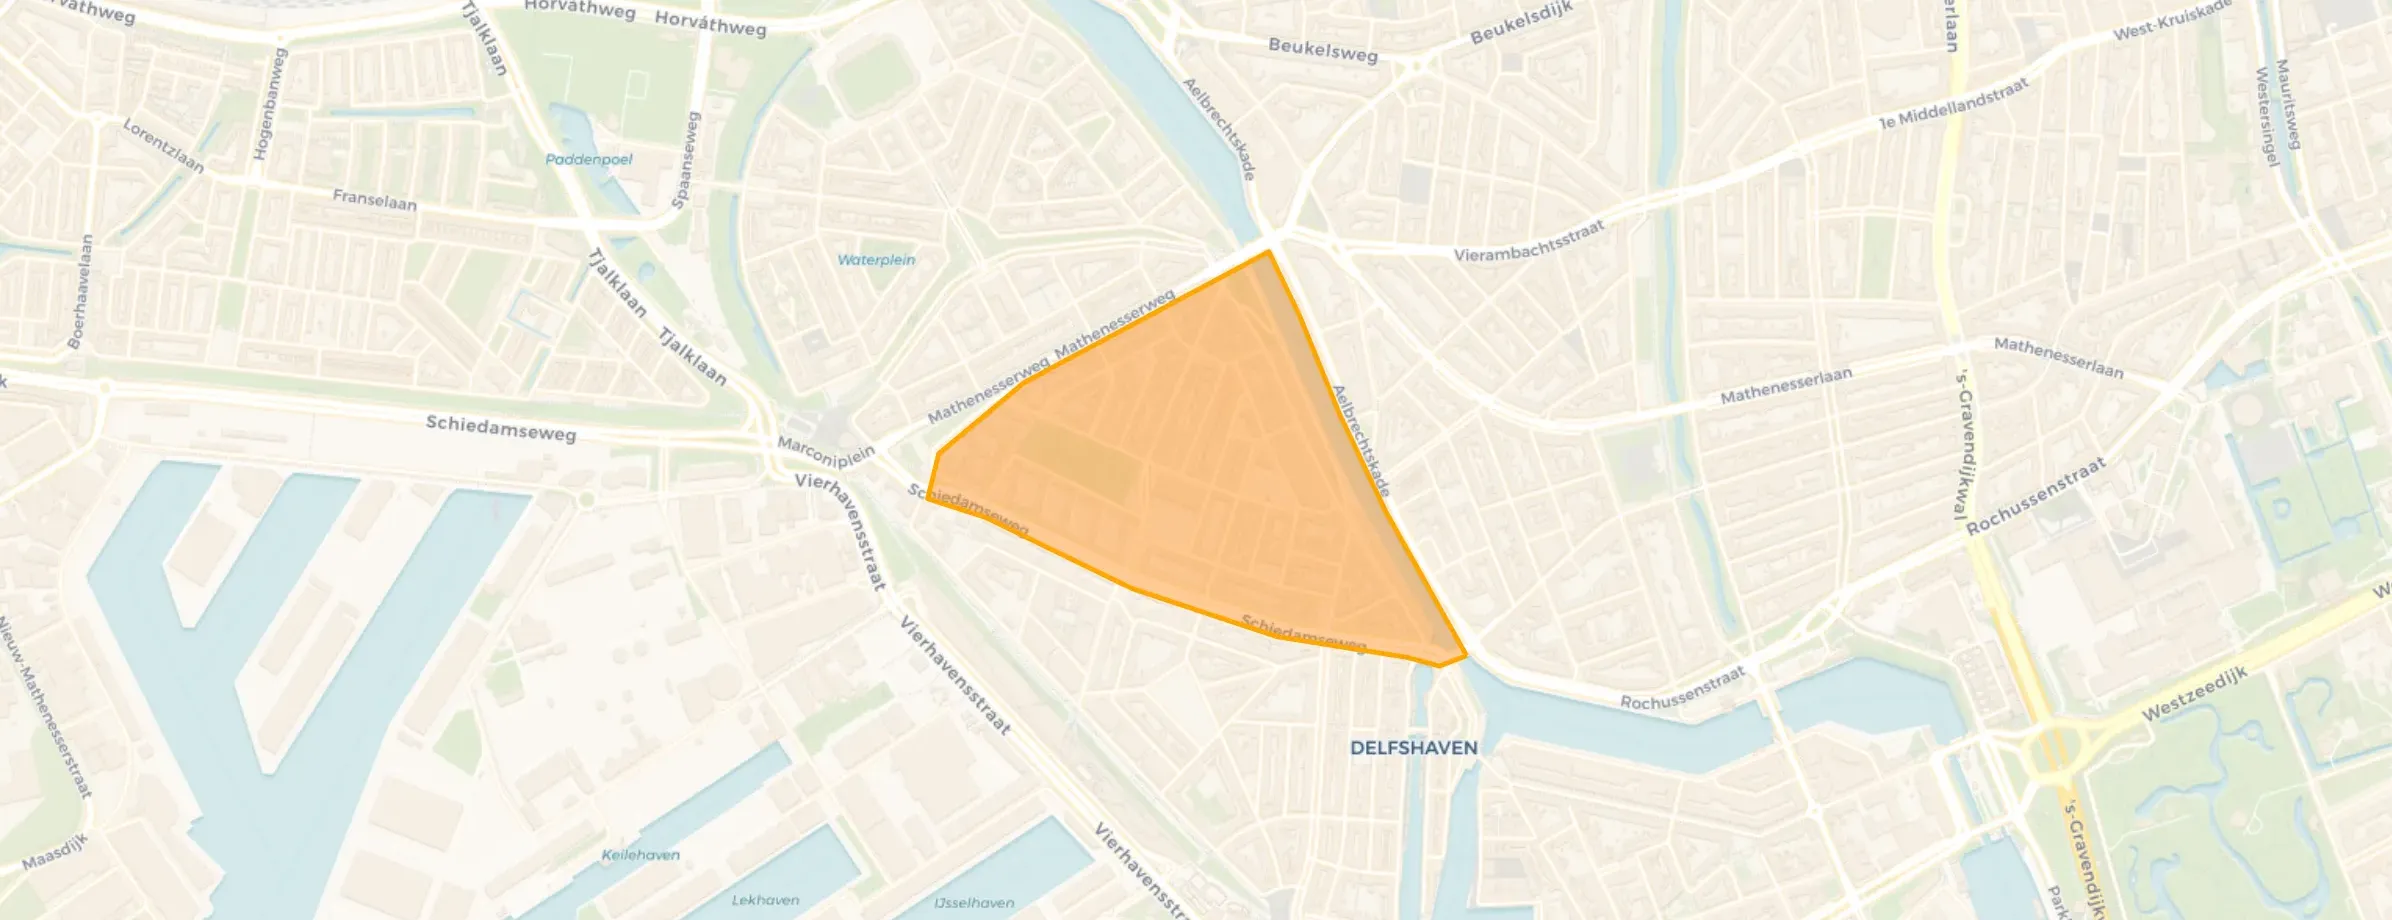
Tussendijken is located in the province of Zuid-Holland, in the municipality of Rotterdam, in the district Delfshaven The neighbourhood has a total area of 40 hectares, of which 37 hectares are land and 3 hectares are water. The neighbourhood is coded as BU05990322. The postcode area is 3024TH-3026XS.
Three residents rate the neighbourhood as more than satisfactory with a score of 6.2. They describe it as 'It's a child-friendly neighbourhood', 'Nice neighbourhood' and 'Cosy'. Aspects such as accessibility, education, safety are rated well in this neighbourhood, while cleanliness and greenery score less well.
Tussendijken has 7.370 residents. Of these, 50,6% are men and 49,5% are women. Most residents are 25 to 45 years (34,5%). The other age groups are 23,2% for '45 to 65 years', 15,0% for '15 to 25 years', 14,8% for '0 to 15 years' and 12,6% for '65 years or older'. Of the residents, 63,3% is unmarried, 22,8% is married, 11,1% is divorced and 2,8% is widowed. 1.590 residents originate from the Netherlands, 1.040 come from Europe and 4.735 come from countries outside Europe.
There are 3.885 households in Tussendijken. 55,0% of these are single-person households, 17,1% households without children and 27,9% households with children. The average household size is 1,9 persons. The national average is 2,1 persons.
In Tussendijken there are 5.900 income recipients. The average income per income recipient is €30.900, which is €11.300 (27%) lower than the national average of €42.200. Per resident, the average income is €25.100, which is €9.800 (28%) lower than the national average of €34.900. Most residents of Tussendijken are educated to a lower level. 38,9% have a lower education (VMBO or MBO 1), 31,3% have an intermediate education (HAVO, VWO or MBO 2-4) and 29,9% have a university or higher professional education (HBO/WO).
Of the 7.370 residents, around 59% are in paid employment, which amounts to 4.348 people. This is 13% lower than the national average of 72%. The majority of workers are in salaried employment (80%), while 20% are self-employed. In Tussendijken, 27% of residents receive a benefit. The largest group is those receiving a state pension (AOW). 800 people receive this benefit.
In Tussendijken there are 3.560 homes with an average assessed value (WOZ) of €262.000. Of these, around 94% are occupied and 6% unoccupied. Most homes are rental properties. This amounts to 86% rental homes and 14% owner-occupied homes. Of the homes, 14% privately owned, 59% owned by housing associations and 27% owned by other landlords. The most common construction periods in Tussendijken are 1925-1950 (30%) and 1950-1970 (25%).
There are currently 22 homes for sale in Tussendijken. The most recently listed home is Grote Visserijstraat 58B by D&S Makelaardij Schiedam. Over the past year, 144 homes were sold in Tussendijken. On average, a home was sold within 63 days.
The average asking price for a home for sale in Tussendijken over the past year was €371.747. This is 42% higher than the average assessed value (WOZ) of €262.000. The average asking price per m² of plot is €4.085.
There are 10 homes for rent in Tussendijken. The most recent home is Schiedamseweg 109-01, offered by Expat Quality Housing. Over the past year, 118 homes were let in Tussendijken. On average, a listing was let within 17 days.
The average rent for a rental home in Tussendijken over the past year was €2.469 per month. Per m² of plot area that is €19 per month.
In Tussendijken there are 3.191 addresses with a registered energy label. The most common labels are A (36%), C (25%) and B (15%). On average, an address in Tussendijken uses 1.900 kWh of electricity per year. This is 25% below the national average of 2.550 kWh. With an annual consumption of 610 m³ per address, natural gas consumption is 24% below the national average of 800 m³.
My neighbourhood is a nice, cosy and multicultural neighbourhood where many different people live together. There are many children, which creates a lively and cheerful atmosphere; it's always nice to see them playing outside. There is a cosy little square in the neighbourhood where many people gather with their children, especially in summer, which creates a real sense of community. Everyone knows each other a bit, and that makes living here pleasant. In the evening it can sometimes be a bit busier and livelier because of young people gathering outside, but overall the atmosphere is good and the neighbourhood feels safe and cosy. All in all, it's a nice neighbourhood with lots of life, diversity and togetherness.
Auto-translated to English by AISince I've been living here for about 6 years, I notice that it's a vibrant neighbourhood. Compared to other neighbourhoods, there is a lot of diversity. There are many amenities in the area and everything is within walking distance, which is nice.
Auto-translated to English by AIIt's a cosy neighbourhood with lots of children. I just find it dangerous to walk around in the evening in this neighbourhood.
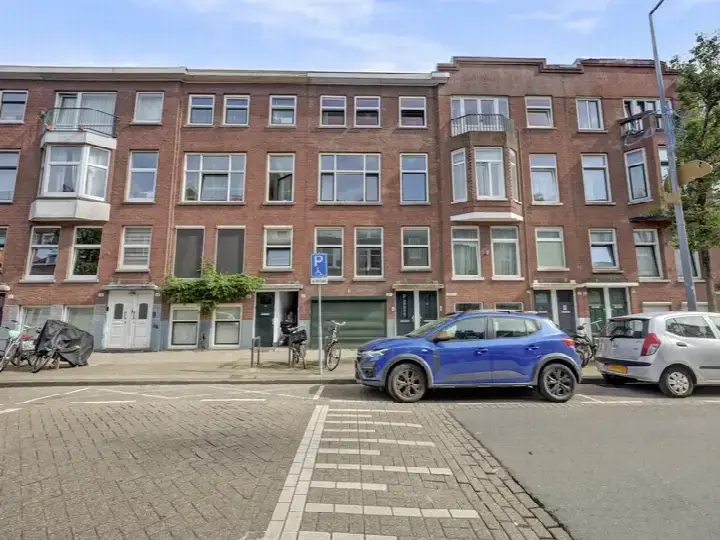
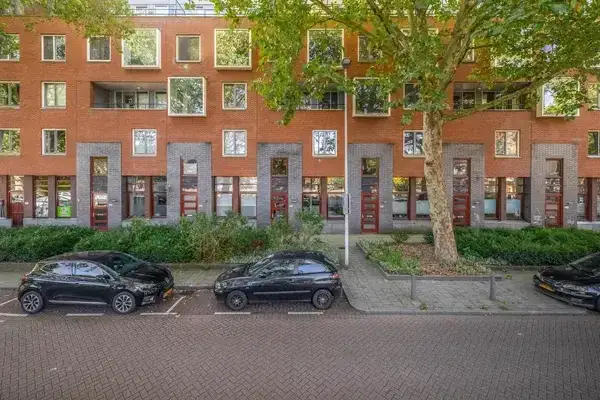
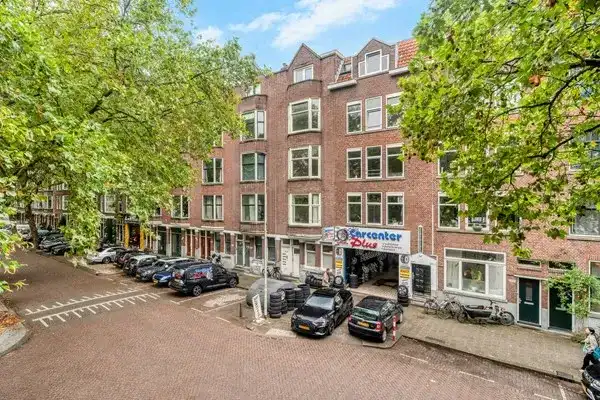
Auto-translated to English by AIThe housing stock is predominantly pre-war — 70% of the homes date from before 1945. In addition, the most common type is flats (98%).
Over the past year a home for sale in Tussendijken was listed for an average of €378,462 (€4,548 per m²). That is 28% below the Dutch national average. Last quarter prices rose by 56%.
A rental home in Tussendijken cost an average of €1,929 per month (€17 per m²). That is 11% below the national average.
Residents give Tussendijken a 6.2 out of 10 based on 3 reviews. Accessibility stands out with a 8.0; nature and greenery lags behind with a 5.0.
Buurt Tussendijken has 7,370 residents. The largest age group is 25 to 45 years (34%). Notably, 55% of the households are single-person households.
The housing supply in Tussendijken is remarkably efficient: 58% has an A, A+ or B label. The average natural gas consumption per household is 610 m³ per year.
From Tussendijken you can on average reach a supermarket at 0.7 km, a GP at 0.4 km, a railway station at 2.6 km, a primary school at 0.4 km (as the crow flies, source: CBS).
Right now you will find 25 homes for sale and 13 homes for rent in Tussendijken.