Neighbourhood in Horst aan de Maas
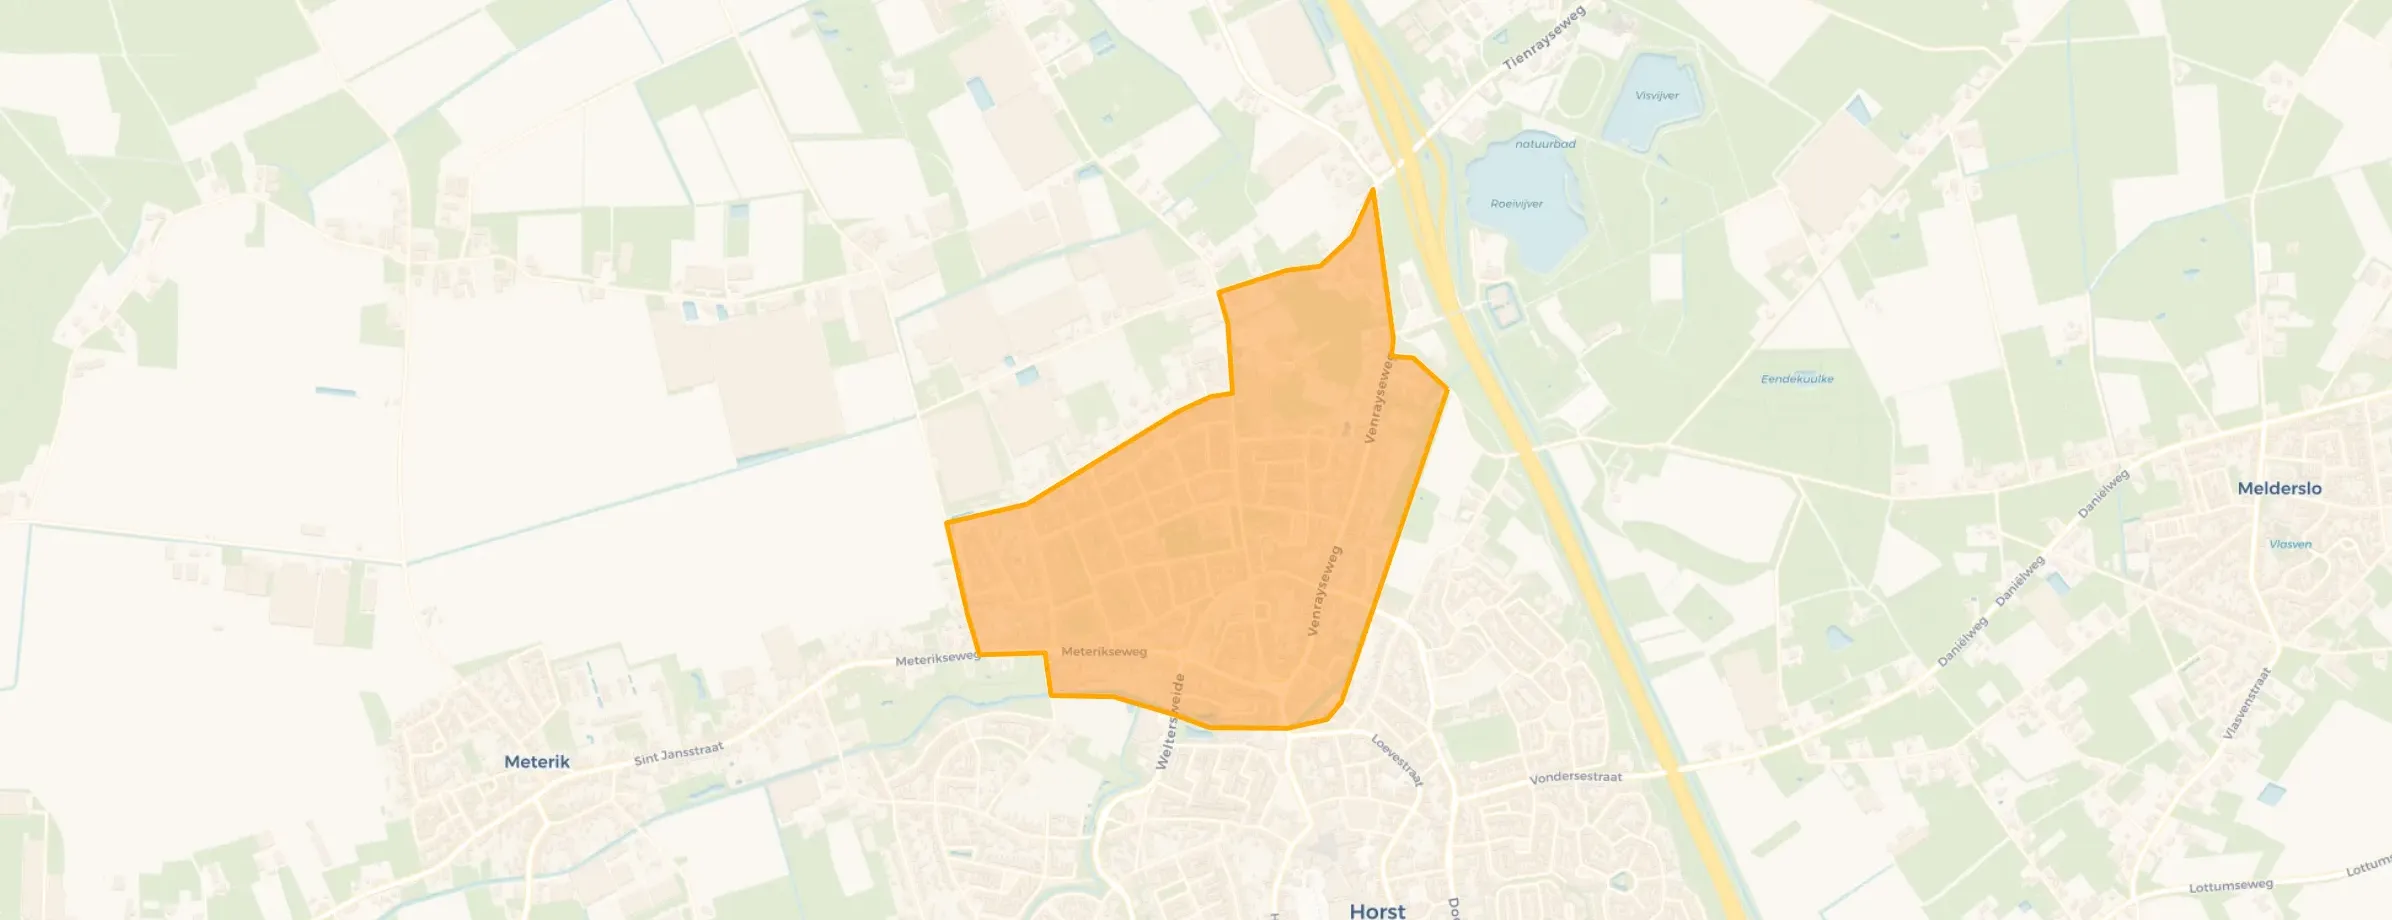
Molenveld is located in the province of Limburg, in the municipality of Horst aan de Maas, in the district Horst The neighbourhood has a total area of 81 hectares, of which 81 hectares are land and 0 hectares are water. The neighbourhood is coded as BU15070401. The postcode area is 5961AC-5961XZ.
Two residents rate the neighbourhood as well below par with a score of 2.3. They describe it as 'stay away from this neighbourhood' and 'Lots of nuisance in the area'. Based on a limited number of reviews, no clear trends are visible yet in this neighbourhood.
Molenveld has 2.625 residents. Of these, 50,3% are men and 49,5% are women. Most residents are 25 to 45 years (25,3%). The other age groups are 25,1% for '65 years or older', 24,8% for '45 to 65 years', 12,8% for '0 to 15 years' and 11,8% for '15 to 25 years'. Of the residents, 47,2% is unmarried, 38,3% is married, 7,8% is divorced and 6,7% is widowed. 2.120 residents originate from the Netherlands, 290 come from Europe and 215 come from countries outside Europe.
There are 1.250 households in Molenveld. 38,4% of these are single-person households, 30,4% households without children and 31,2% households with children. The average household size is 2,1 persons. The national average is 2,1 persons.
In Molenveld there are 2.200 income recipients. The average income per income recipient is €33.400, which is €8.800 (21%) lower than the national average of €42.200. Per resident, the average income is €31.200, which is €3.700 (11%) lower than the national average of €34.900. Most residents of Molenveld are educated to an intermediate level. 42,3% have an intermediate education (HAVO, VWO or MBO 2-4), 34,9% have a lower education (VMBO or MBO 1) and 22,8% have a university or higher professional education (HBO/WO).
Of the 2.625 residents, around 76% are in paid employment, which amounts to 1.995 people. This is 4% higher than the national average of 72%. The majority of workers are in salaried employment (89%), while 11% are self-employed. In Molenveld, 29% of residents receive a benefit. The largest group is those receiving a state pension (AOW). 590 people receive this benefit.
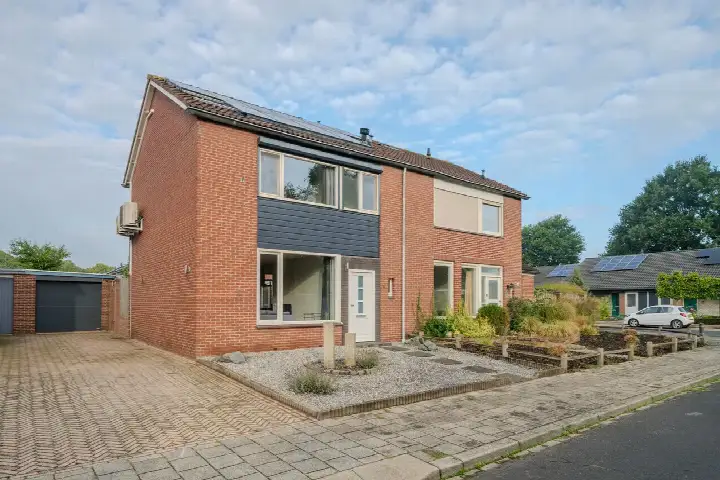
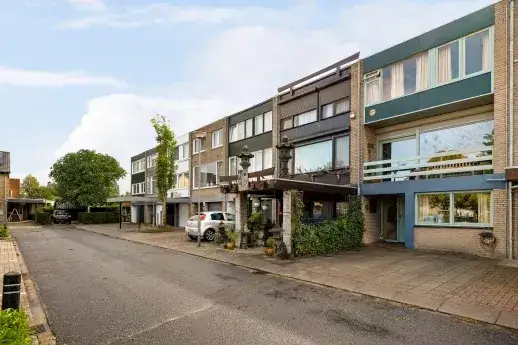
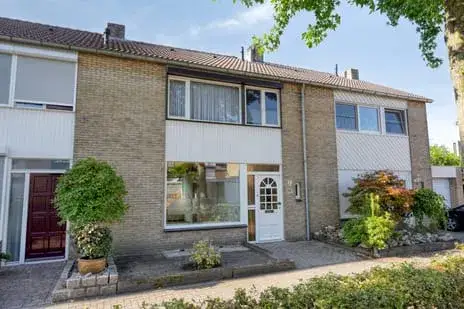
In Molenveld there are 1.224 homes with an average assessed value (WOZ) of €329.000. Of these, around 97% are occupied and 3% unoccupied. Most homes are owner-occupied. This amounts to 36% rental homes and 64% owner-occupied homes. Of the homes, 64% privately owned, 29% owned by housing associations and 7% owned by other landlords. The most common construction periods in Molenveld are 1950-1970 (62%) and 1970-1980 (18%).
There are currently 6 homes for sale in Molenveld. The most recently listed home is Frans Halsstraat 4 by Vandaag Makelaars. Over the past year, 47 homes were sold in Molenveld. On average, a home was sold within 47 days.
The average asking price for a home for sale in Molenveld over the past year was €507.351. This is 54% higher than the average assessed value (WOZ) of €329.000. The average asking price per m² of plot is €4.193.
There are currently no homes for rent in Molenveld. The most recent home is Noordsingel 110, offered by www.thuisinlimburg.nl. Over the past year, 3 homes were let in Molenveld. On average, a listing was let within 23 days.
No recent rental data available for Molenveld.
In Molenveld there are 766 addresses with a registered energy label. The most common labels are A (41%), C (22%) and B (15%). On average, an address in Molenveld uses 2.710 kWh of electricity per year. This is 6% above the national average of 2.550 kWh. Natural gas consumption, at 970 m³ per year, is 21% above the national average of 800 m³.
I give this neighbourhood a failing grade on several important aspects. Safety feels limited due to persistent nuisance and lack of supervision. The community is not close-knit; many residents move away quickly or pass away, resulting in little social cohesion. Hygiene leaves much to be desired. There is often rubbish on the streets and public spaces are poorly maintained. Housing is also of poor quality. Many homes are in bad condition, with deferred maintenance and conditions reminiscent of slums. Furthermore, the living environment is unpleasant due to constant noise pollution and air pollution. The lack of greenery and an attractive natural environment makes the neighbourhood even less pleasant to live in. All in all, this is an area where the quality of life is low and improvement is needed in many areas. Due to the poor living conditions, noise pollution and pollution, I recommend considering another neighbourhood. Avoid this area if you value peace, safety and a clean living environment.
Auto-translated to English by AIFar too much nuisance in this street and area. Too busy roads with noise pollution and stench. Loitering youths shouting their heads off, even at night. Playground with screaming kids, early in the morning, when you couldn't sleep at night due to other nuisance. Lots of loud music, parties weekly in the area, continuing late into the night. Stench of tar or similar from farmers, businesses. Difficulty breathing or airing out the house. Restaurant with many car visitors, also nuisance from exhaust fumes, slamming car doors, loud talking. The house is very poorly insulated. All in all, an enclave of extremely poor living. Neighbour nuisance doesn't help either, weird Dutch people and their rotten characters. It destroys you as a person. I'm already looking for something else. There is no peace here and no healthy green environment. This requires a total renovation which the municipality and landlord don't want to do, just milk the citizen and drop dead.
Auto-translated to English by AI