District in Weert
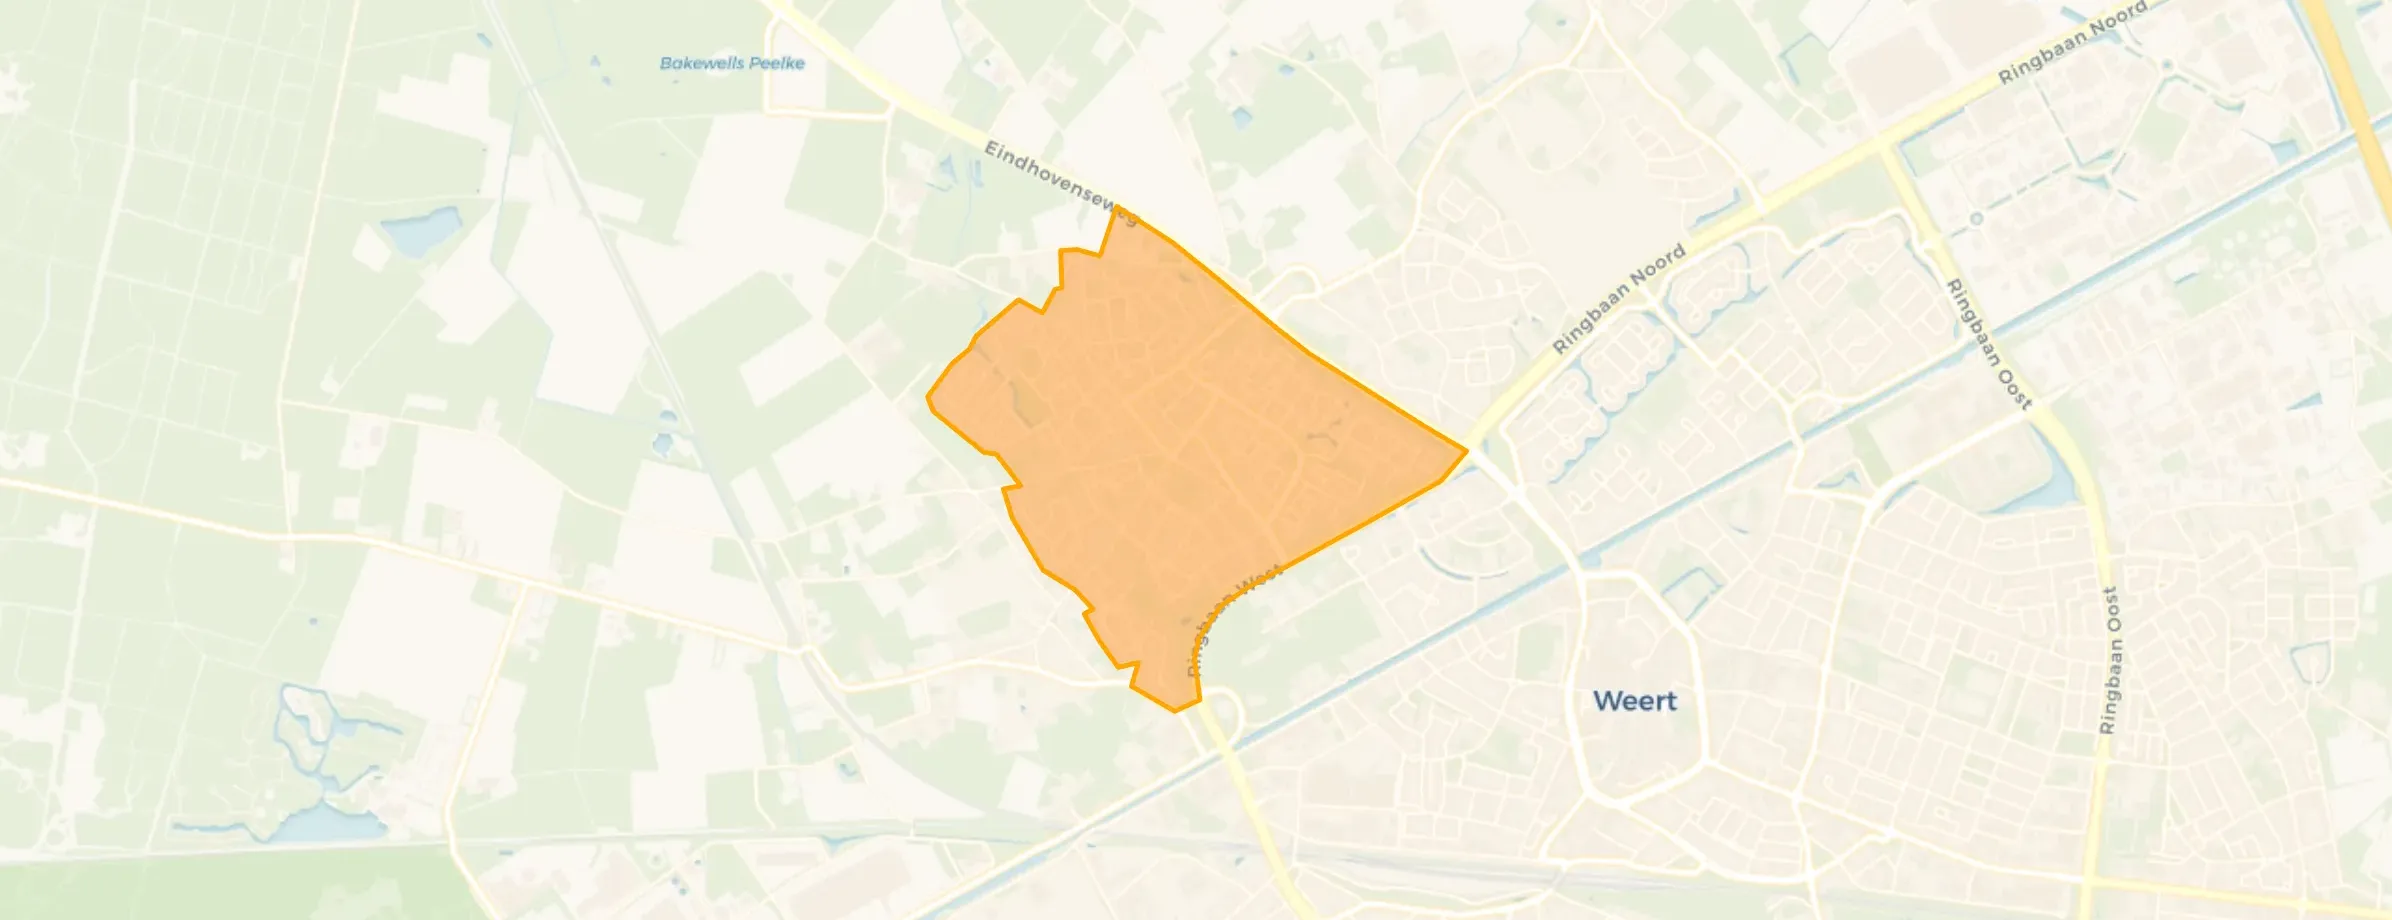
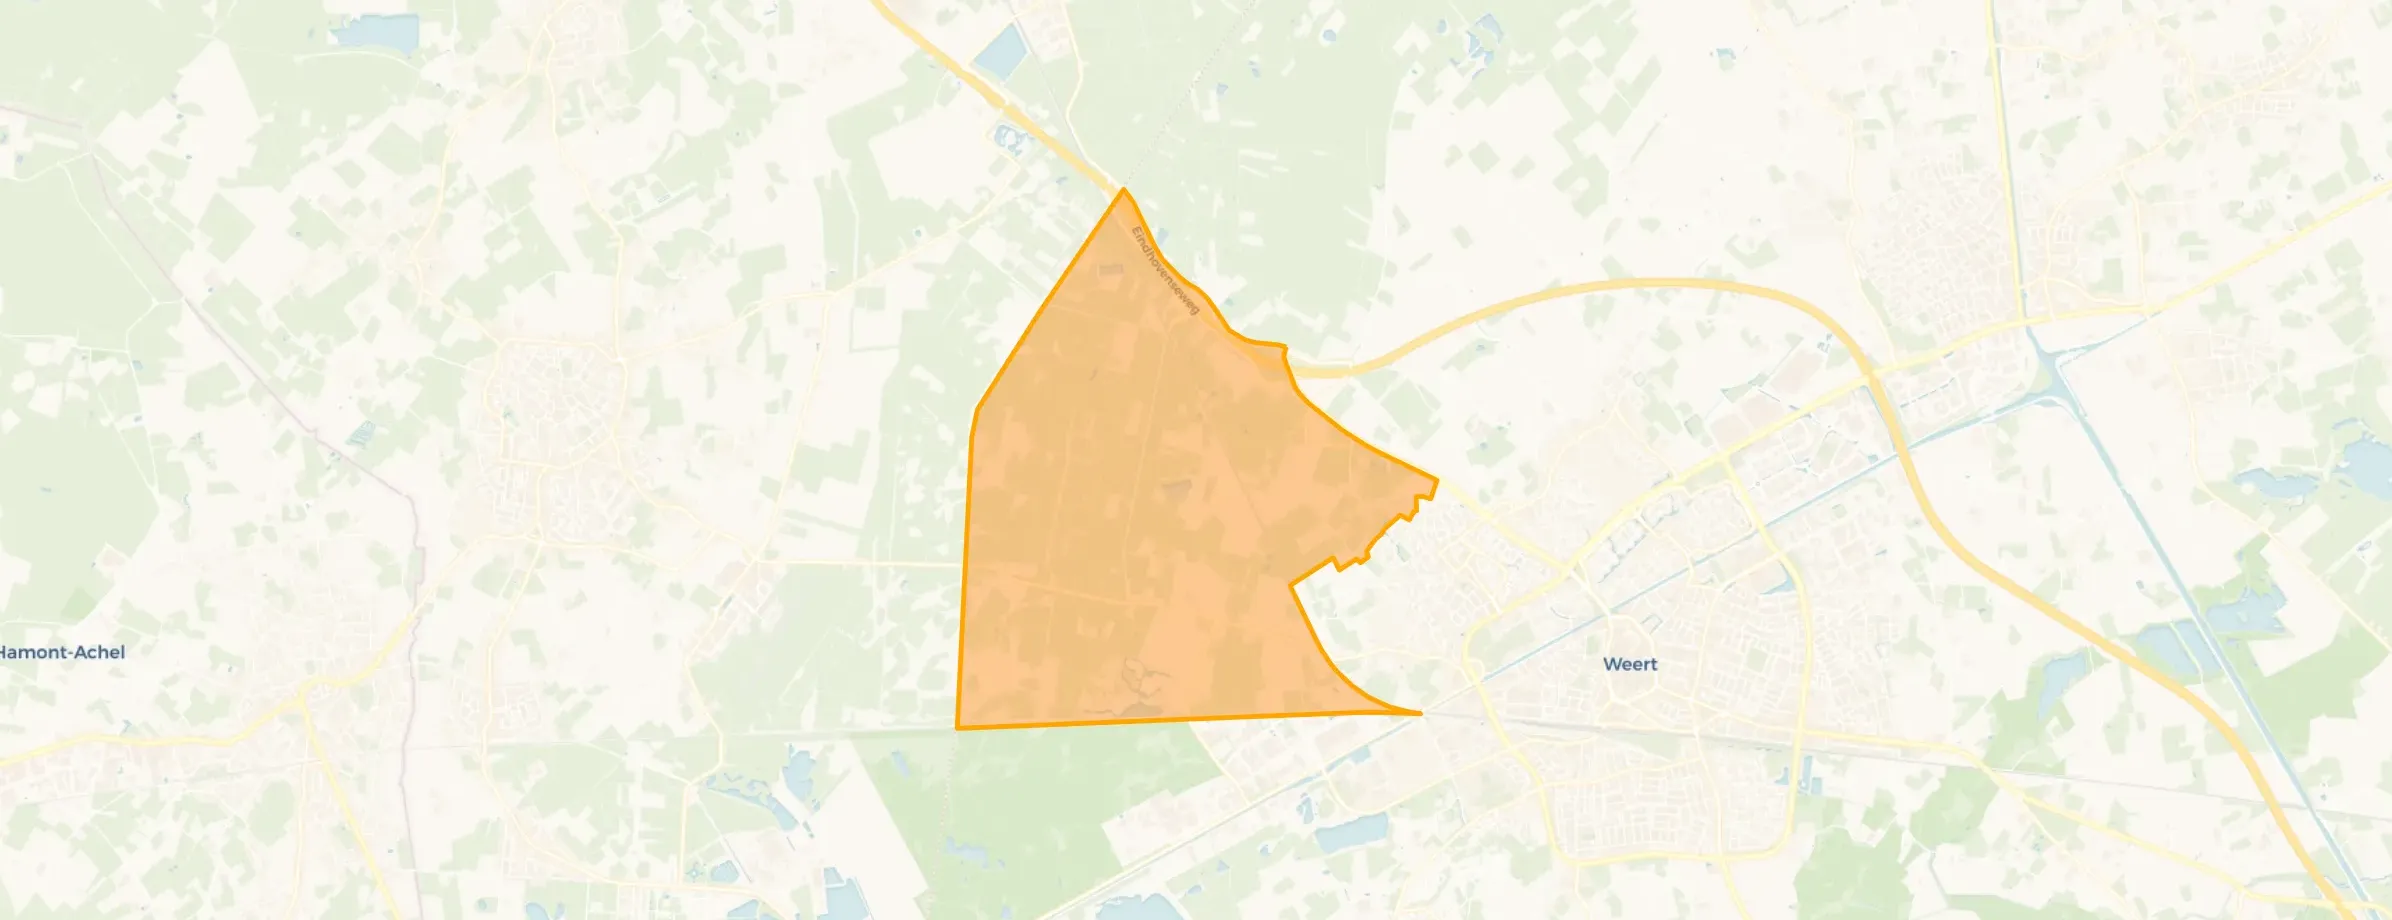
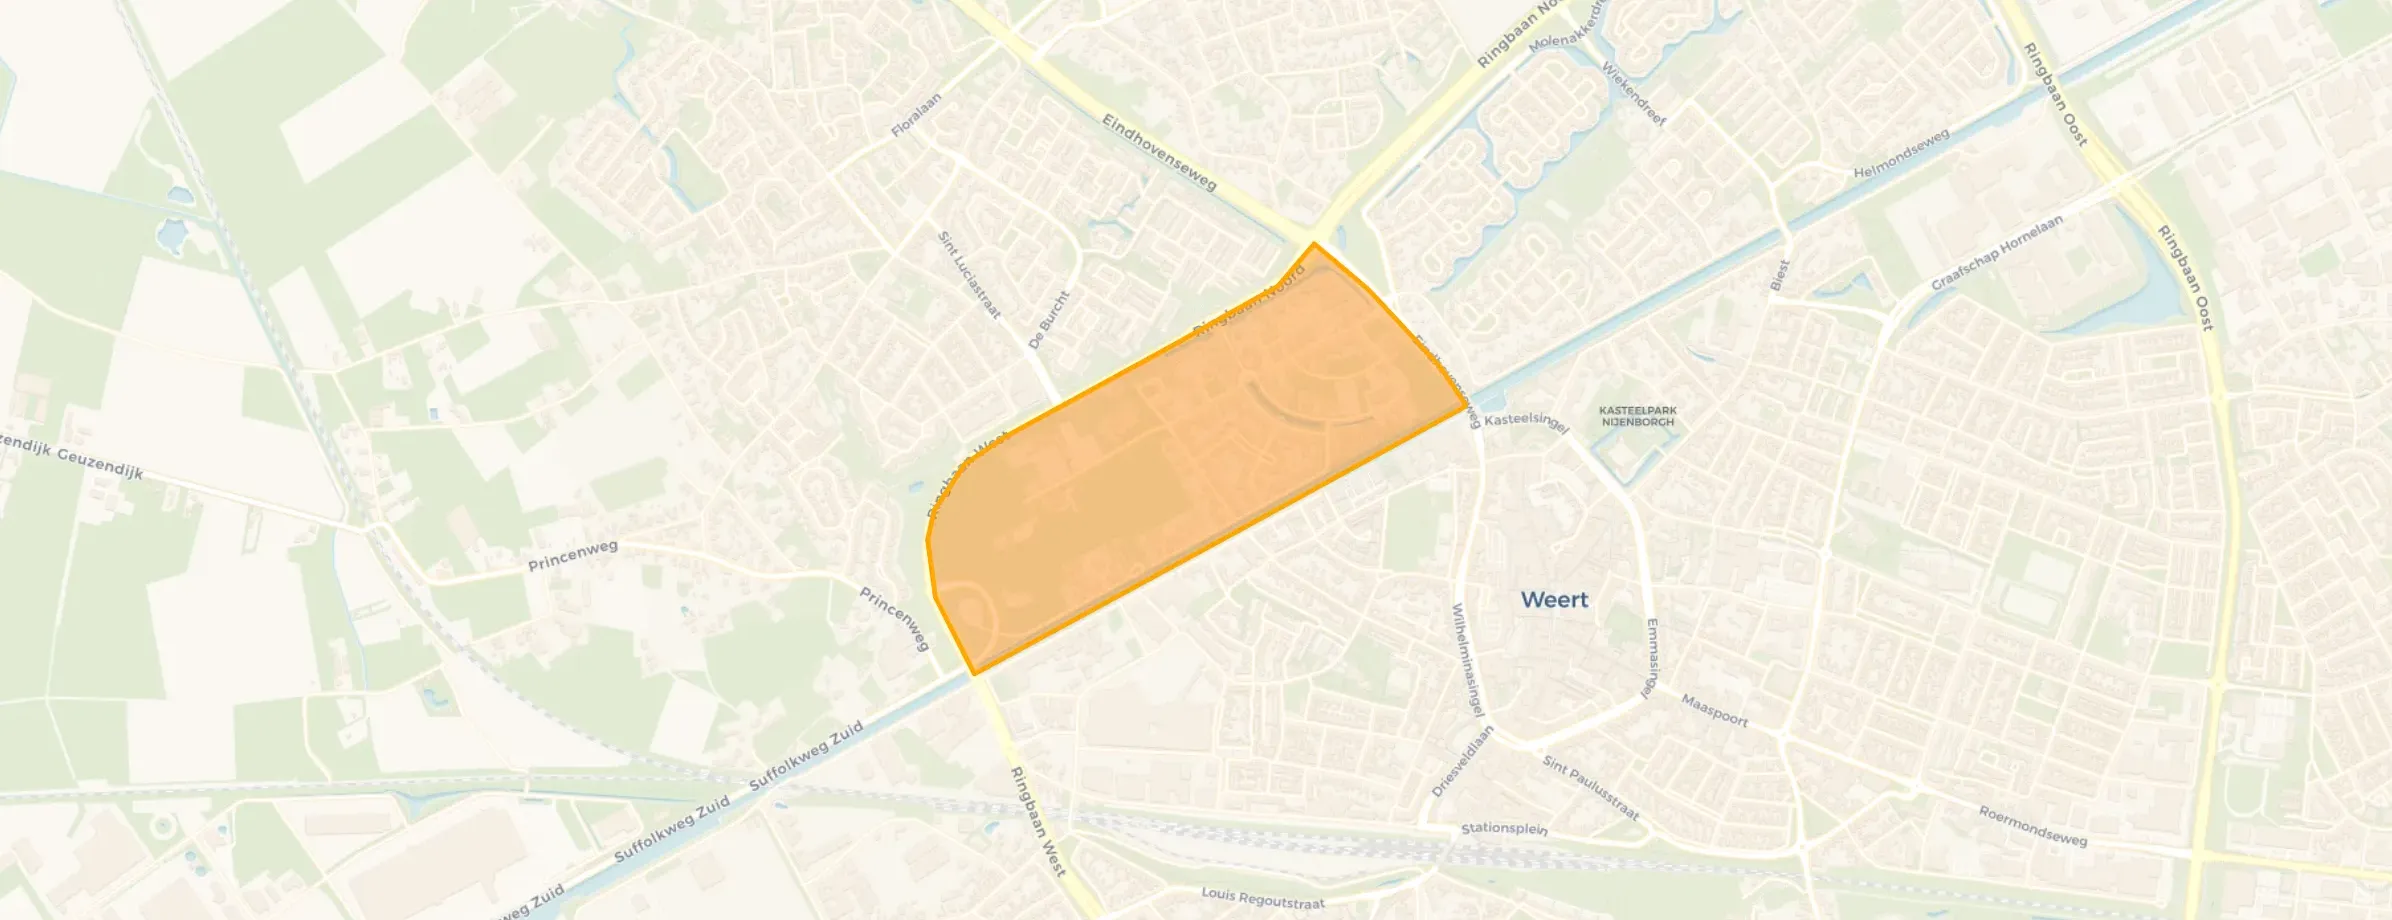
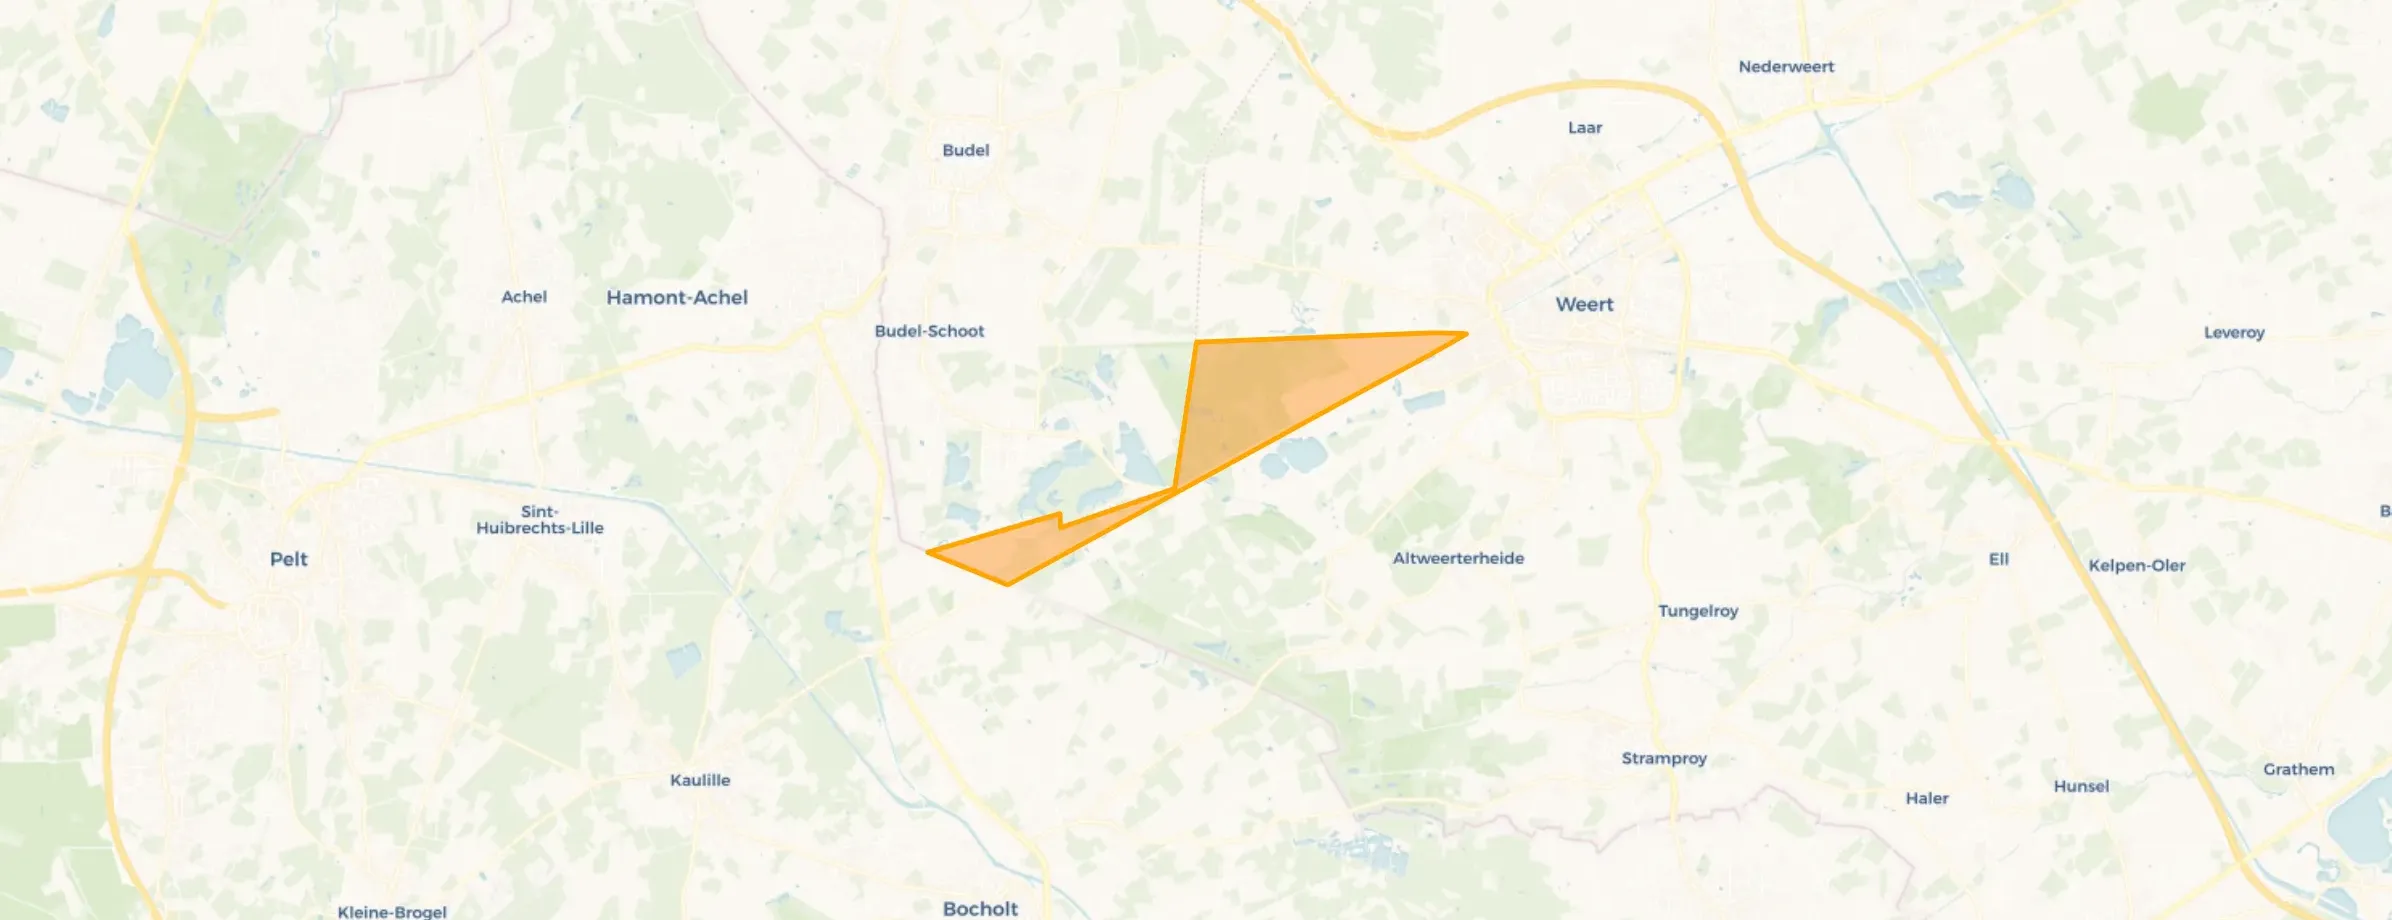
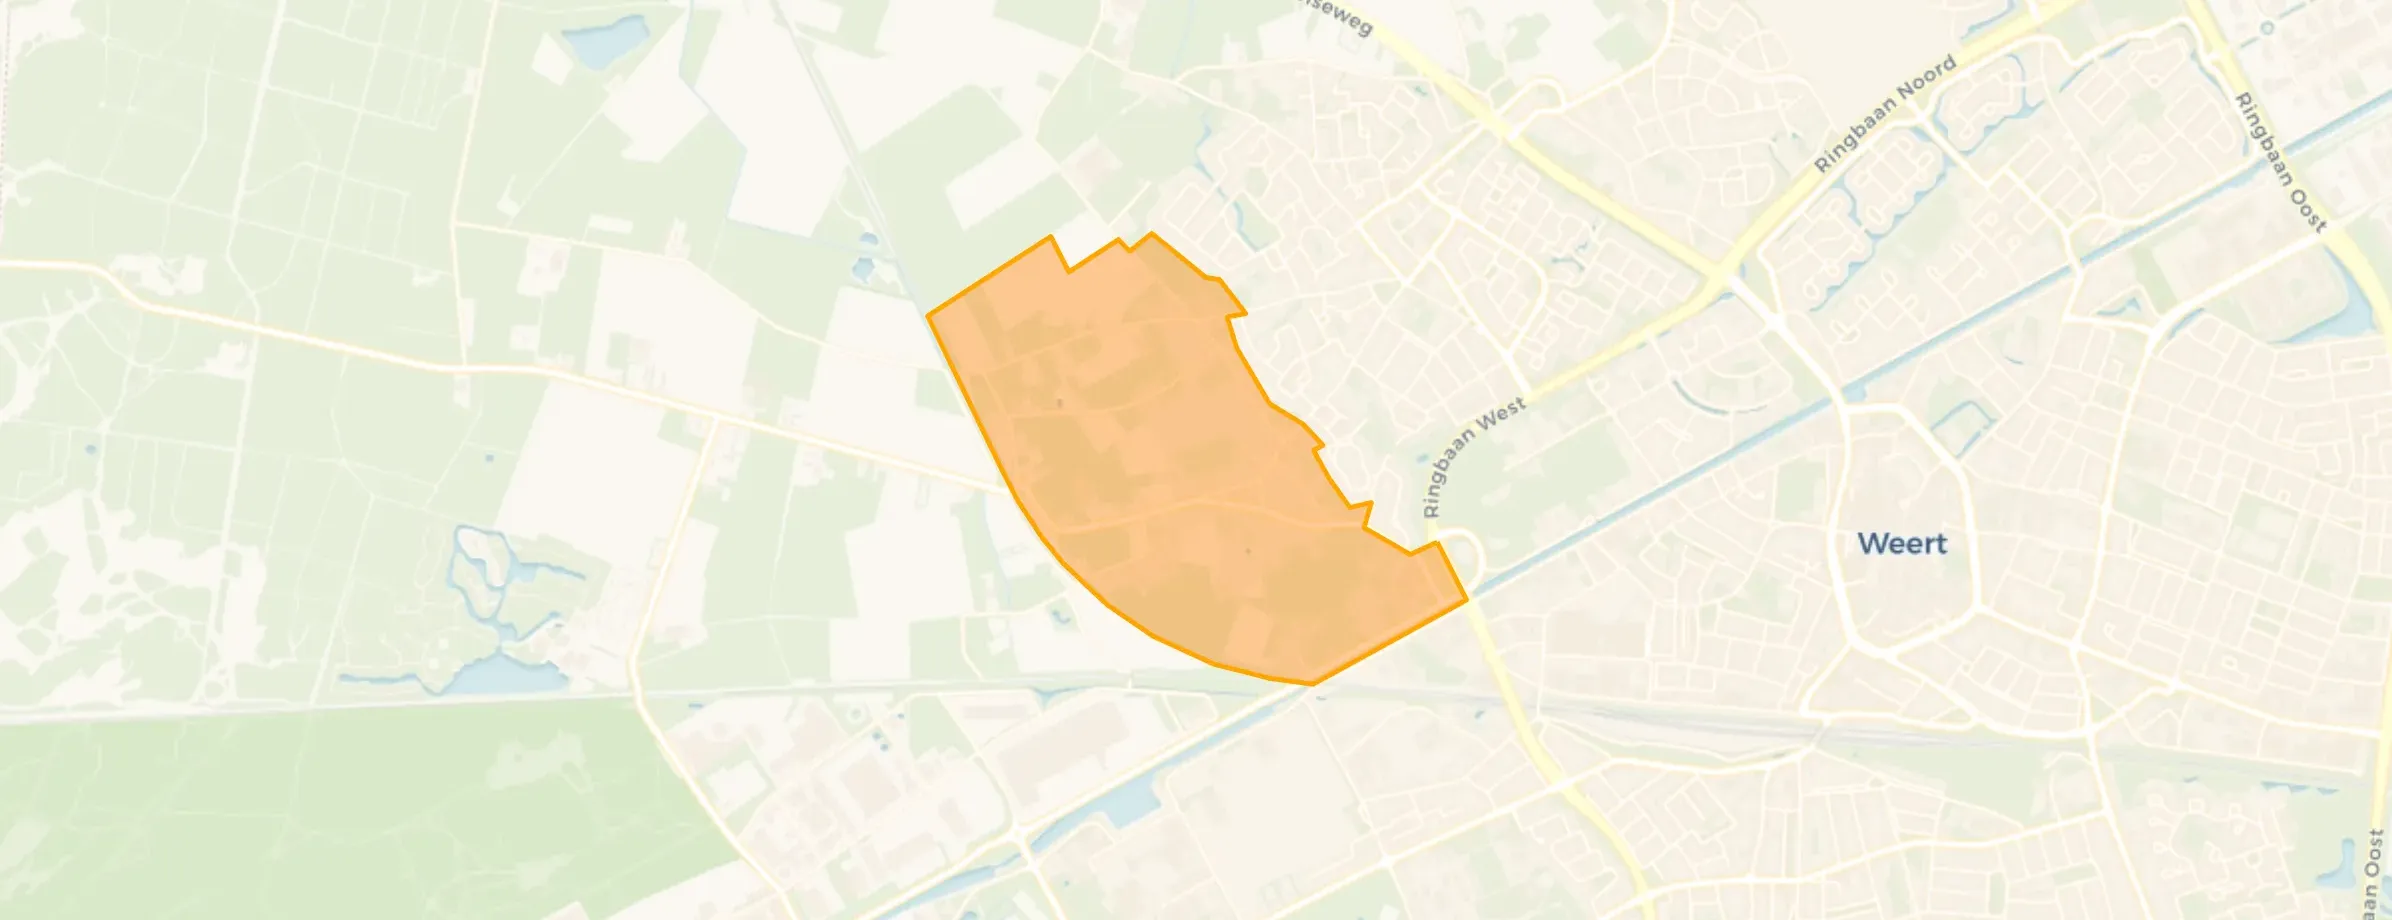
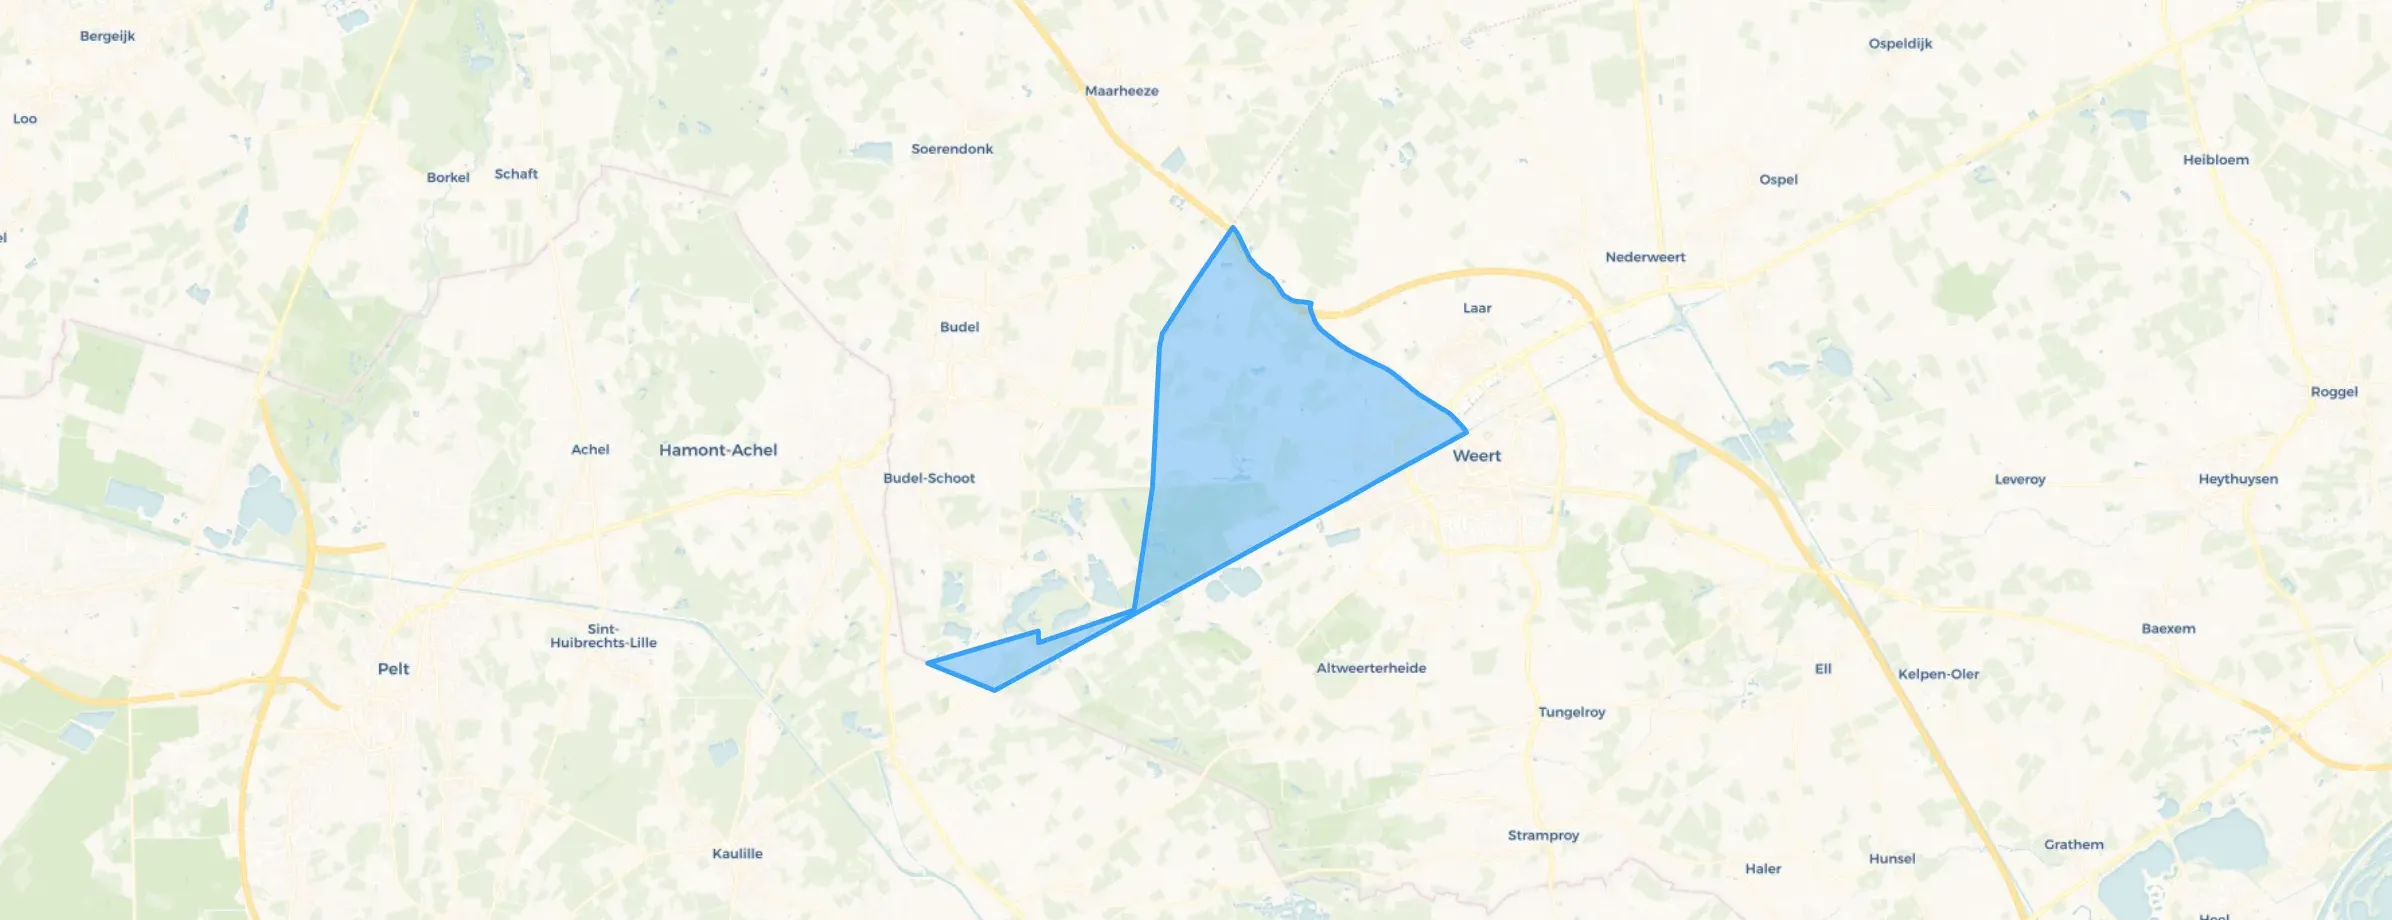
Boshoven is located in the province of Limburg, in the municipality of Weert The district has a total area of 2.067 hectares, of which 2.043 hectares are land and 24 hectares are water. The district is coded as WK098801. The postcode area is 6002AA-6024RA.
Boshoven has 6.460 residents. Of these, 51,1% are men and 48,9% are women. Most residents are 45 to 65 years (30,8%). The other age groups are 23,6% for '25 to 45 years', 19,7% for '65 years or older', 14,5% for '0 to 15 years' and 11,5% for '15 to 25 years'. Of the residents, 44,3% is unmarried, 44,0% is married, 7,6% is divorced and 4,2% is widowed. 4.975 residents originate from the Netherlands, 655 come from Europe and 830 come from countries outside Europe.
There are 2.820 households in Boshoven. 29,6% of these are single-person households, 33,3% households without children and 37,1% households with children. The average household size is 2,3 persons.
In Boshoven there are 5.400 income recipients. The average income per income recipient is €36.500, which is €700 (2%) higher than the national average of €35.800. Per resident, the average income is €30.300, which is €1.100 (4%) higher than the national average of €29.200. Most residents of Boshoven are educated to an intermediate level. 42,5% have an intermediate education (HAVO, VWO or MBO 2-4), 32,0% have a lower education (VMBO or MBO 1) and 25,5% have a university or higher professional education (HBO/WO).
Of the 6.460 residents, around 67% are in paid employment, which amounts to 4.328 people. This is 2% higher than the national average of 65%. The majority of workers are in salaried employment (87%), while 13% are self-employed. In Boshoven, 24% of residents receive a benefit. The largest group is those receiving a state pension (AOW). 1.080 people receive this benefit.
In Boshoven there are 2.770 homes with an average assessed value (WOZ) of €337.000. Of these, around 98% are occupied and 2% unoccupied. Most homes are owner-occupied. This amounts to 20% rental homes and 80% owner-occupied homes. Of the homes, 80% privately owned, 15% owned by housing associations and 5% owned by other landlords. The most common construction periods in Boshoven are 1970-1980 (32%) and 1950-1970 (22%).
There are currently no homes for sale in Boshoven. The most recently listed home is Gentiaanstraat 9 by Koopklik Makelaardij & Taxaties. No homes were sold in Boshoven over the past year.
There are currently no homes for rent in Boshoven. The most recent home is Mimosastraat 4, offered by www.thuisinlimburg.nl. No homes were let in Boshoven over the past year.
No recent rental data available for Boshoven.
In Boshoven there are 3.426 addresses with a registered energy label. The most common labels are C (35%), A (16%) and B (16%). On average, an address in Boshoven uses 2.970 kWh of electricity per year. This is 6% above the national average of 2.810 kWh. With an annual consumption of 1.160 m³ per address, natural gas consumption is 9% below the national average of 1.280 m³.
Very quiet. There are few to no activities. There are few amenities; if, like me, you have difficulty walking and cannot cycle or drive, you are dependent on others to get anywhere. The neighbourhood bus does not stop in this area, and the supermarket is also quite a distance away. Furthermore, there is nothing else nearby except 2 chip shops, a kebab shop, a sushi place, a café, and a church. But even those are a long walk away!!
Auto-translated to English by AIneat neighbourhood, schools, shops, doctors, good accessibility, public transport, city
Auto-translated to English by AINice area with lots of greenery. Supermarket, schools nearby and many playgrounds. Some playgrounds could do with improvement. I find the crossing from Biest to Oda school/after-school care very dangerous. No zebra crossing and poor visibility.
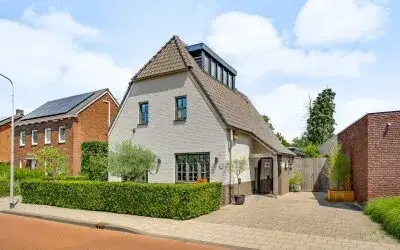
Auto-translated to English by AIThe housing stock is mainly post-war — 58% was built between 1945 and 1990. In addition, the most common type is terraced houses (41%).
Over the past year a home for sale in Boshoven was listed for an average of €499,914 (€3,423 per m²). Last quarter prices rose by 25%.
Residents give Boshoven a 7.3 out of 10 based on 3 reviews. Education stands out with a 8.7; community lags behind with a 6.3.
Wijk Boshoven has 6,460 residents. The largest age group is 45 to 65 years (31%). Many families: 37% of the households have children.
The housing supply in Boshoven is remarkably efficient: 59% has an A, A+ or B label. The average natural gas consumption per household is 1,160 m³ per year.
From Boshoven you can on average reach a supermarket at 0.7 km, a GP at 0.6 km, a railway station at 3.0 km, a primary school at 0.8 km (as the crow flies, source: CBS).
Right now you will find 24 homes for sale and 2 homes for rent in Boshoven.