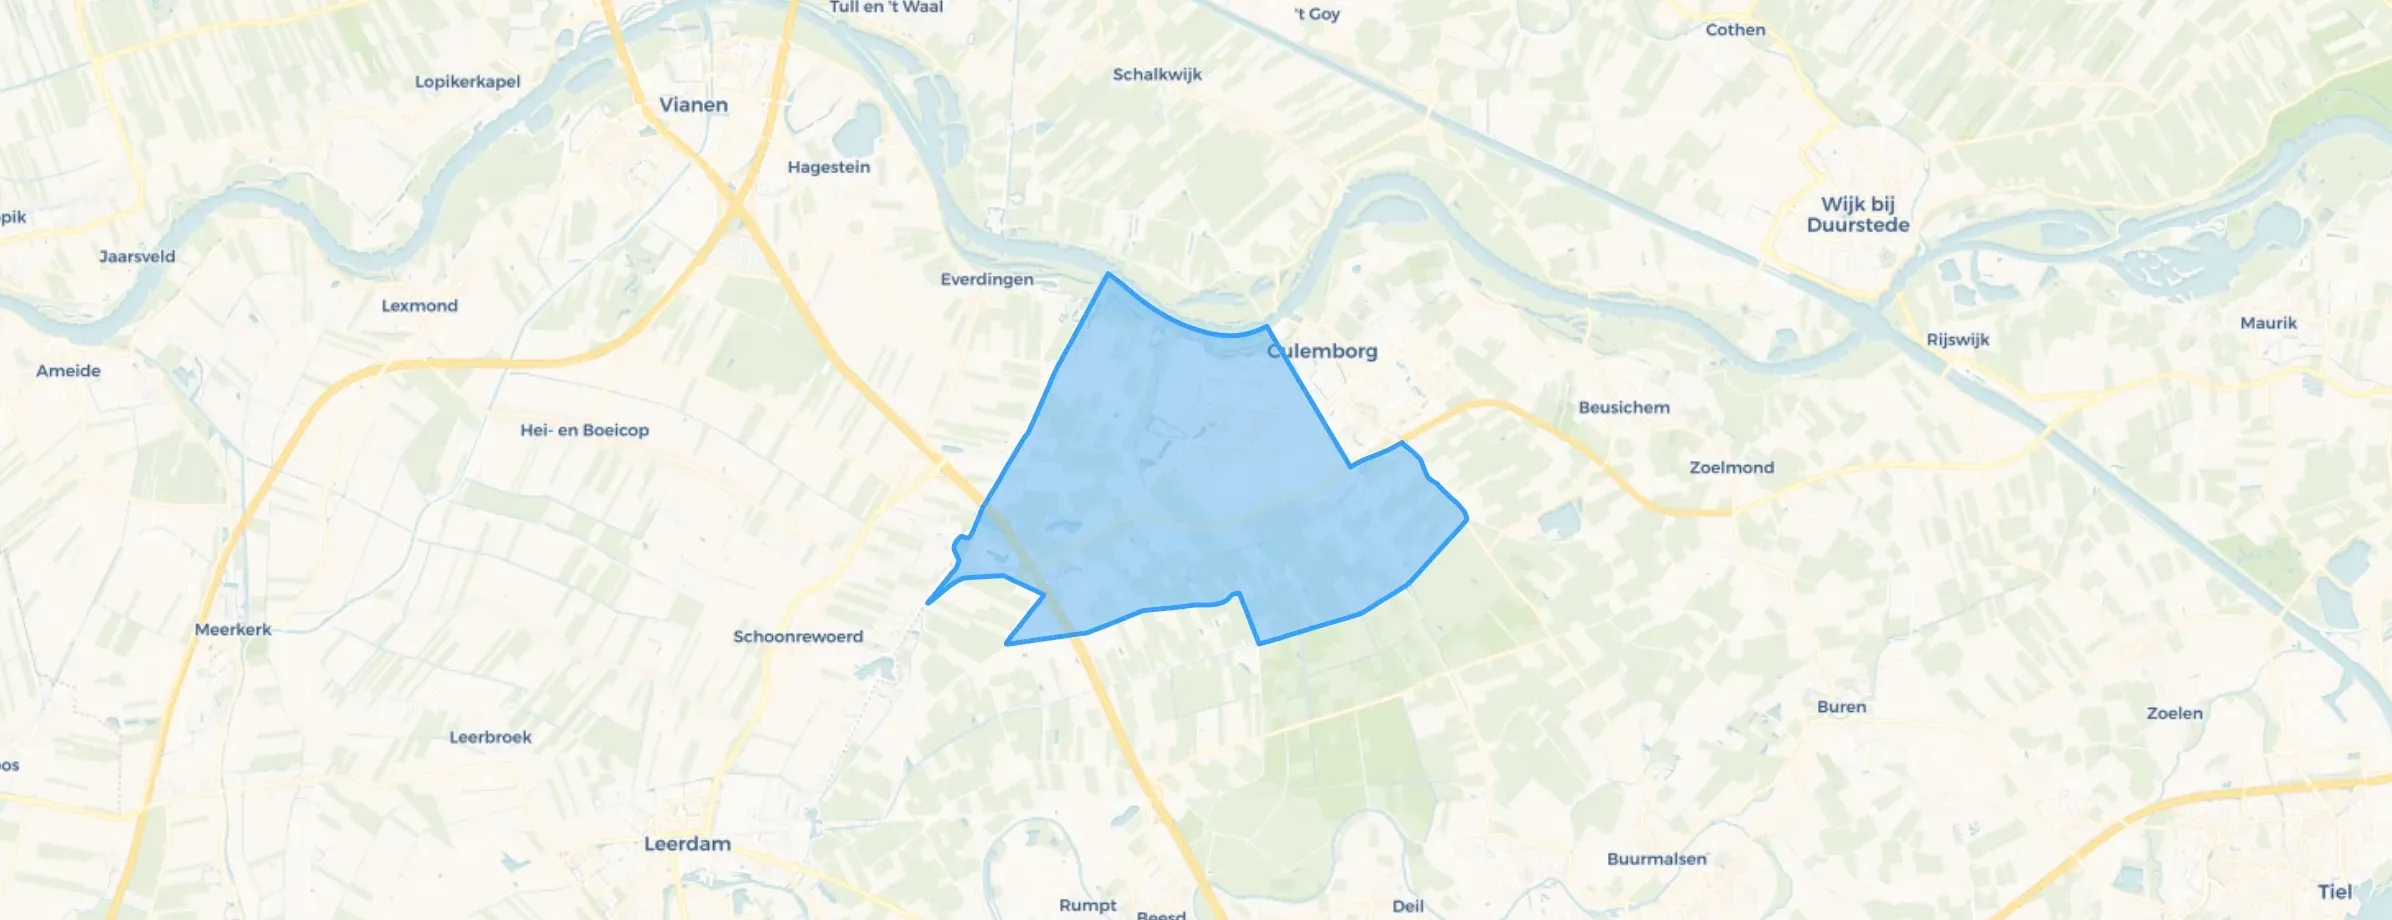
District in Culemborg
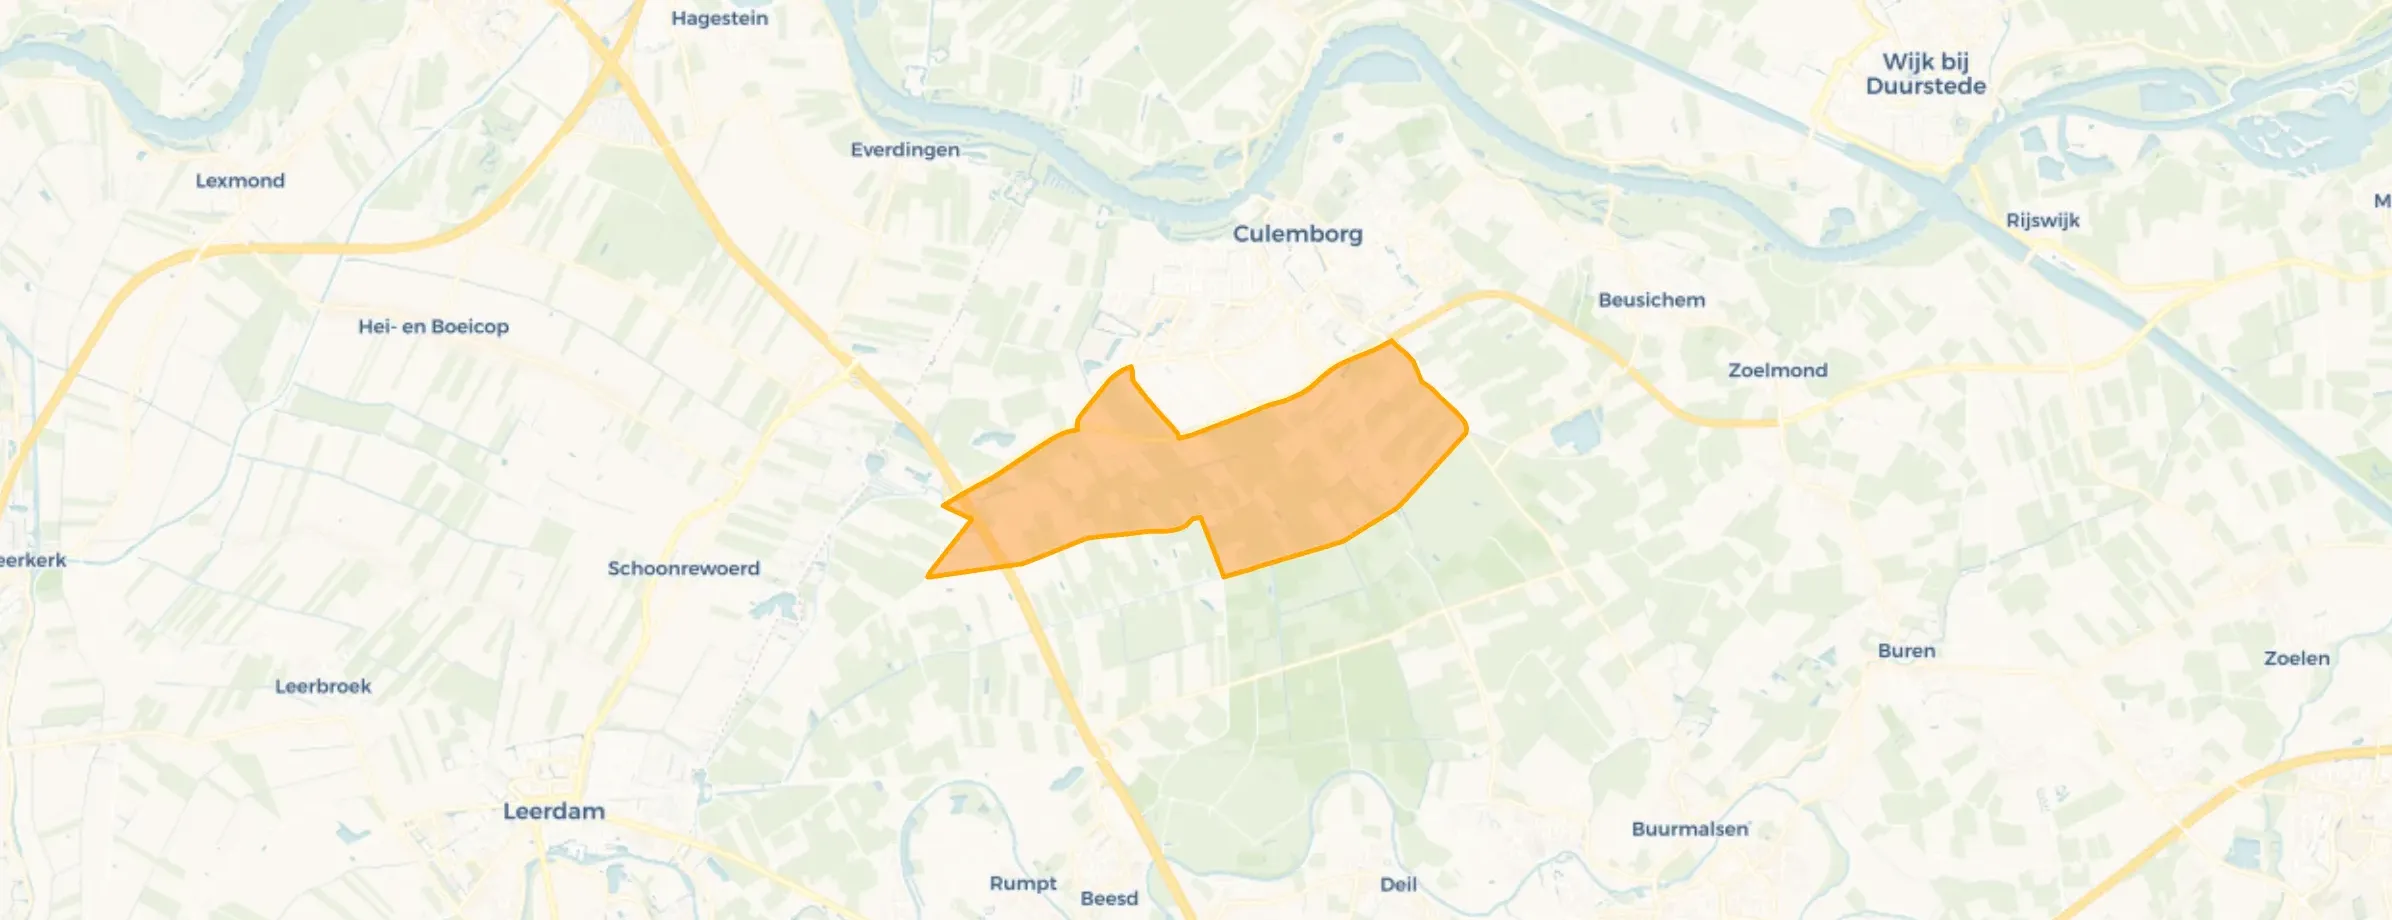
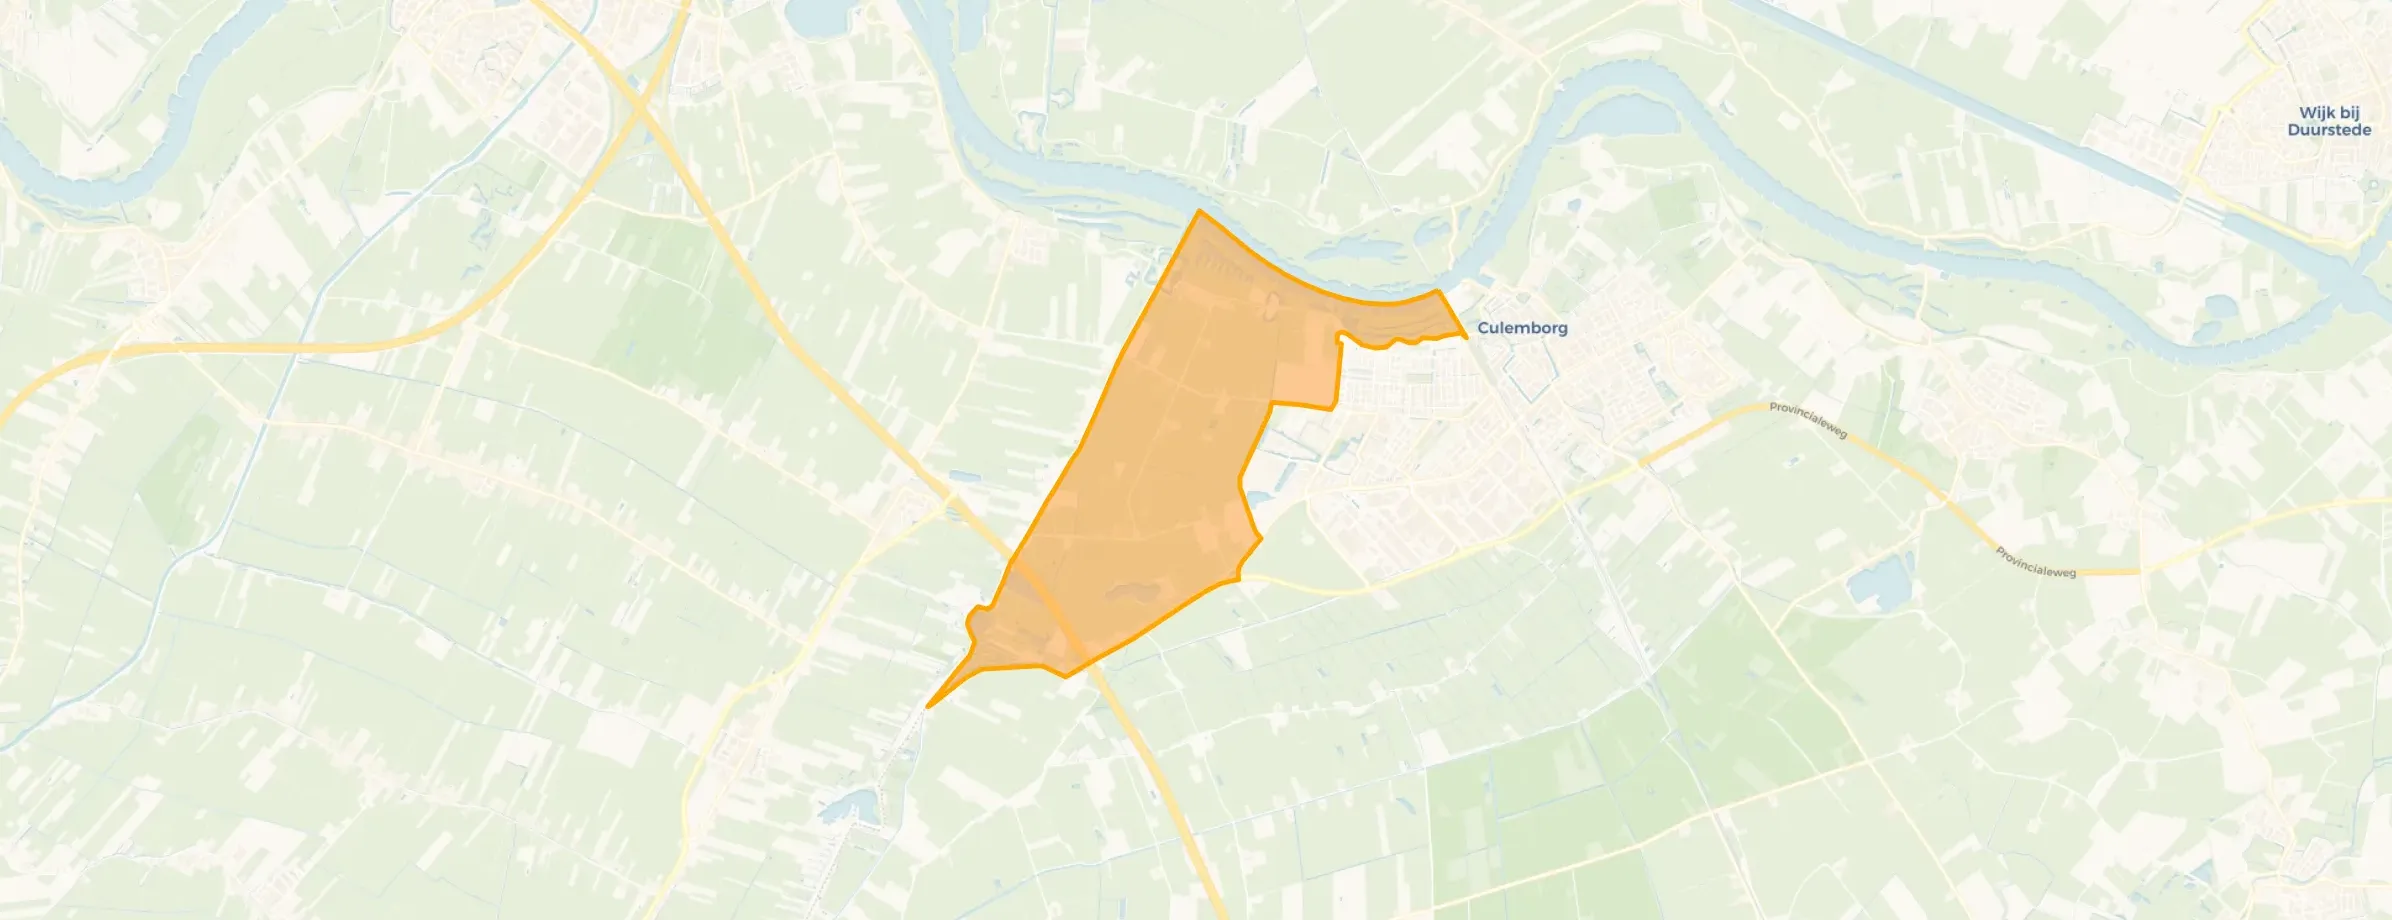
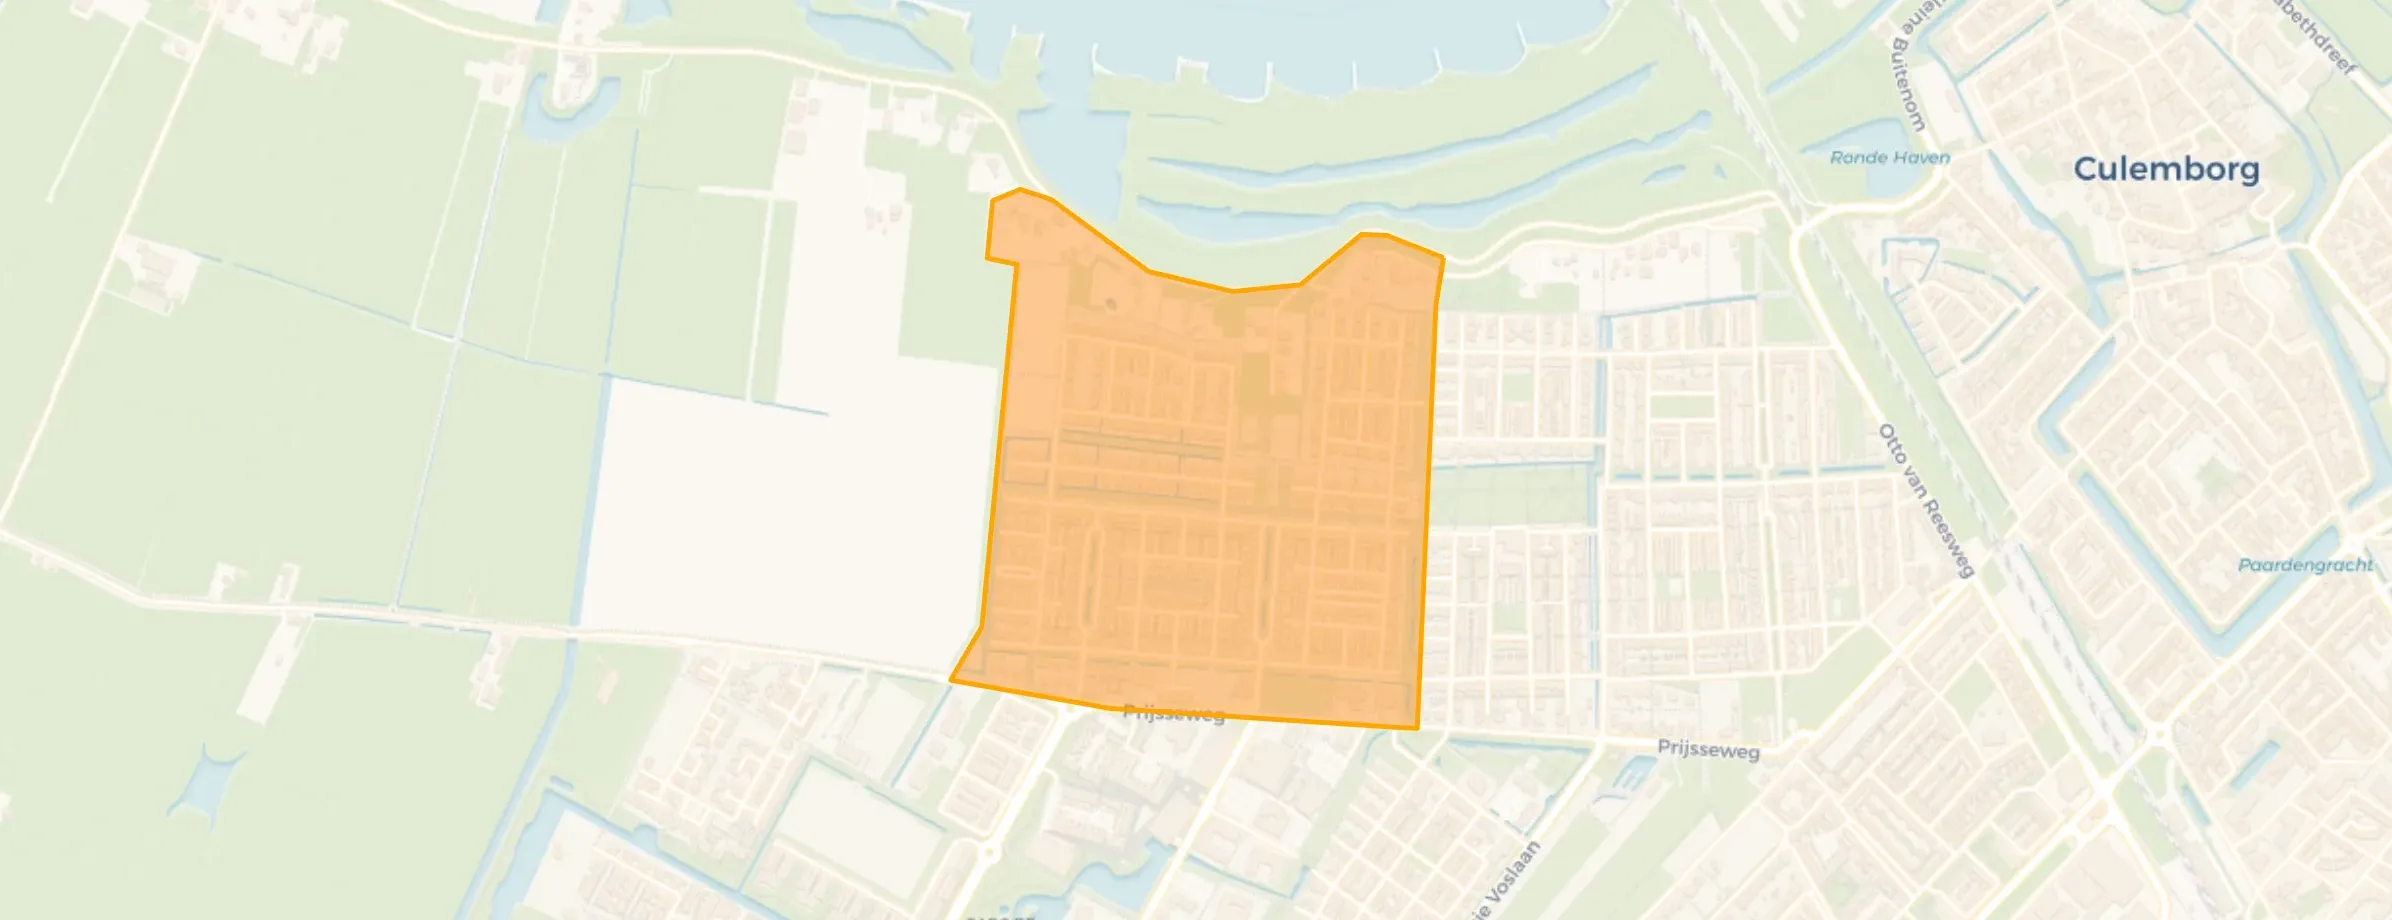
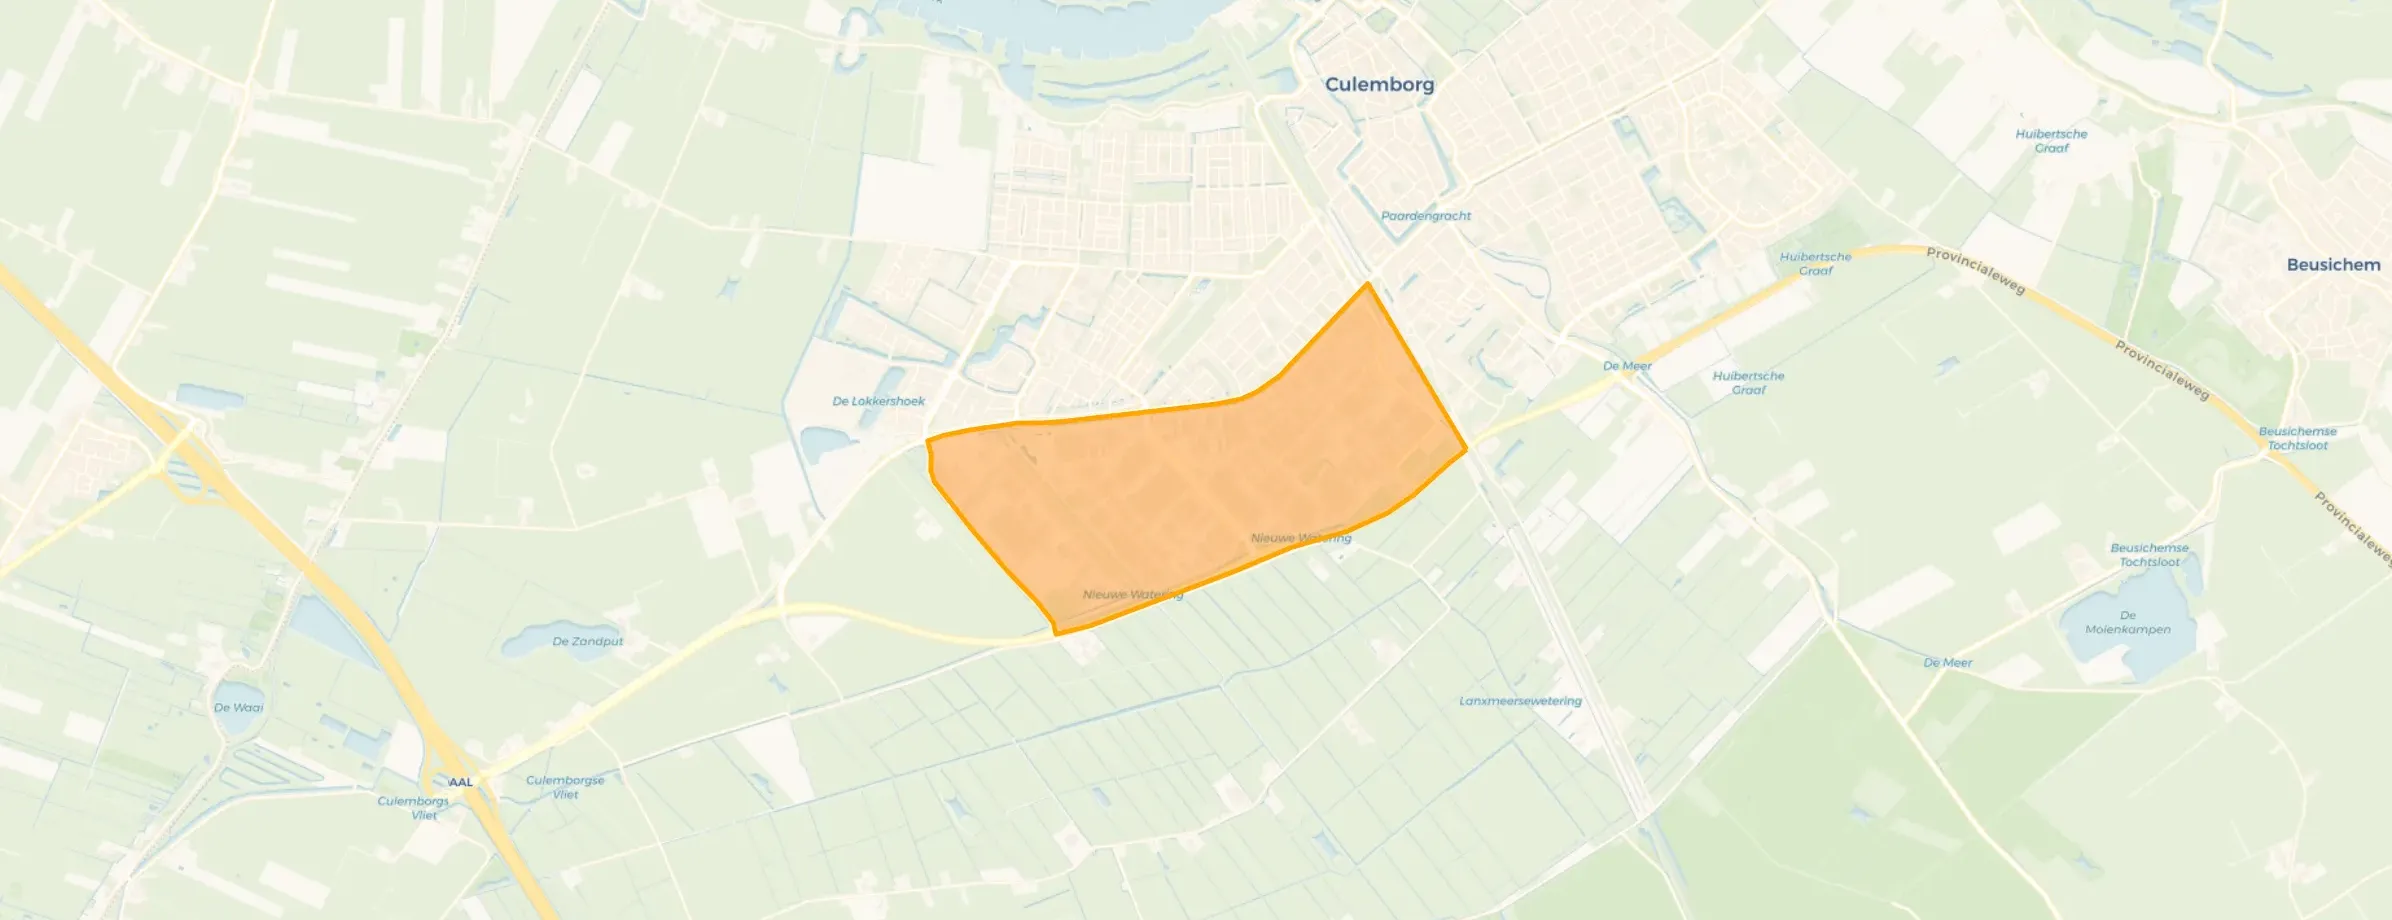
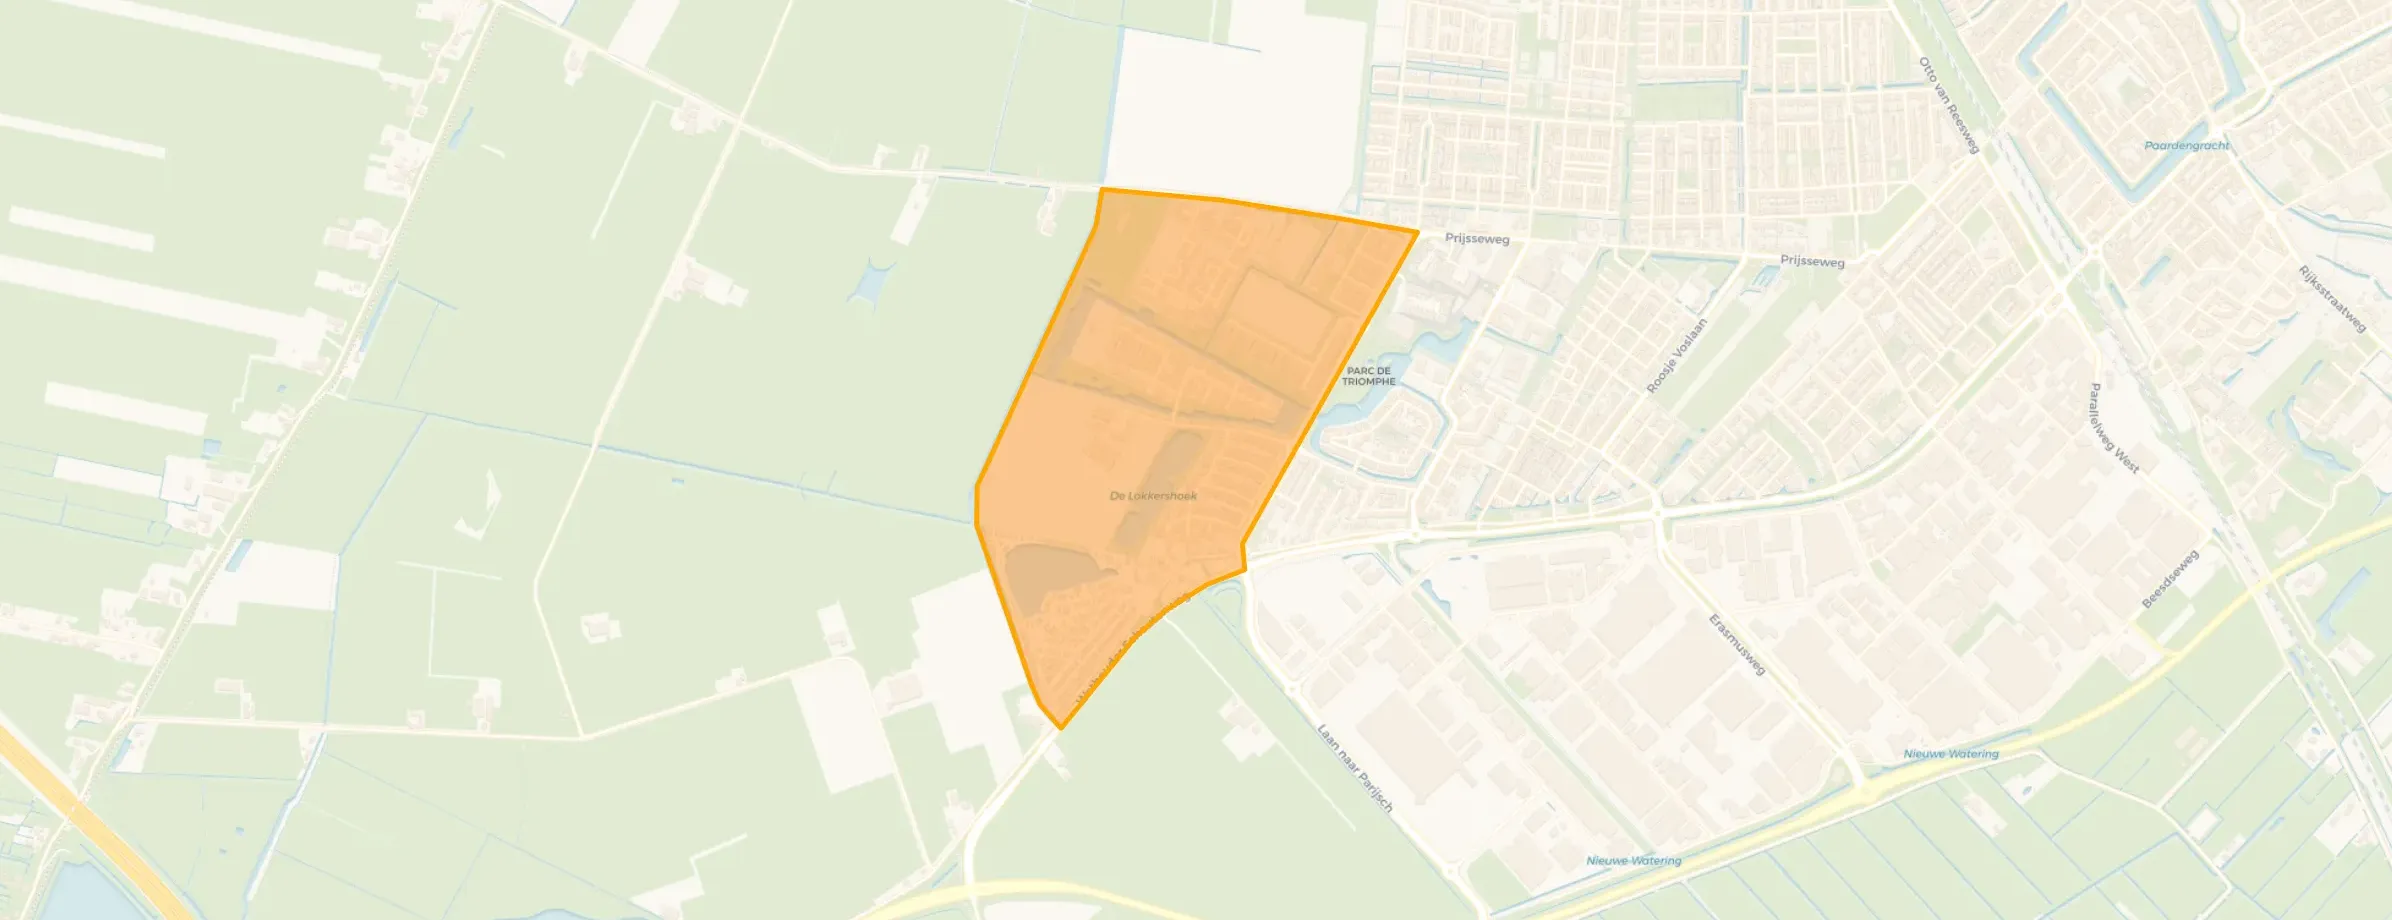
Culemborg West is located in the province of Gelderland, in the municipality of Culemborg The district has a total area of 2.232 hectares, of which 2.145 hectares are land and 87 hectares are water. The district is coded as WK021601. The postcode area is 4103ND-4107NB.
Culemborg West has 13.115 residents. Of these, 49,8% are men and 50,2% are women. Most residents are 45 to 65 years (29,0%). The other age groups are 24,1% for '25 to 45 years', 18,0% for '0 to 15 years', 17,7% for '65 years or older' and 11,2% for '15 to 25 years'. Of the residents, 46,4% is unmarried, 43,0% is married, 7,0% is divorced and 3,6% is widowed. 10.030 residents originate from the Netherlands, 745 come from Europe and 2.340 come from countries outside Europe.
There are 5.480 households in Culemborg West. 29,5% of these are single-person households, 29,9% households without children and 40,6% households with children. The average household size is 2,4 persons. The national average is 2,1 persons.
In Culemborg West there are 10.200 income recipients. The average income per income recipient is €46.900, which is €4.700 (11%) higher than the national average of €42.200. Per resident, the average income is €37.500, which is €2.600 (7%) higher than the national average of €34.900. Most residents of Culemborg West are highly educated. 40,1% have a university or higher professional education (HBO/WO), 37,8% have an intermediate education (HAVO, VWO or MBO 2-4) and 22,1% have a lower education (VMBO or MBO 1).
Of the 13.115 residents, around 76% are in paid employment, which amounts to 9.967 people. This is 4% higher than the national average of 72%. The majority of workers are in salaried employment (85%), while 15% are self-employed. In Culemborg West, 22% of residents receive a benefit. The largest group is those receiving a state pension (AOW). 2.070 people receive this benefit.
In Culemborg West there are 5.326 homes with an average assessed value (WOZ) of €475.000. Of these, around 98% are occupied and 2% unoccupied. Most homes are owner-occupied. This amounts to 27% rental homes and 73% owner-occupied homes. Of the homes, 73% privately owned, 22% owned by housing associations and 5% owned by other landlords. The most common construction periods in Culemborg West are 1990-2000 (29%) and 2000-2010 (24%).
There are currently no homes for sale in Culemborg West. The most recently listed home is Aalscholverstraat 29 by Weeda & Jellema Makelaardij op Funda. No homes were sold in Culemborg West over the past year.
There are currently no homes for rent in Culemborg West. The most recent home is Alex van Strienstraat 3, offered by ikwilhuren.nl. No homes were let in Culemborg West over the past year.
No recent rental data available for Culemborg West.
In Culemborg West there are 4.167 addresses with a registered energy label. The most common labels are A (50%), C (16%) and B (13%). On average, an address in Culemborg West uses 2.800 kWh of electricity per year. This is 10% above the national average of 2.550 kWh. With an annual consumption of 560 m³ per address, natural gas consumption is 30% below the national average of 800 m³.

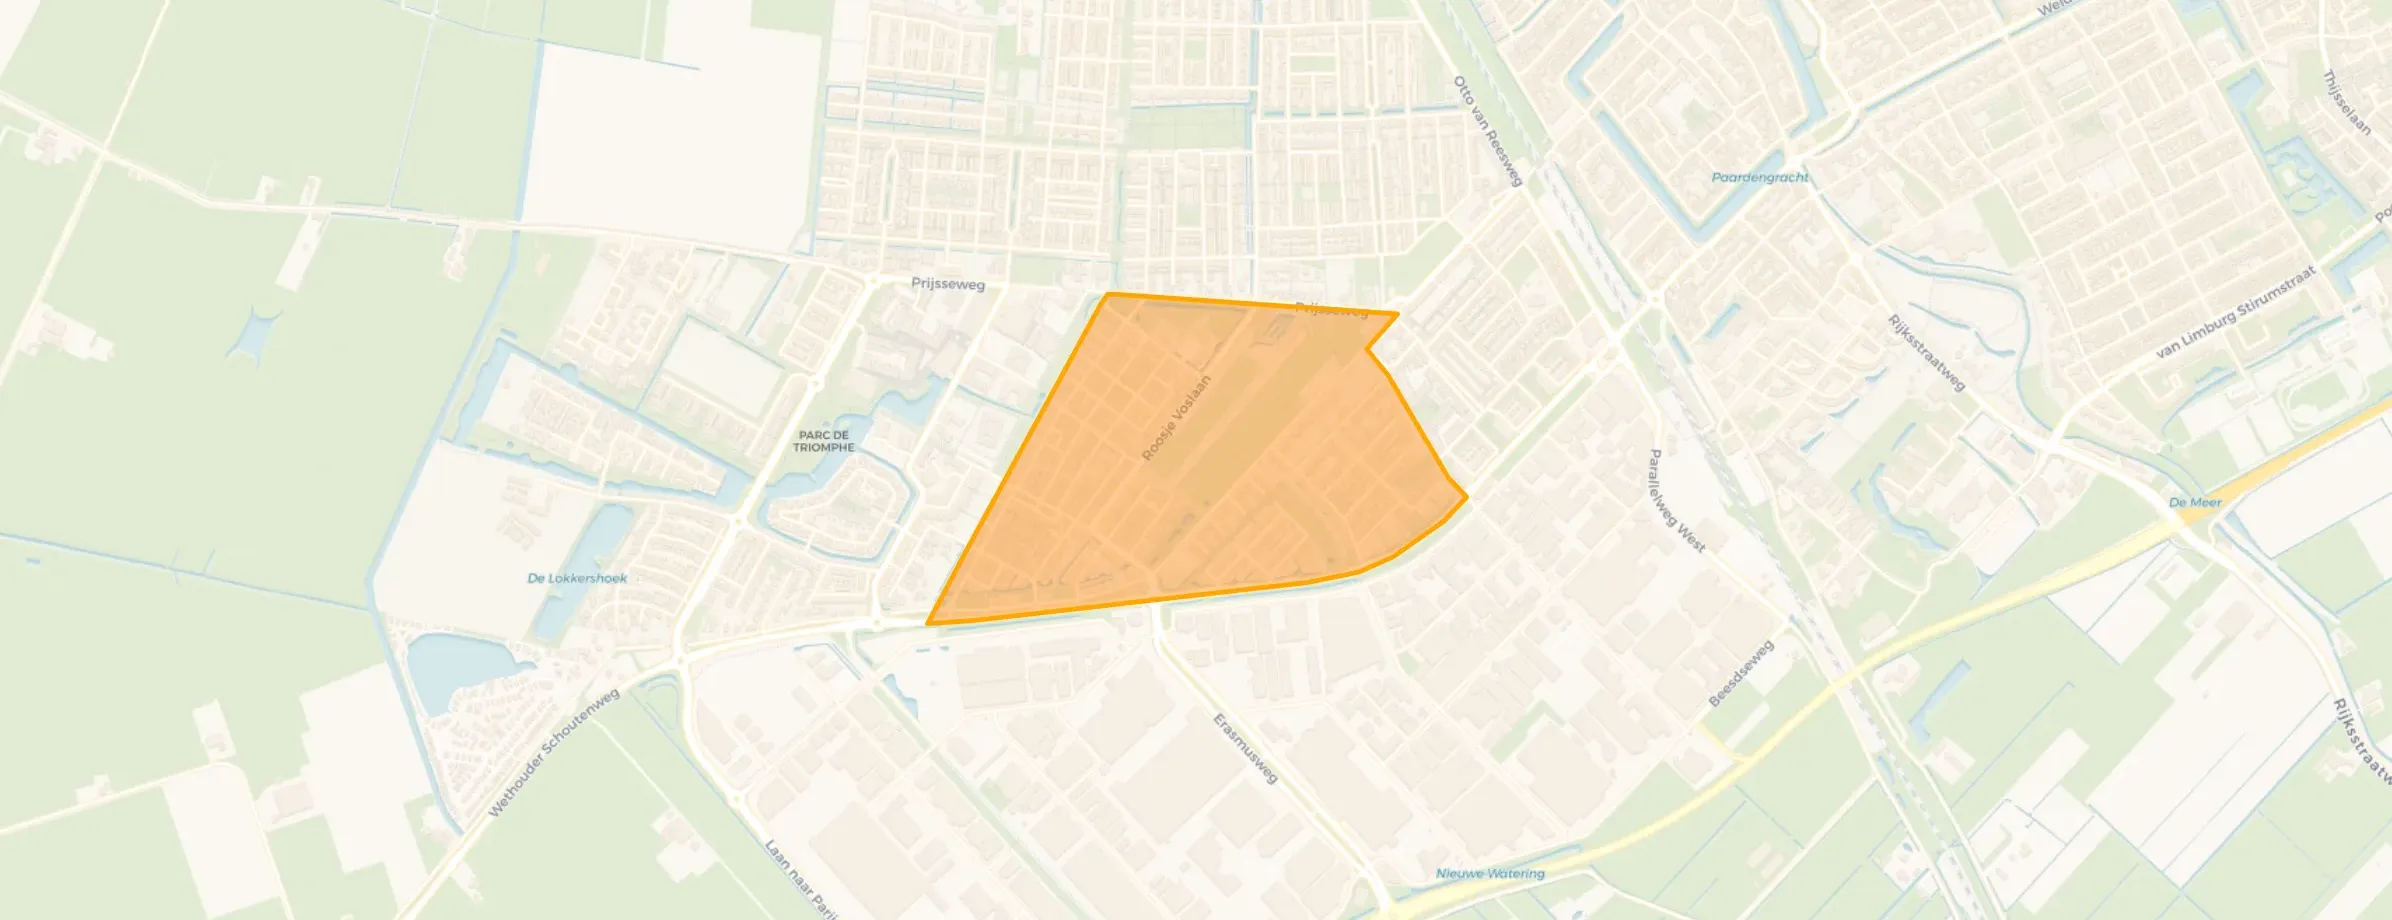
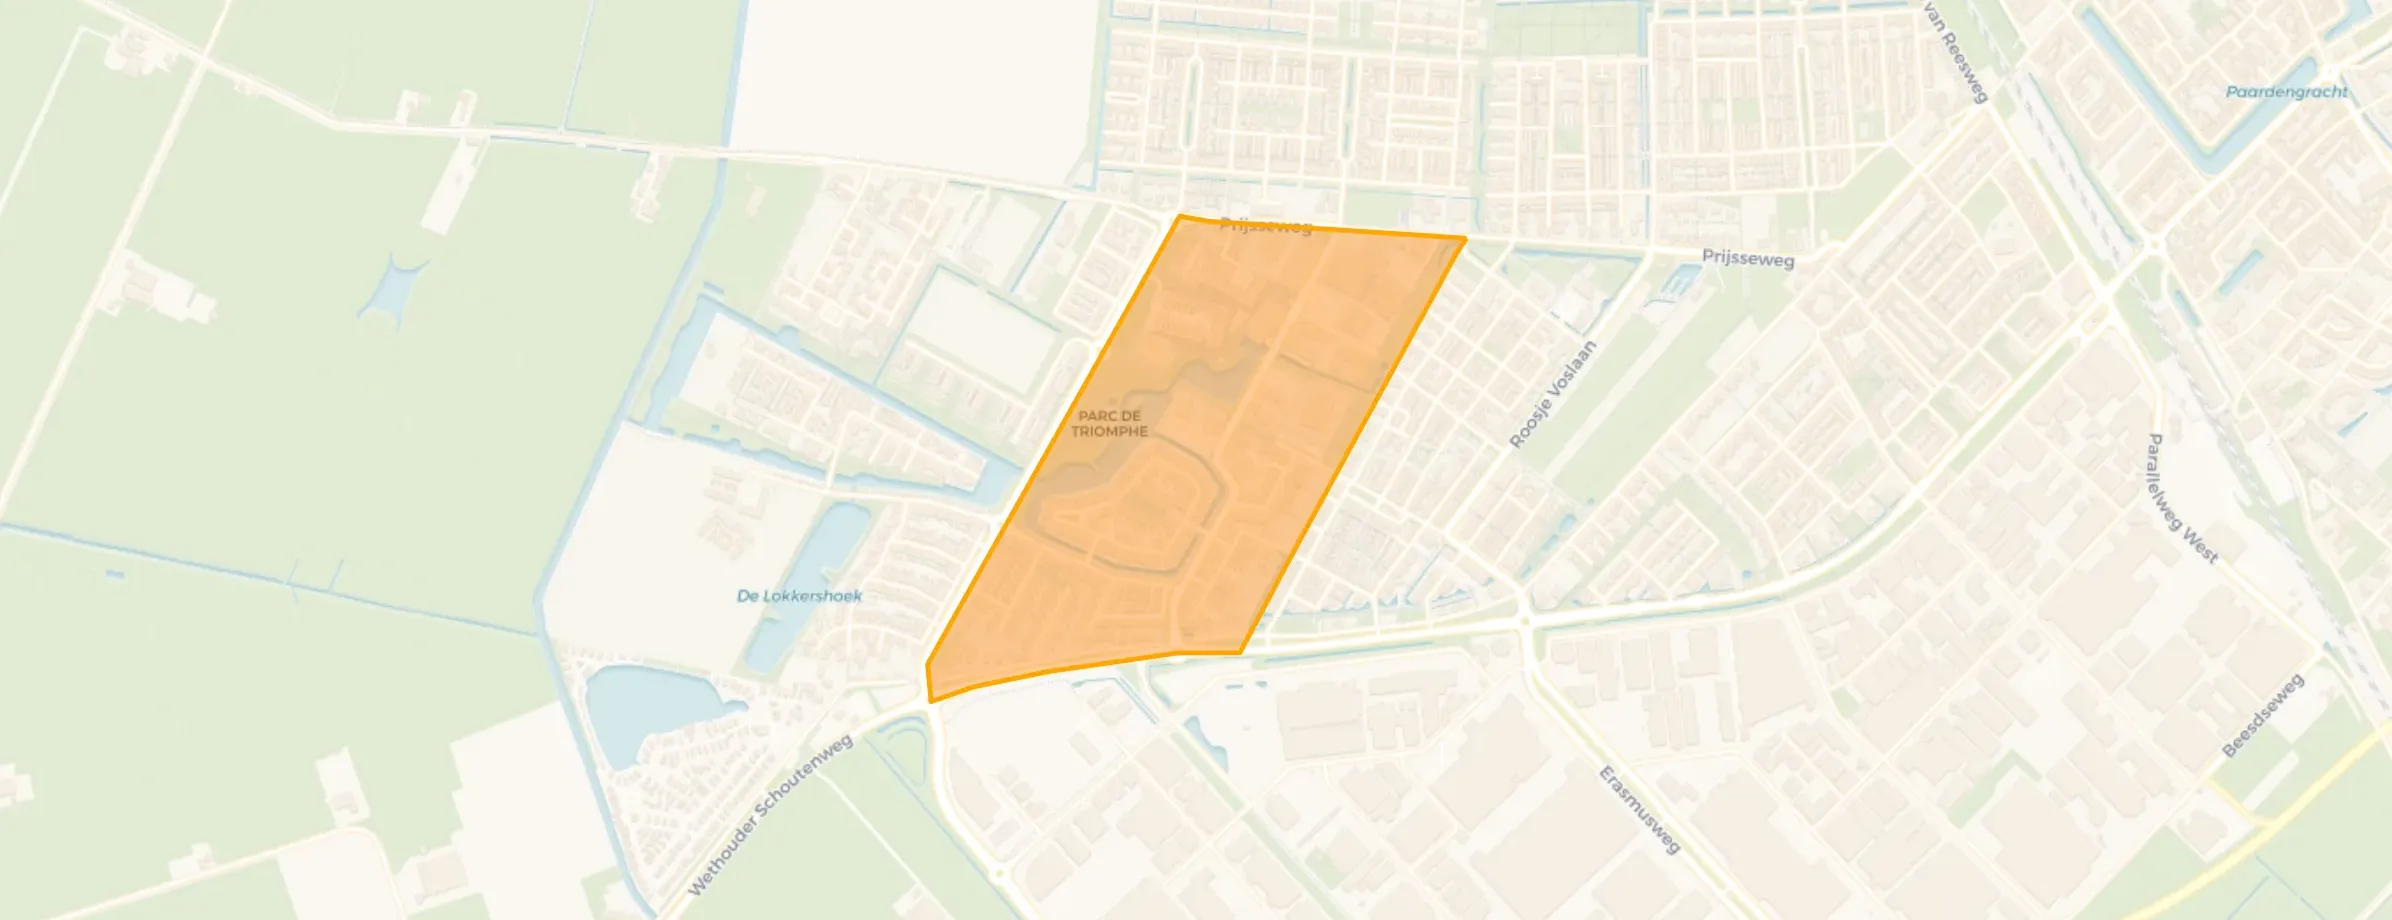
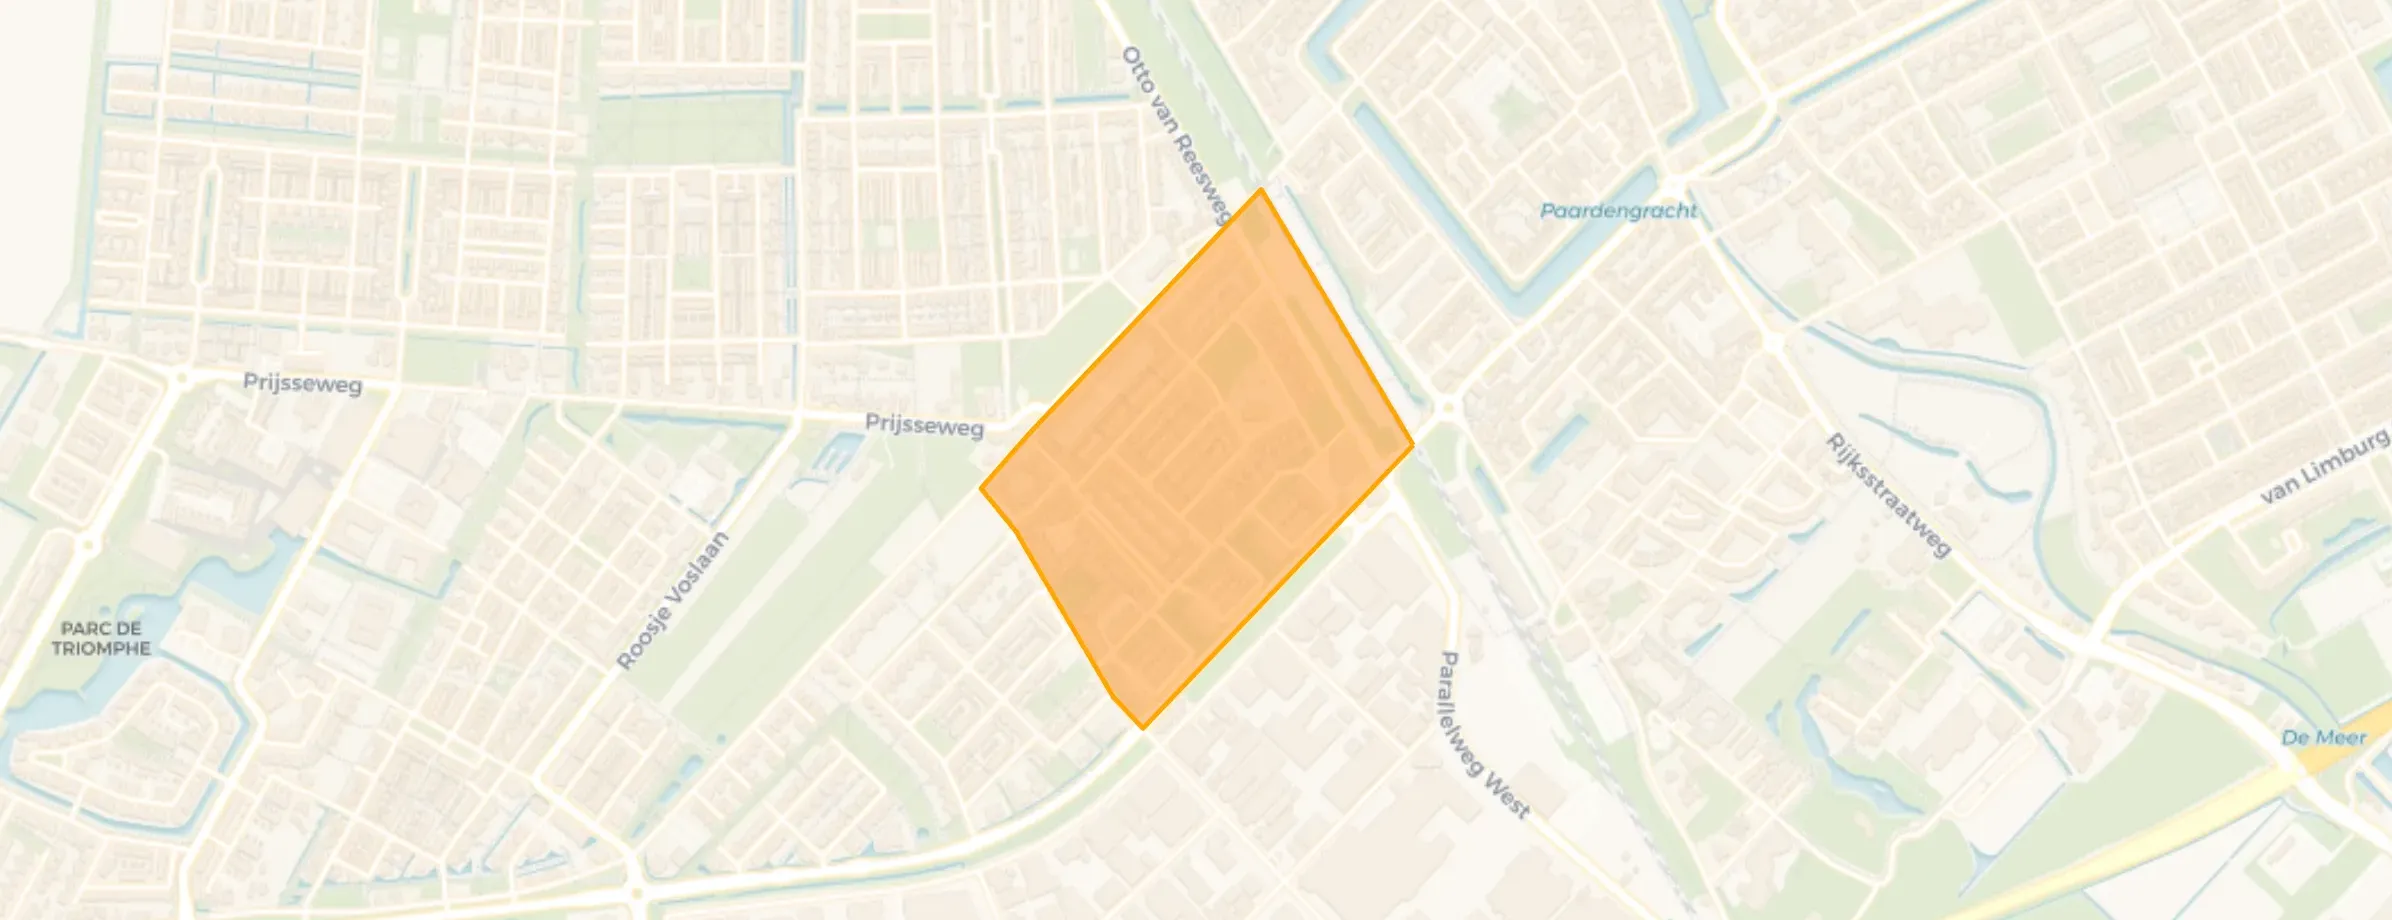
Safe feeling in the neighbourhood
Auto-translated to English by AIThe area feels safe and familiar. Lots of greenery, the public green spaces are properly maintained. Close to shops, the centre and main roads. Downsides are public transport. A 20-minute walk, which is difficult for the elderly. Also the lack of a waste container in the senior neighbourhood.
Auto-translated to English by AILovely people, lots of children, but I do often notice that it's not very easy here with the car. It's usually not very busy here in the evening and at night, occasionally fireworks and partying people. Beautiful nature nearby. Supermarkets within short distances, not easily accessible by car.
Auto-translated to English by AIIt's a cosy neighbourhood; if something happens, they're always there for you. It's safe in our area and it's always pleasant.
Auto-translated to English by AIThe housing stock is relatively young — 87% dates from after 1990.
Over the past year a home for sale in Culemborg West was listed for an average of €614,240 (€4,472 per m²). Last quarter prices fell by 16%.
A rental home in Culemborg West cost an average of €1,578 per month (€15 per m²).
Residents give Culemborg West a 8.1 out of 10 based on 4 reviews. The strongest score is for education (9.3), the weakest for accessibility (5.8).
Wijk Culemborg West has 13,115 residents. Many families: 41% of the households have children.
The housing supply in Culemborg West is remarkably efficient: 89% has an A, A+ or B label. The average natural gas consumption per household is 560 m³ per year.
From Culemborg West you can on average reach a supermarket at 0.8 km, a GP at 0.9 km, a railway station at 2.2 km, a primary school at 0.7 km (as the crow flies, source: CBS).
Right now you will find 53 homes for sale in Culemborg West.







