District in Leiden
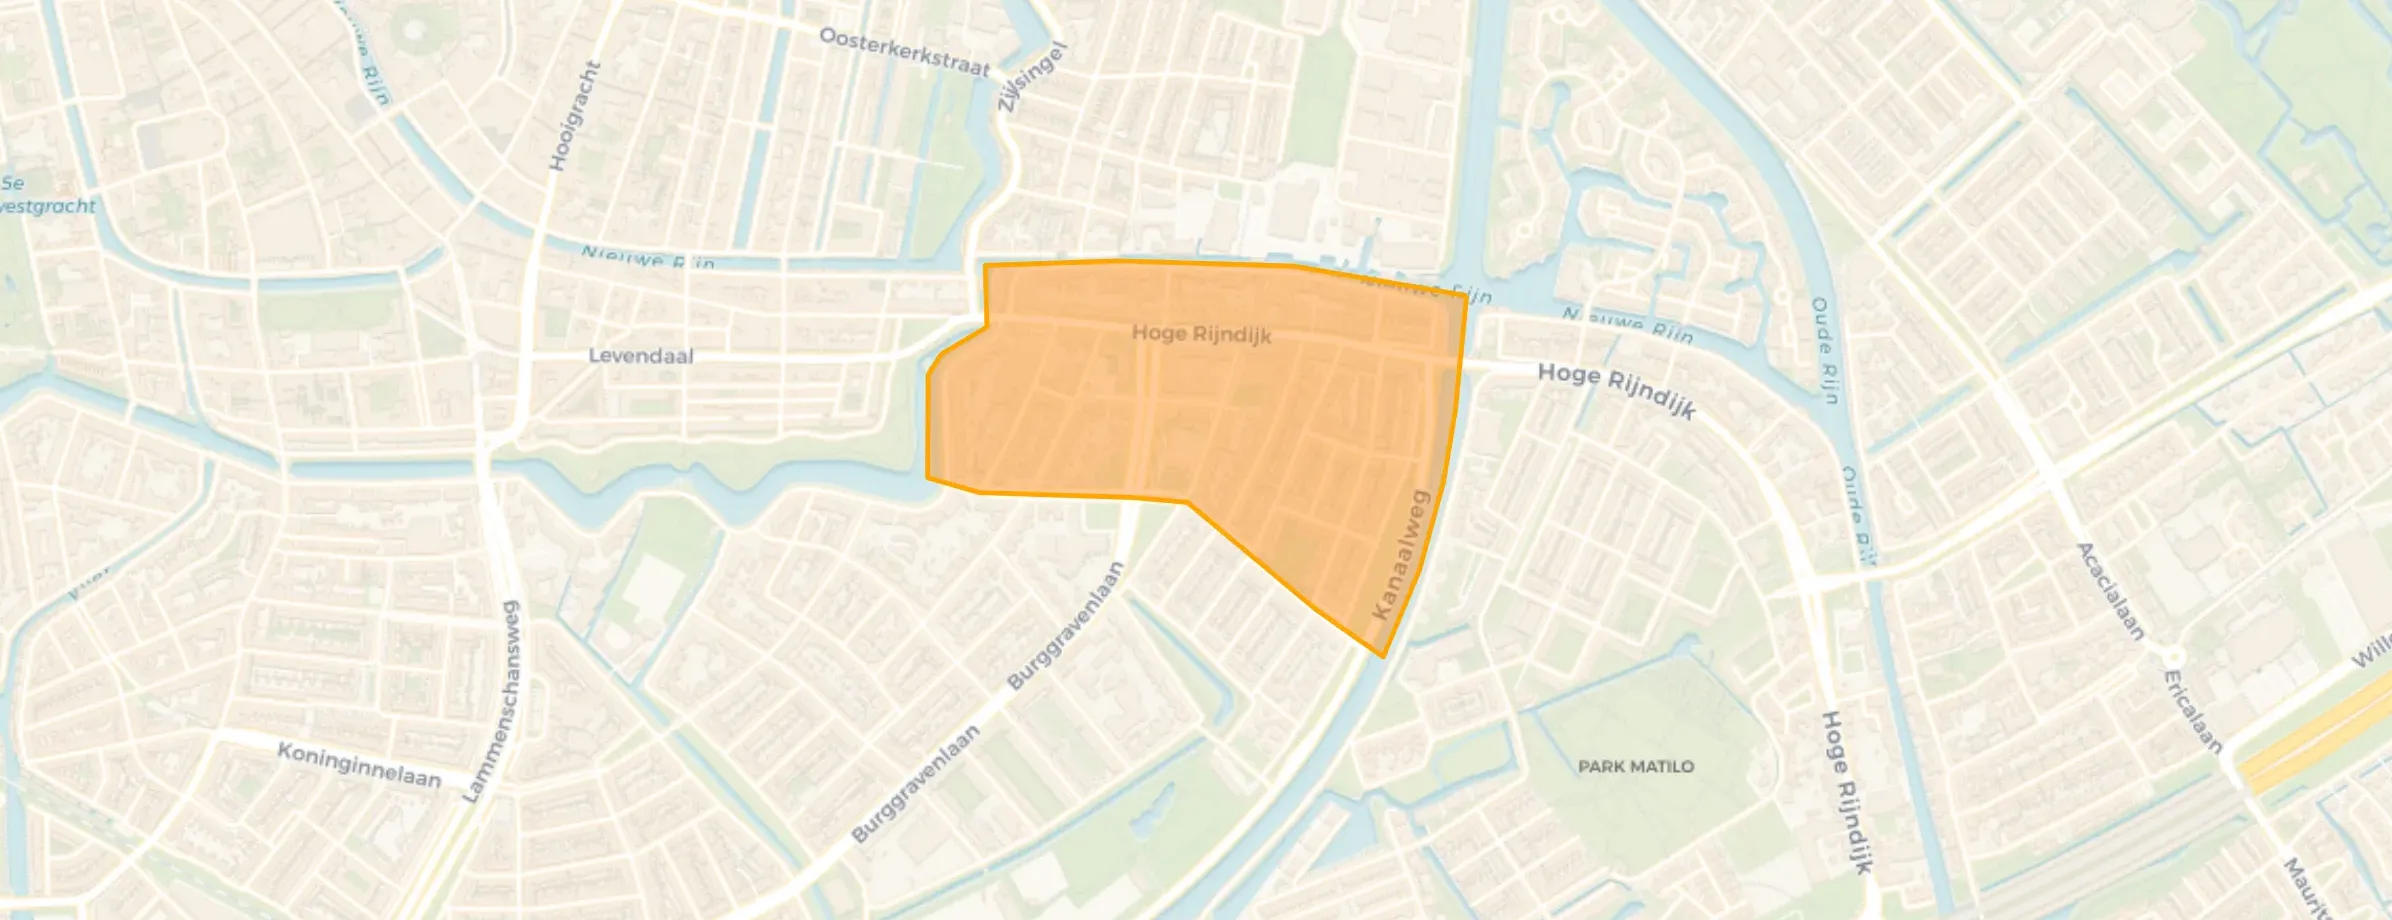
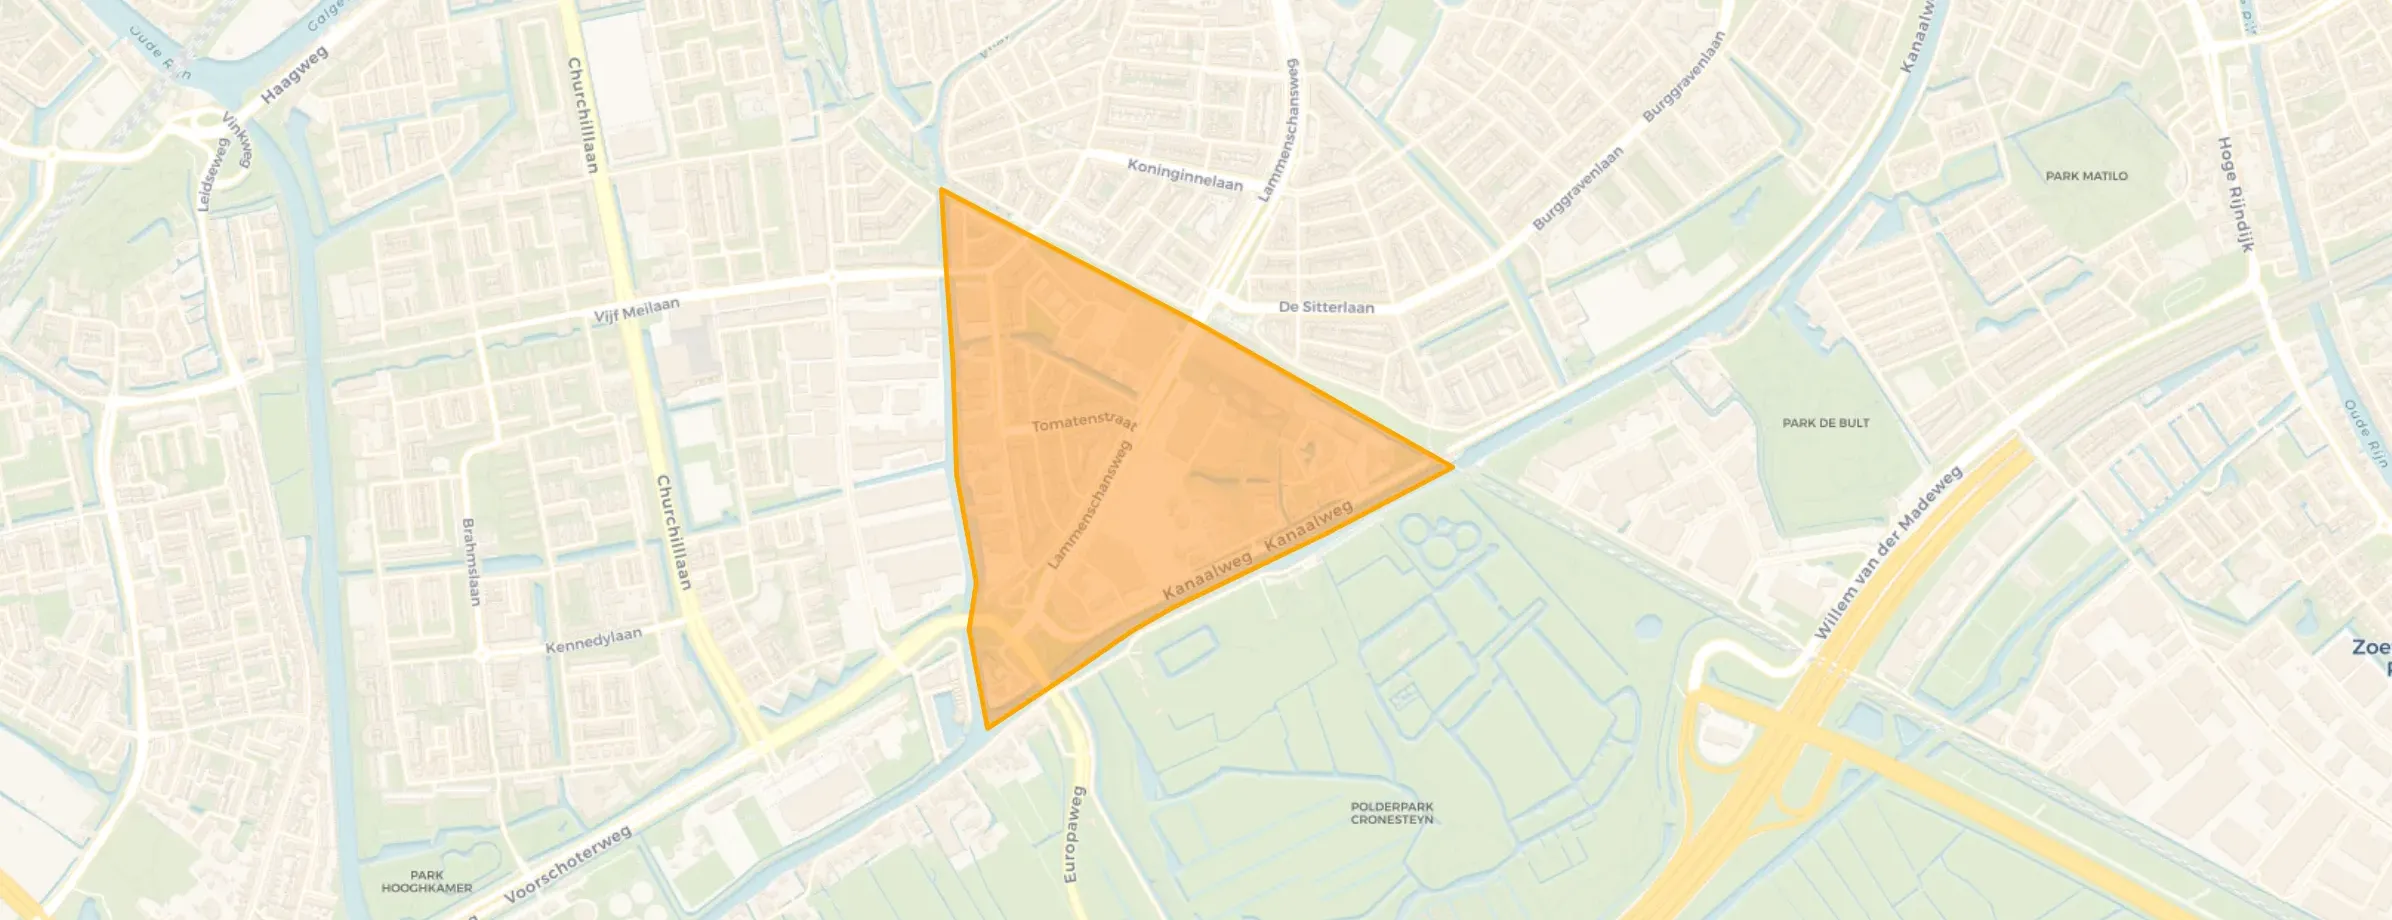
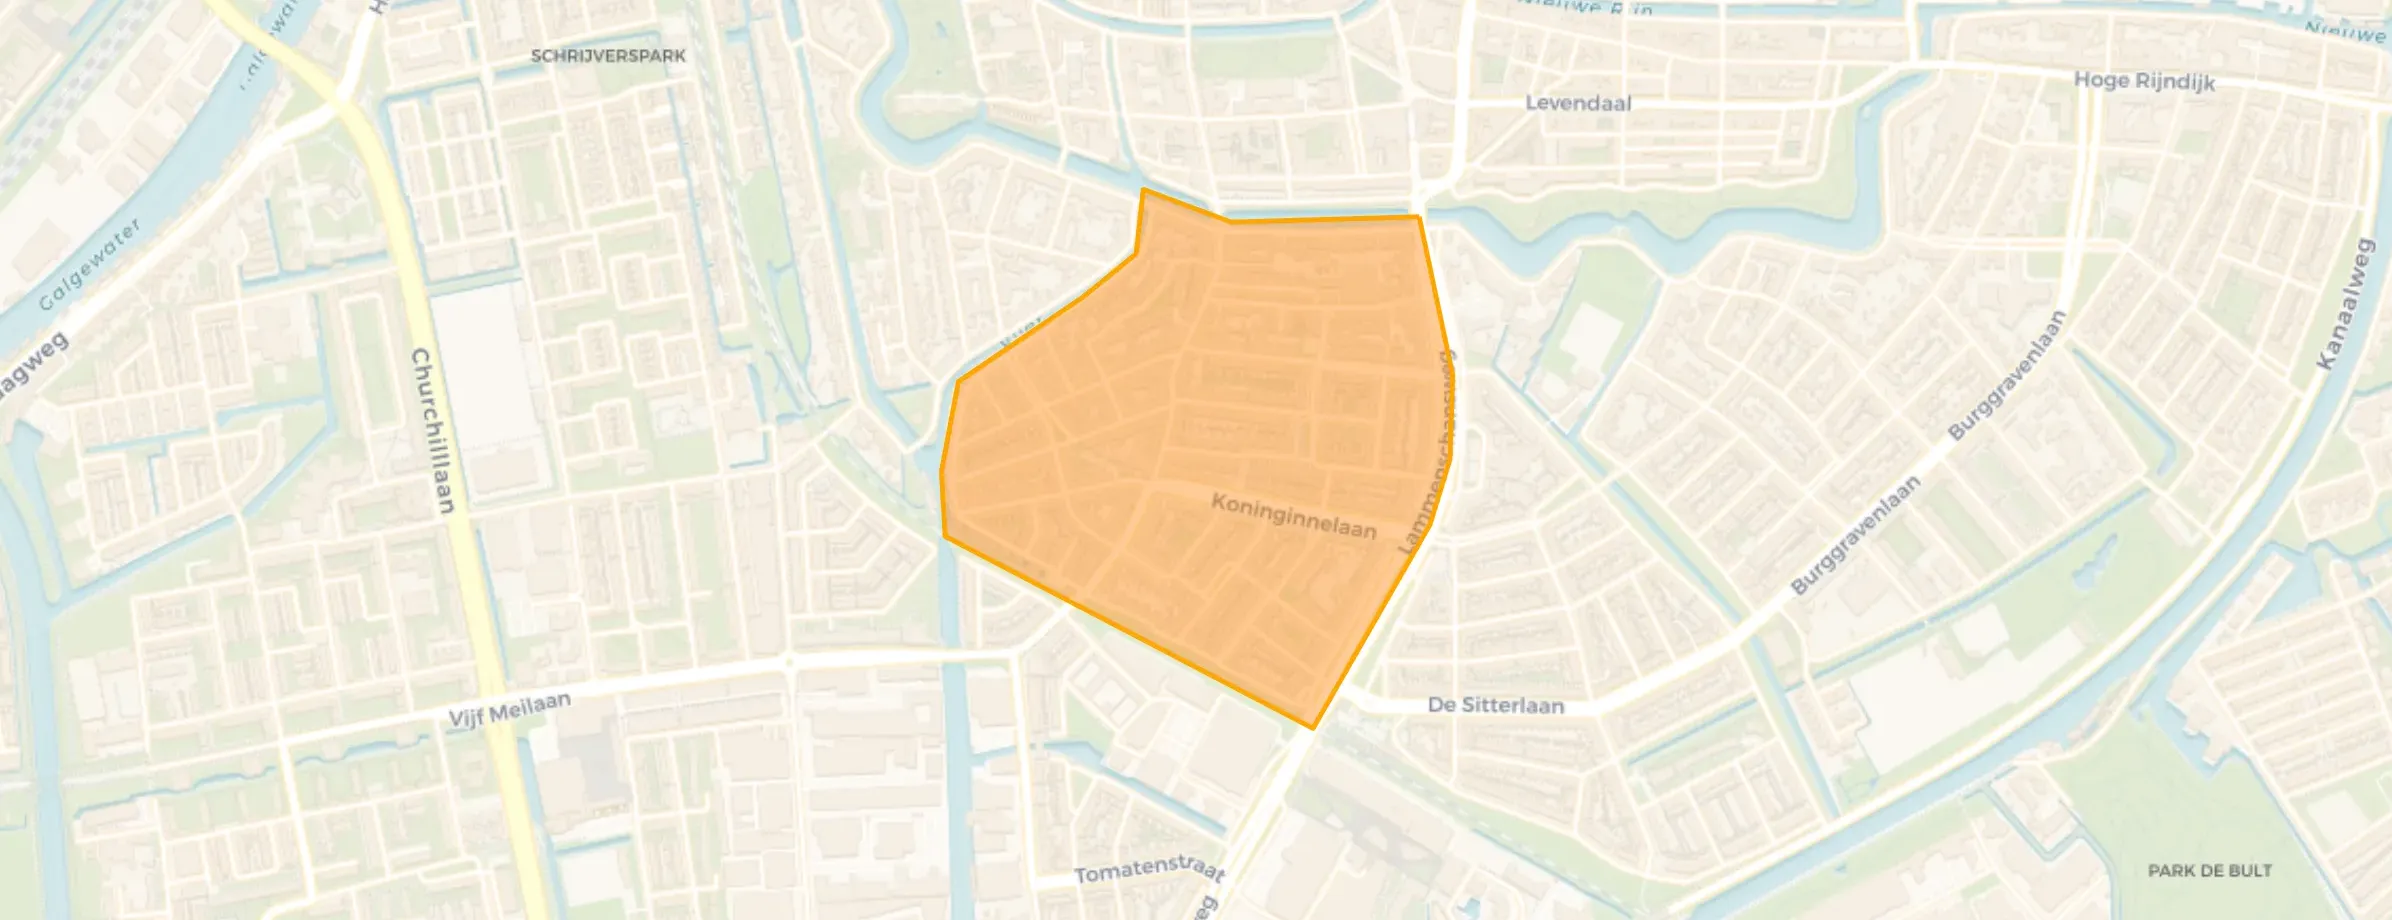
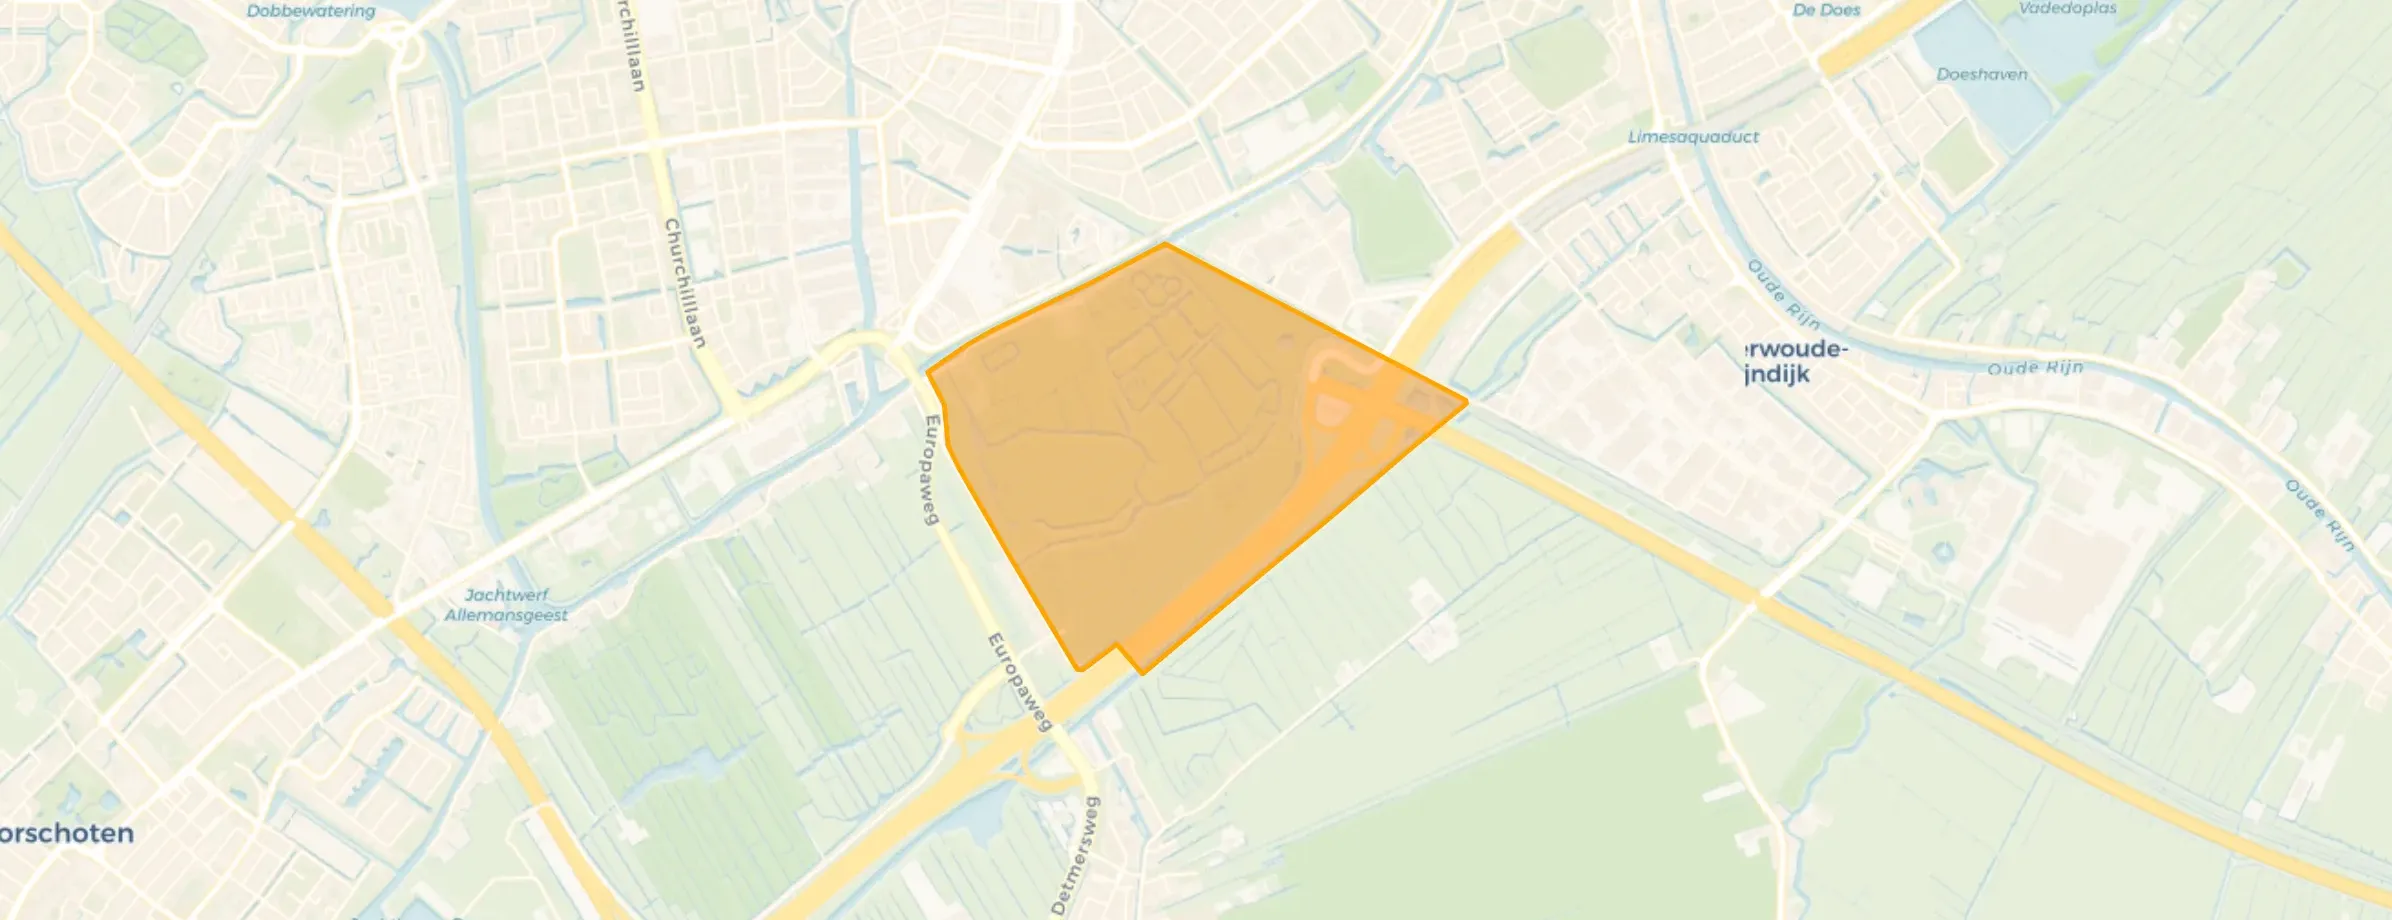
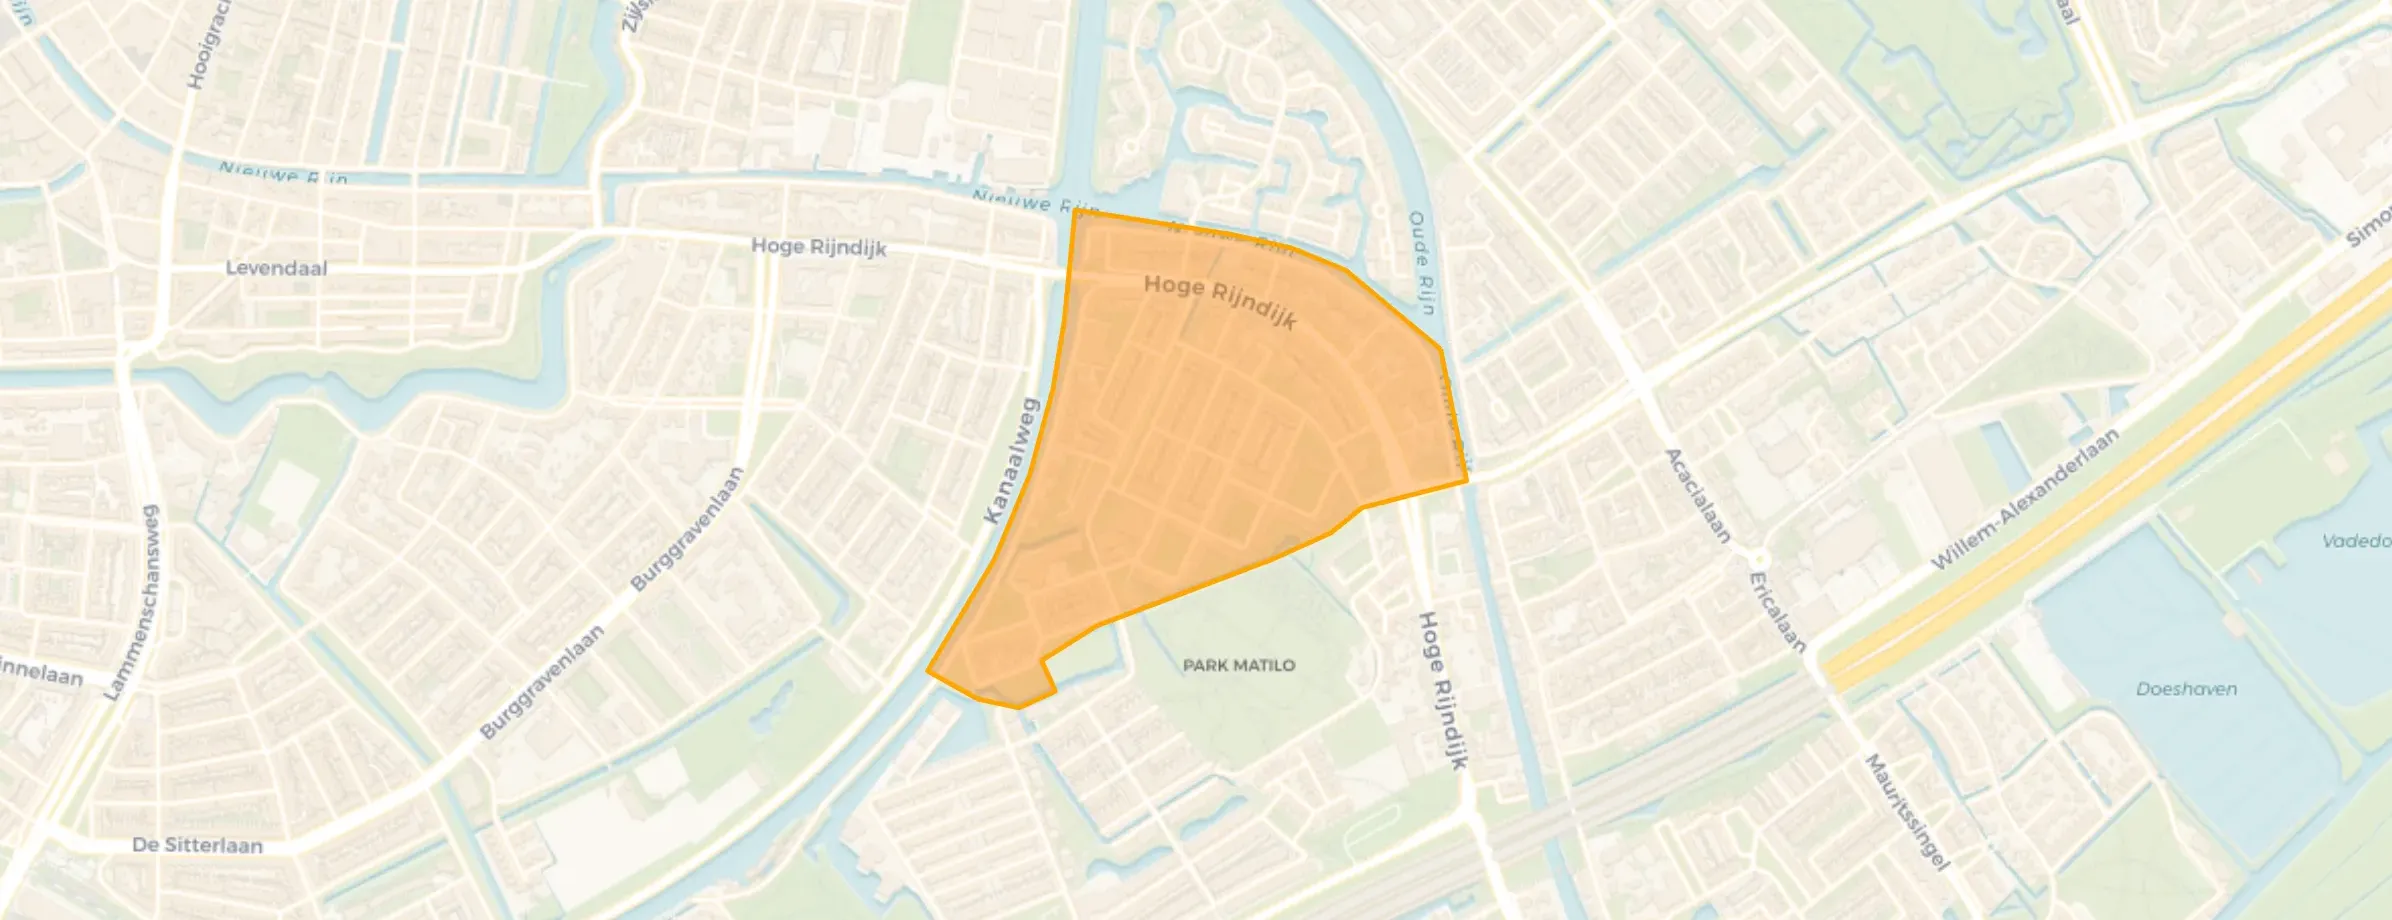
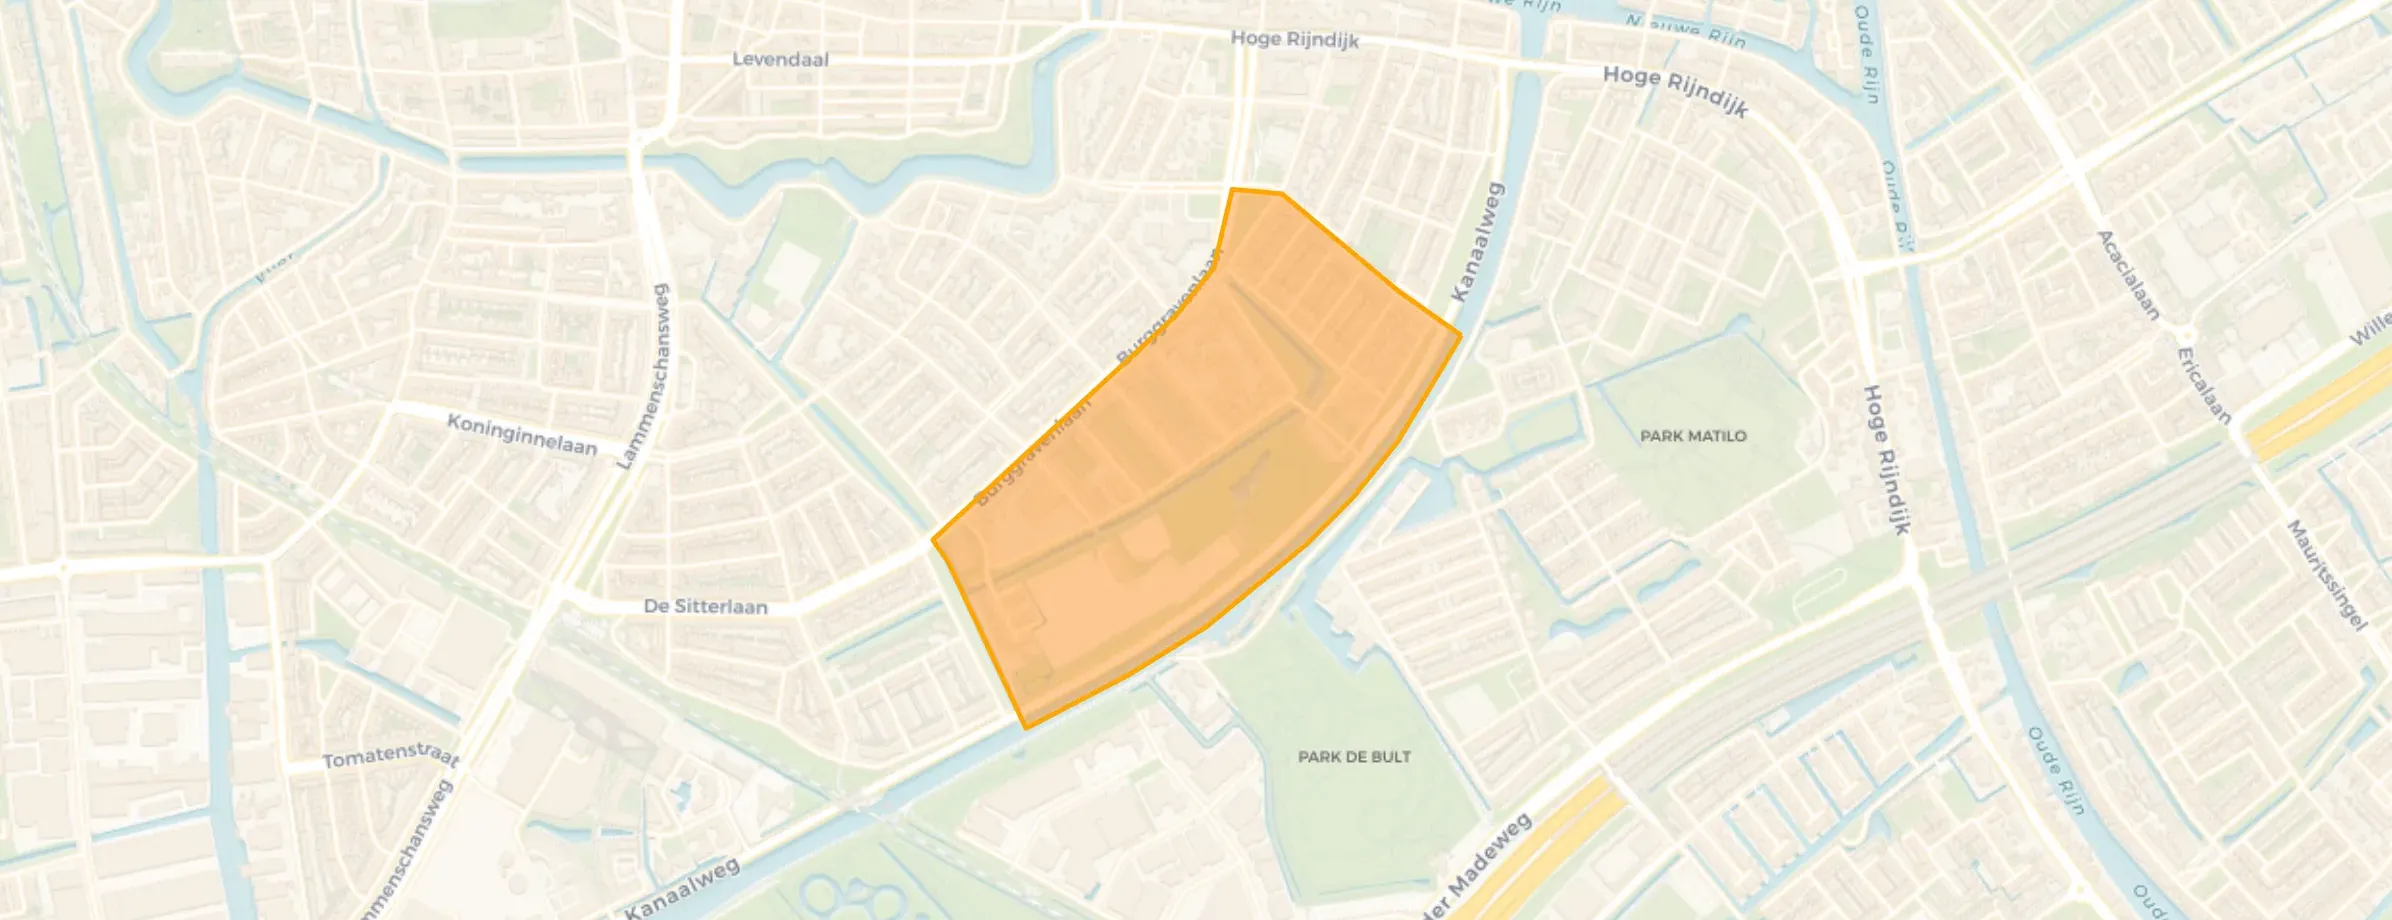
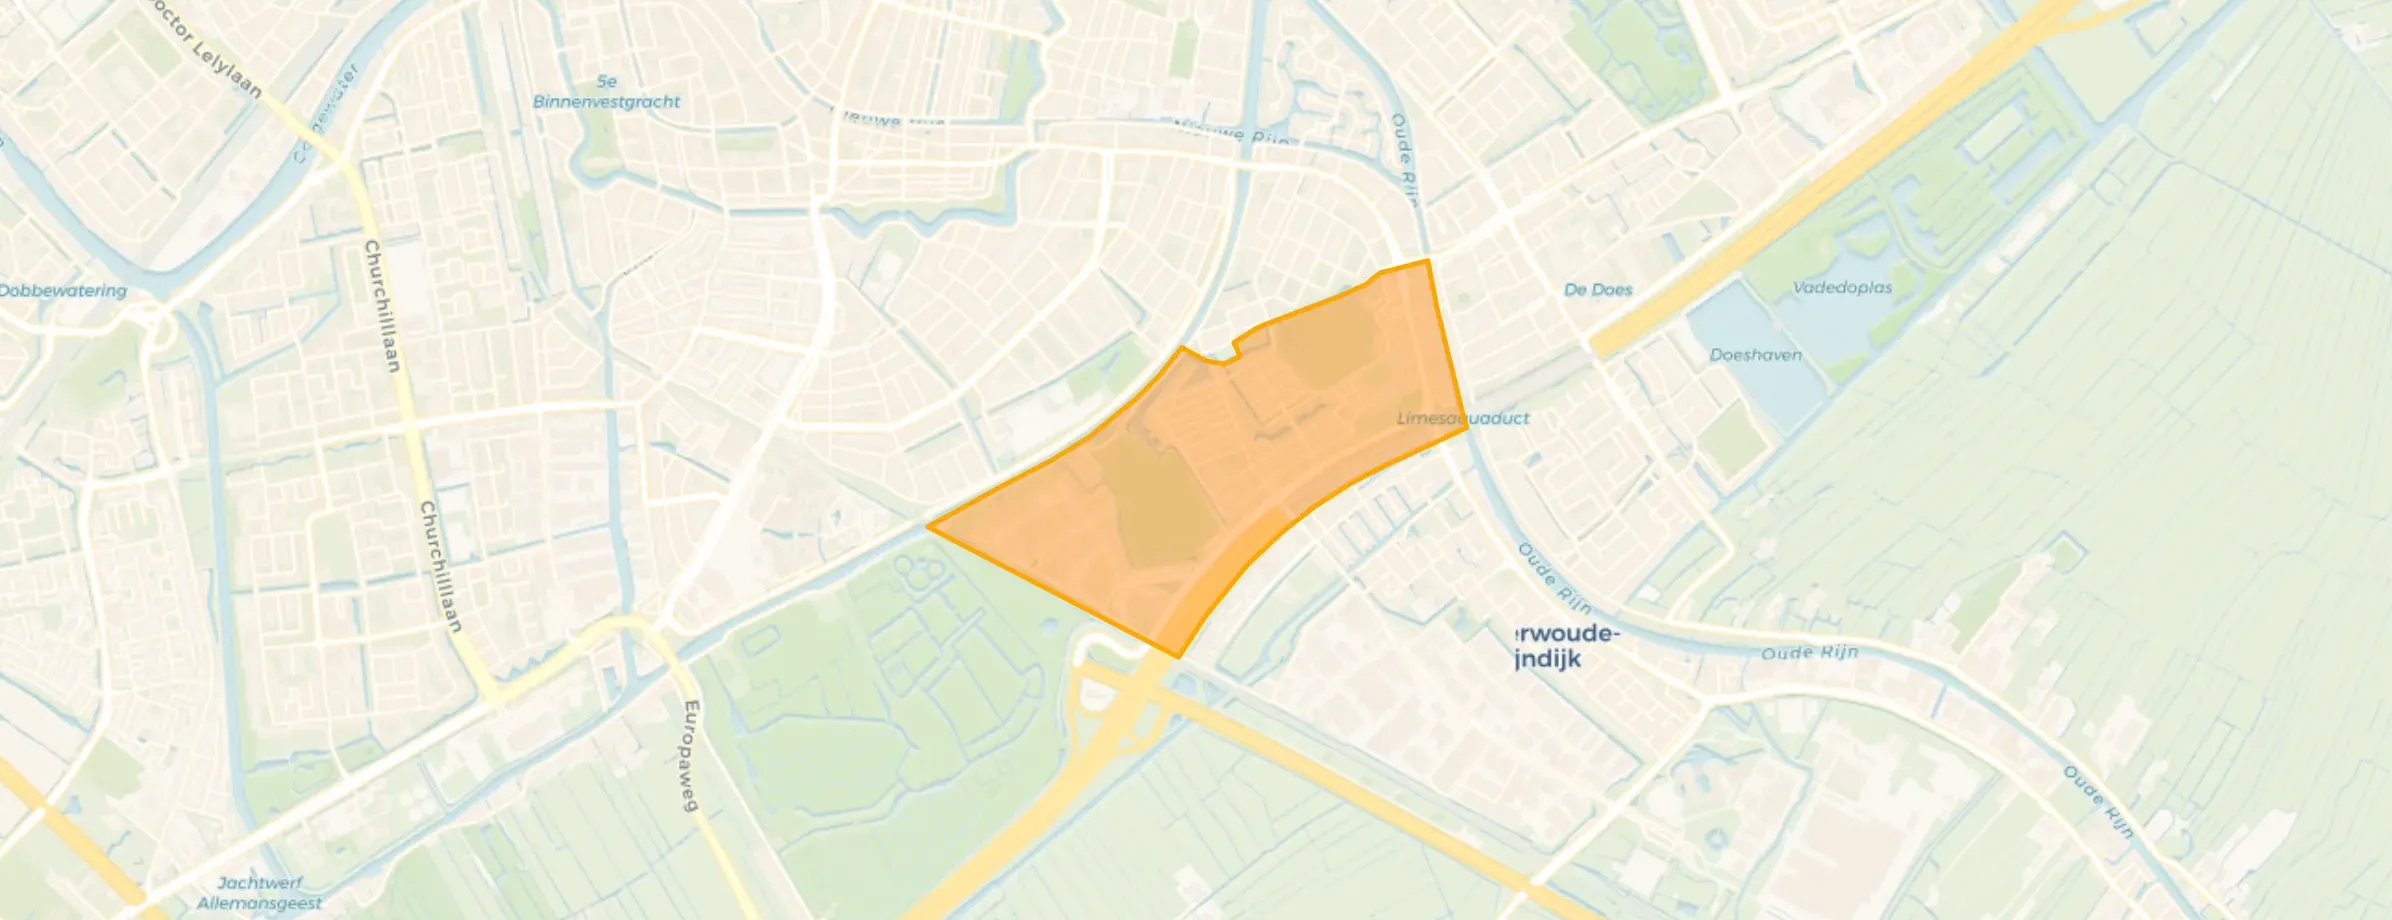
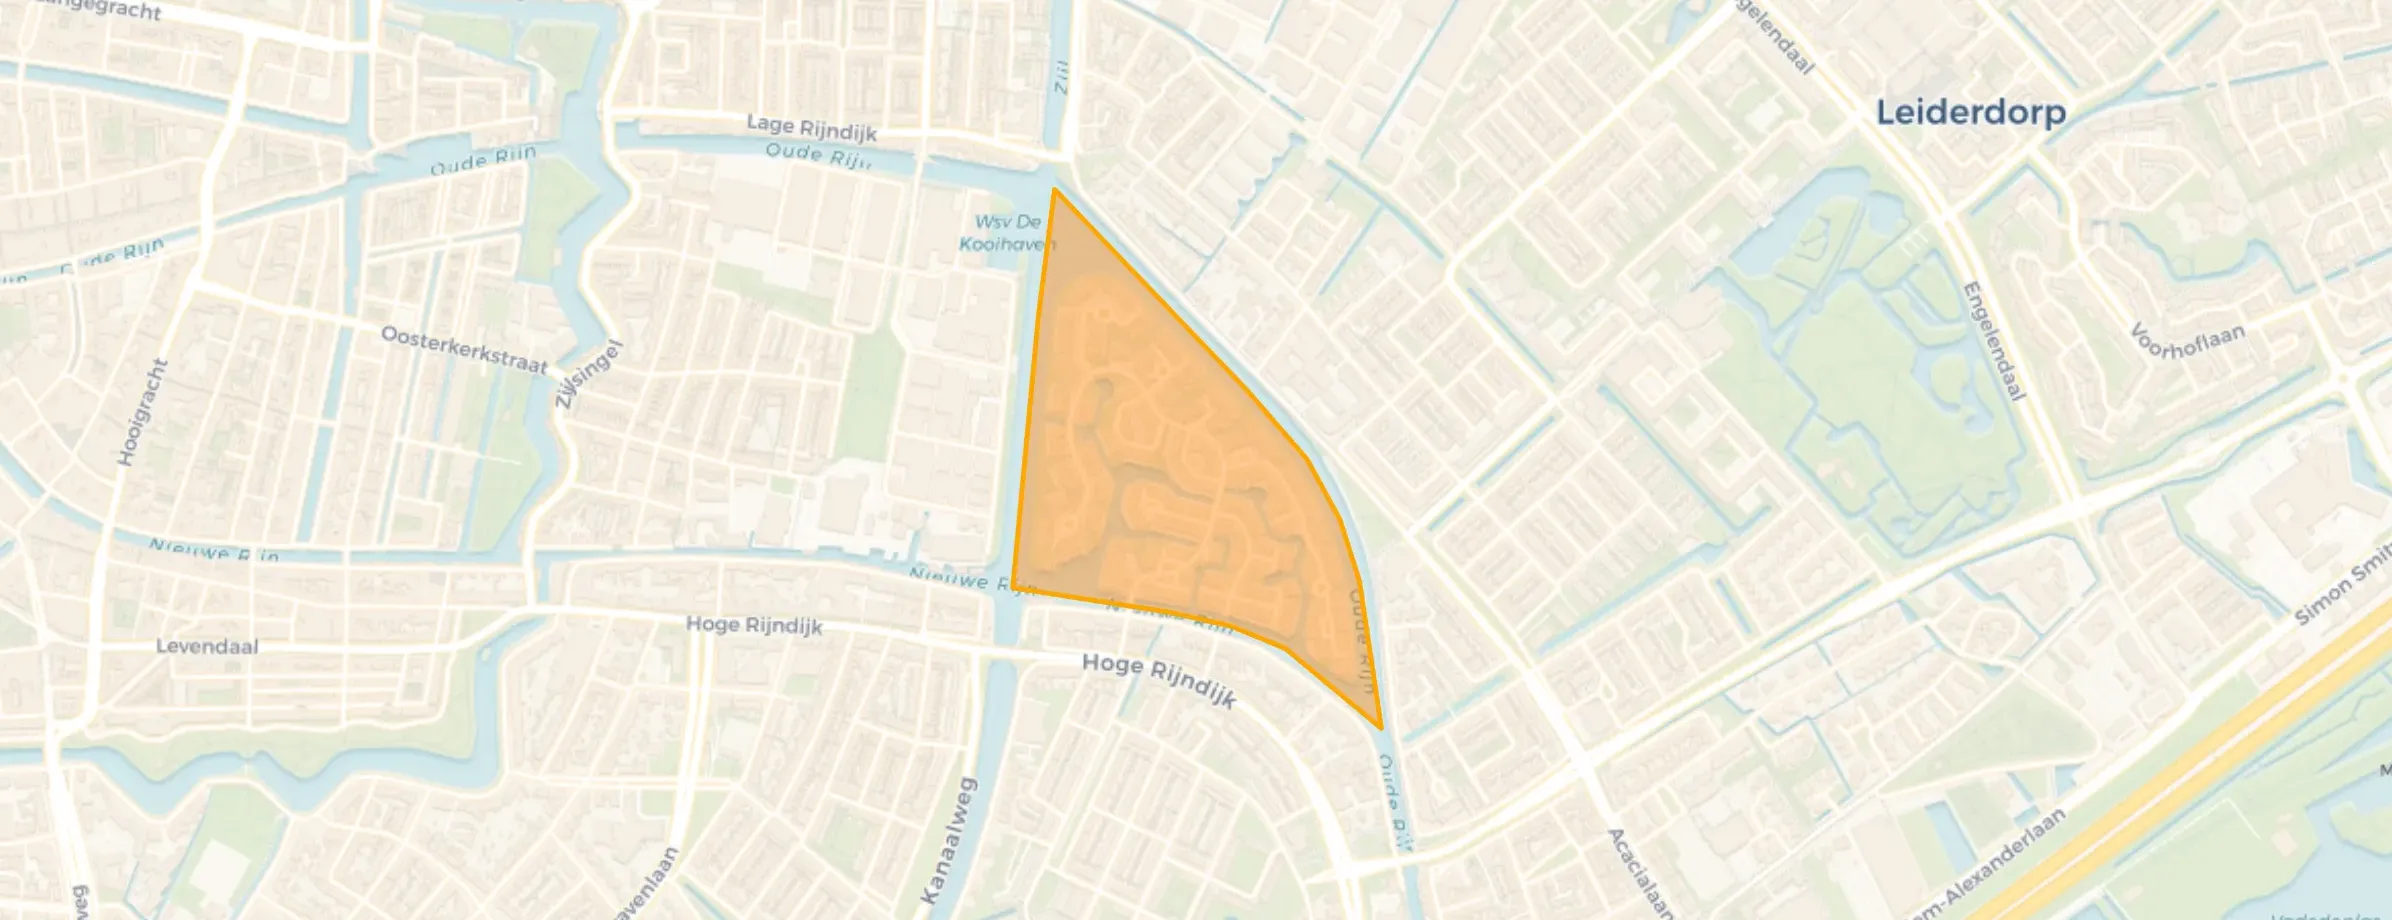
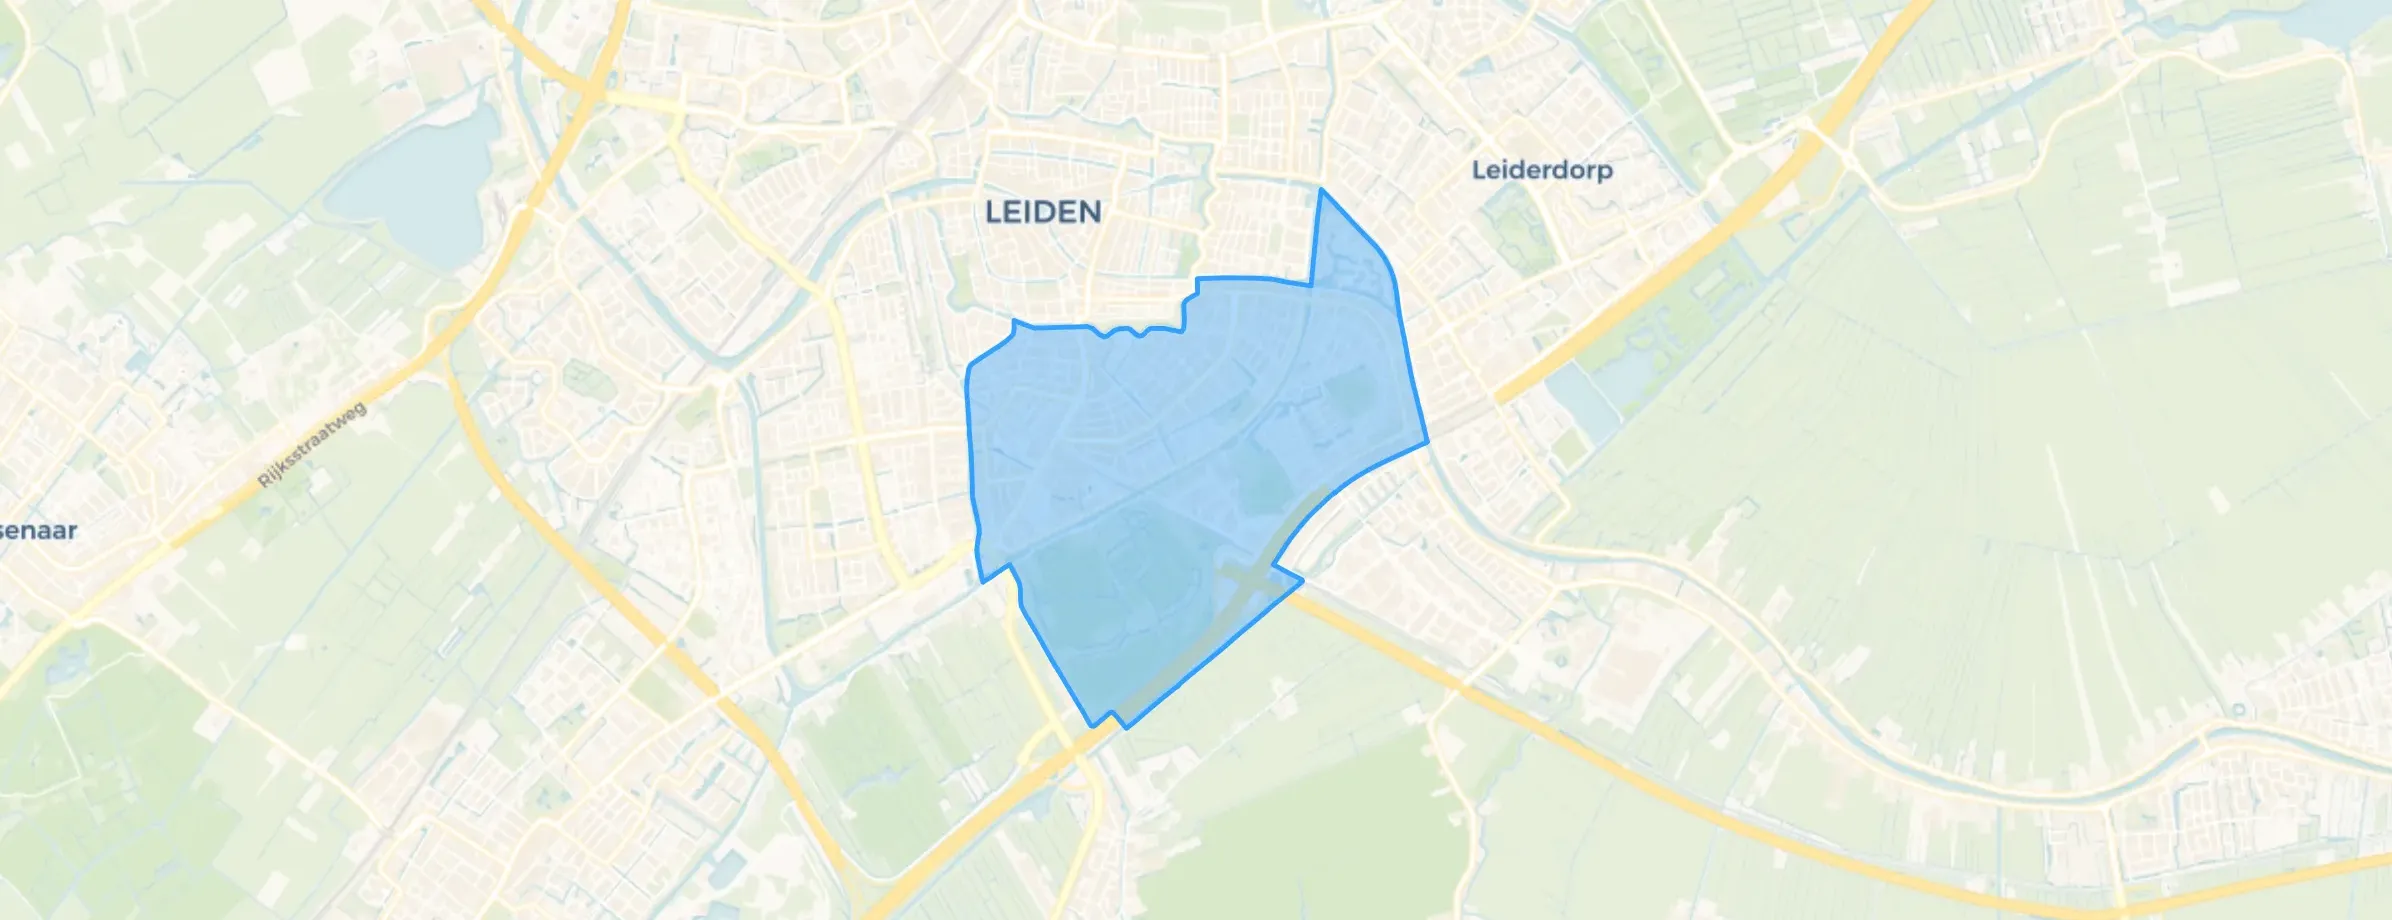
Roodenburgerdistrict is located in the province of Zuid-Holland, in the municipality of Leiden The district has a total area of 478 hectares, of which 442 hectares are land and 35 hectares are water. The district is coded as WK054604. The postcode area is 2313AA-2322VW.
Roodenburgerdistrict has 24.075 residents. Of these, 47,9% are men and 52,1% are women. Most residents are 25 to 45 years (31,4%). The other age groups are 24,2% for '45 to 65 years', 16,4% for '65 years or older', 14,8% for '15 to 25 years' and 13,3% for '0 to 15 years'. Of the residents, 61,5% is unmarried, 28,8% is married, 6,4% is divorced and 3,3% is widowed. 16.475 residents originate from the Netherlands, 3.105 come from Europe and 4.500 come from countries outside Europe.
There are 12.770 households in Roodenburgerdistrict. 49,8% of these are single-person households, 26,4% households without children and 23,8% households with children. The average household size is 1,9 persons. The national average is 2,1 persons.
In Roodenburgerdistrict there are 19.200 income recipients. The average income per income recipient is €50.300, which is €8.100 (19%) higher than the national average of €42.200. Per resident, the average income is €42.000, which is €7.100 (20%) higher than the national average of €34.900. Most residents of Roodenburgerdistrict are highly educated. 58,6% have a university or higher professional education (HBO/WO), 27,4% have an intermediate education (HAVO, VWO or MBO 2-4) and 13,9% have a lower education (VMBO or MBO 1).
Of the 24.075 residents, around 74% are in paid employment, which amounts to 17.816 people. This is 2% higher than the national average of 72%. The majority of workers are in salaried employment (85%), while 15% are self-employed. In Roodenburgerdistrict, 20% of residents receive a benefit. The largest group is those receiving a state pension (AOW). 3.510 people receive this benefit.
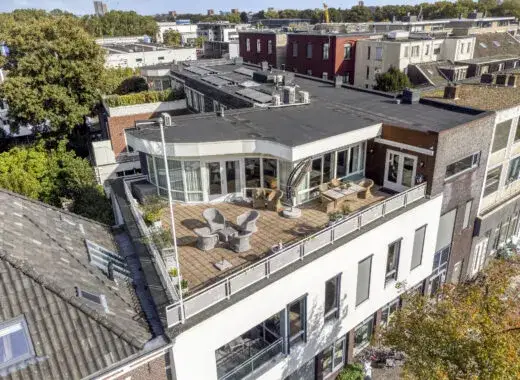
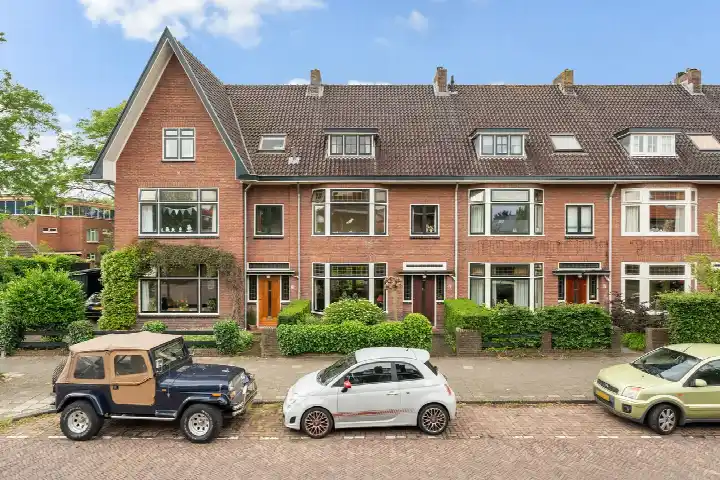
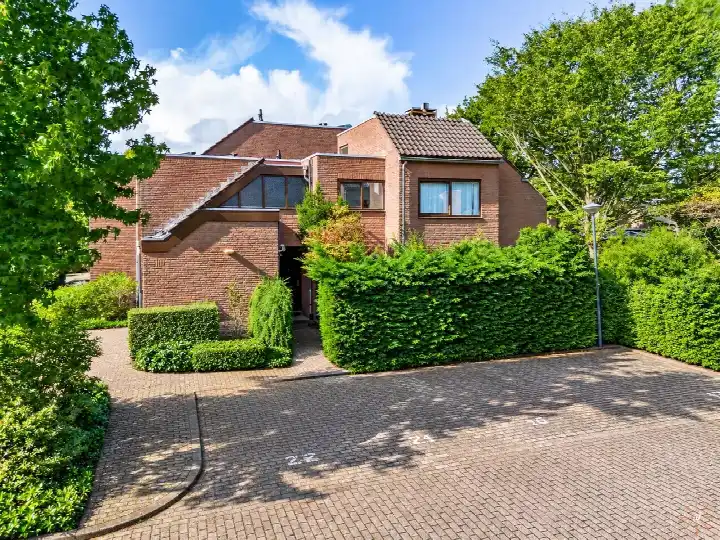
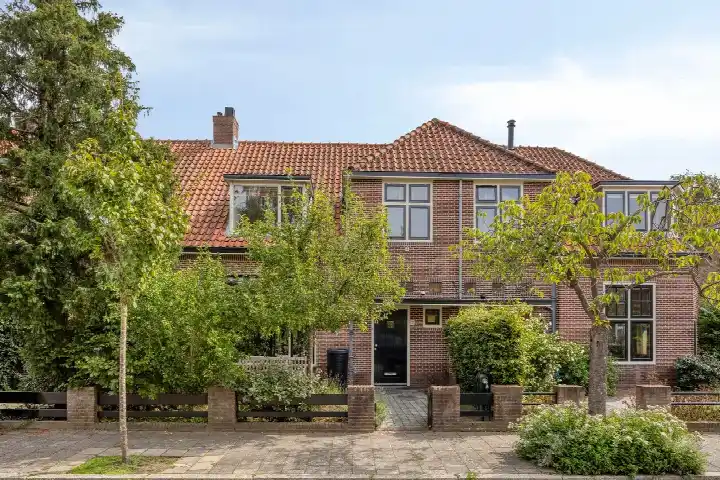
In Roodenburgerdistrict there are 12.420 homes with an average assessed value (WOZ) of €460.000. Of these, around 97% are occupied and 3% unoccupied. In Roodenburgerdistrict there are roughly as many rental as owner-occupied homes. This amounts to 51% rental homes and 49% owner-occupied homes. Of the homes, 49% privately owned, 18% owned by housing associations and 32% owned by other landlords. The most common construction periods in Roodenburgerdistrict are 1925-1950 (20%) and 1950-1970 (20%).
There are currently no homes for sale in Roodenburgerdistrict. The most recently listed home is Hoge Rijndijk 88E by Graal Makelaardij op Funda. No homes were sold in Roodenburgerdistrict over the past year.
There are currently no homes for rent in Roodenburgerdistrict. The most recent home is Lammenschansweg 301, offered by www.hureninhollandrijnland.nl. No homes were let in Roodenburgerdistrict over the past year.
No recent rental data available for Roodenburgerdistrict.
In Roodenburgerdistrict there are 8.947 addresses with a registered energy label. The most common labels are A (30%), C (18%) and B (10%). On average, an address in Roodenburgerdistrict uses 2.090 kWh of electricity per year. This is 18% below the national average of 2.550 kWh. With an annual consumption of 630 m³ per address, natural gas consumption is 21% below the national average of 800 m³.
Police often around. On the grass field where children play, dogs are often walked and the owners leave the dog poop lying around.
Auto-translated to English by AINice, friendly neighbourhood where people see each other and help where they can. The authentic appearance of the houses and convenient location relative to the centre of Leiden
Auto-translated to English by AIIt's close to EVERYTHING - which is super nice, especially the station! The centre is also nice and close. The people are friendly and not loud. There's a lot of greenery and a park nearby. It's great!
Auto-translated to English by AIIt is always quiet to live there, but when you need something from specific shops, it is necessary to leave the village. This also applies to restaurants or clubs, for example. It is a beautiful area along the water, but real parks or forests are missing here.
Auto-translated to English by AIGood growing up in a neighbourhood like this and a nice environment for a dog
Auto-translated to English by AIHello, there are nice parks to walk in, but unfortunately they are broken up by roads. Community gets a 2 because in my opinion nobody is really connected. No community centre, but also, nobody WANTS to connect with the neighbours either. Houses are poorly renovated. Lots of schools. Good amenities.
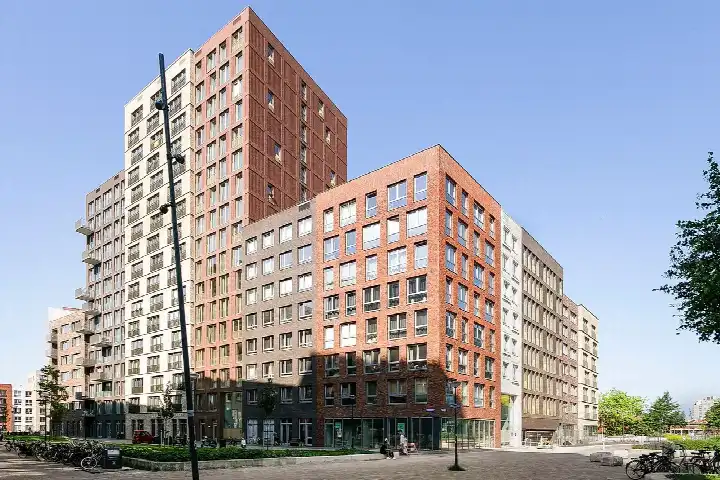
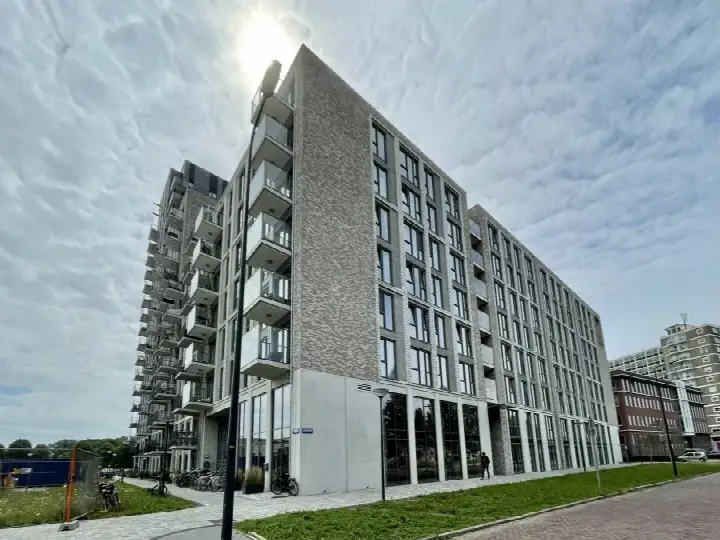
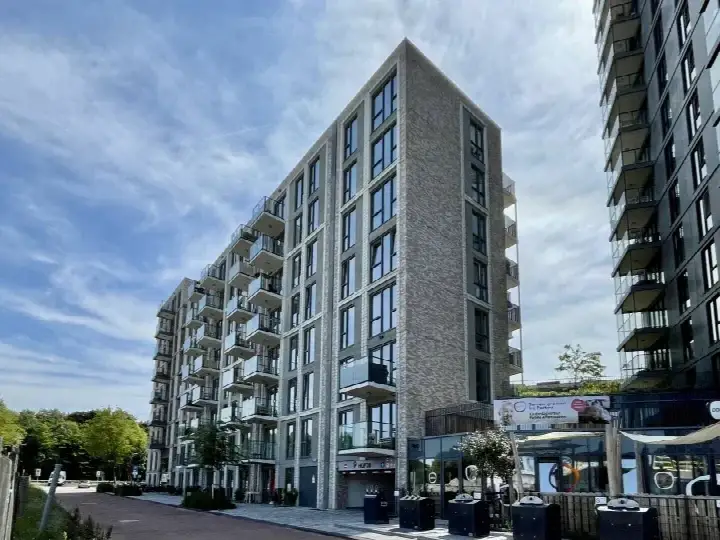
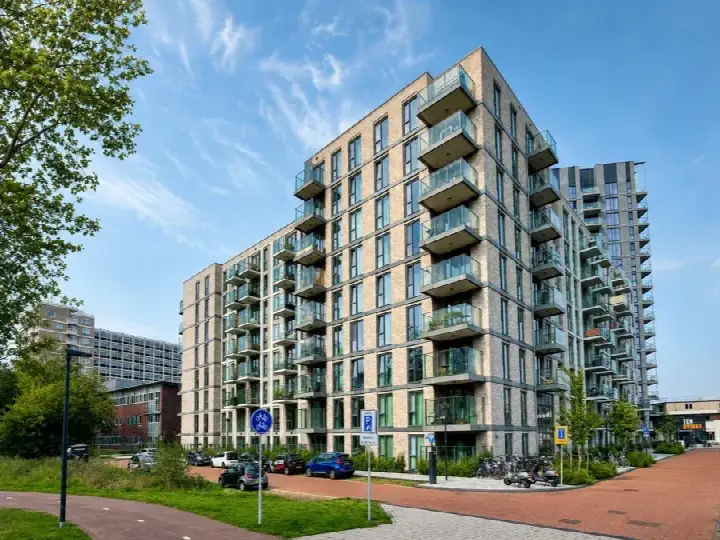
Auto-translated to English by AIMy neighbourhood is very varied in housing. You can find social housing and owner-occupied homes here. In the middle of the neighbourhood there is an industrial estate. To the east, high-rise buildings with apartments and student flats. To the north-west, there are mainly terraced houses. The neighbourhood is located on Lammeschansweg and almost directly on the motorway, so it is easily accessible. There are also many amenities such as a Plus, Intersport, Gamma, etc.
Auto-translated to English by AIThe most common type is flats (64%).
Over the past year a home for sale in Roodenburgerdistrict was listed for an average of €589,858 (€5,793 per m²).
A rental home in Roodenburgerdistrict cost an average of €1,882 per month (€22 per m²).
Residents give Roodenburgerdistrict a 7.6 out of 10 based on 7 reviews. Especially accessibility (8.6) scores well; community (6.6) receives the lowest rating.
Wijk Roodenburgerdistrict has 24,075 residents. The largest age group is 25 to 45 years (31%). Notably, 50% of the households are single-person households.
The housing supply in Roodenburgerdistrict is remarkably efficient: 67% has an A, A+ or B label. The average natural gas consumption per household is 630 m³ per year.
From Roodenburgerdistrict you can on average reach a supermarket at 0.7 km, a GP at 0.6 km, a railway station at 2.0 km, a primary school at 0.9 km (as the crow flies, source: CBS).
Right now you will find 139 homes for sale and 35 homes for rent in Roodenburgerdistrict.