Neighbourhood in Tilburg
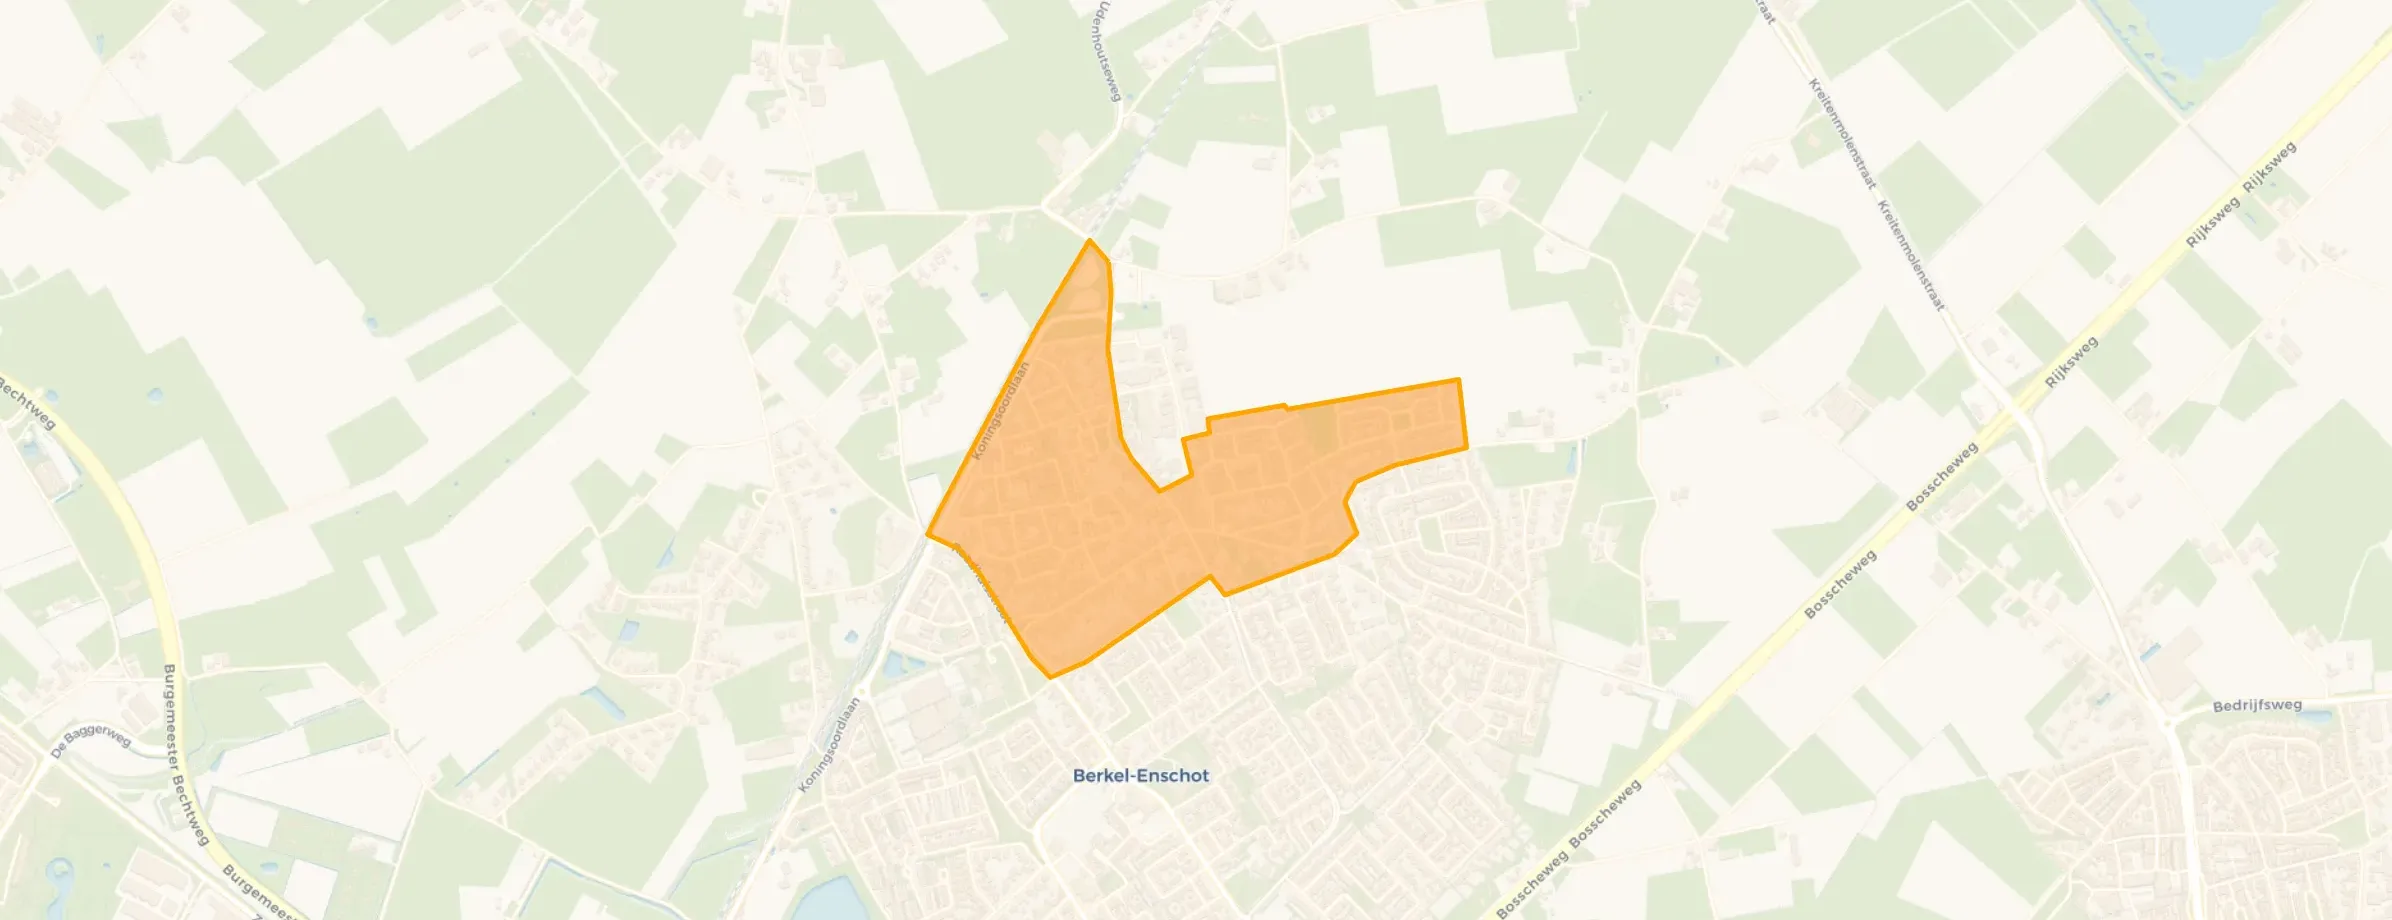
Berkel Noord is located in the province of Noord-Brabant, in the municipality of Tilburg, in the district Berkel-Enschot The neighbourhood has a total area of 50 hectares, of which 50 hectares are land and 0 hectares are water. The neighbourhood is coded as BU08556606. The postcode area is 5056HC-5057BM.
Berkel Noord has 2.435 residents. Of these, 50,5% are men and 49,3% are women. Most residents are 45 to 65 years (29,4%). The other age groups are 25,3% for '25 to 45 years', 18,5% for '0 to 15 years', 16,8% for '65 years or older' and 9,7% for '15 to 25 years'. Of the residents, 46,6% is unmarried, 42,1% is married, 7,8% is divorced and 3,5% is widowed. 2.140 residents originate from the Netherlands, 130 come from Europe and 155 come from countries outside Europe.
There are 1.035 households in Berkel Noord. 28,0% of these are single-person households, 30,9% households without children and 41,1% households with children. The average household size is 2,4 persons. The national average is 2,1 persons.
In Berkel Noord there are 2.000 income recipients. The average income per income recipient is €43.200, which is €1.000 (2%) higher than the national average of €42.200. Per resident, the average income is €34.600, which is €300 (1%) lower than the national average of €34.900. Most residents of Berkel Noord are educated to an intermediate level. 46,4% have an intermediate education (HAVO, VWO or MBO 2-4), 35,0% have a university or higher professional education (HBO/WO) and 18,6% have a lower education (VMBO or MBO 1).
Of the 2.435 residents, around 78% are in paid employment, which amounts to 1.899 people. This is 6% higher than the national average of 72%. The majority of workers are in salaried employment (83%), while 17% are self-employed. In Berkel Noord, 22% of residents receive a benefit. The largest group is those receiving a state pension (AOW). 360 people receive this benefit.
In Berkel Noord there are 1.024 homes with an average assessed value (WOZ) of €466.000. Of these, around 99% are occupied and 1% unoccupied. Most homes are owner-occupied. This amounts to 33% rental homes and 67% owner-occupied homes. Of the homes, 67% privately owned, 23% owned by housing associations and 10% owned by other landlords. The most common construction periods in Berkel Noord are 1980-1990 (37%) and 2010-2020 (30%).
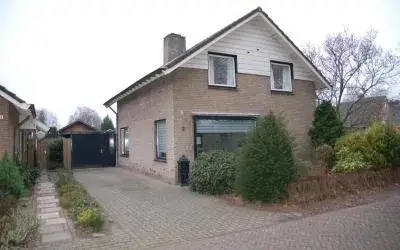
There are currently 6 homes for sale in Berkel Noord. The most recently listed home is Durendaelweg 59 by CVDA. Makelaar en Taxateur. Over the past year, 56 homes were sold in Berkel Noord. On average, a home was sold within 41 days.
The average asking price for a home for sale in Berkel Noord over the past year was €659.482. This is 42% higher than the average assessed value (WOZ) of €466.000. The average asking price per m² of plot is €3.453.
There is 1 homes for rent in Berkel Noord. The most recent home is Dom S. Dubuissonstraat 4, offered by www.woninginzicht.nl. Over the past year, 5 homes were let in Berkel Noord. On average, a listing was let within 27 days.
The average rent for a rental home in Berkel Noord over the past year was €1.450 per month. Per m² of plot area that is €11 per month.
In Berkel Noord there are 684 addresses with a registered energy label. The most common labels are A (37%), B (29%) and C (18%). On average, an address in Berkel Noord uses 3.080 kWh of electricity per year. This is 21% above the national average of 2.550 kWh. Natural gas consumption, at 830 m³ per year, is 4% above the national average of 800 m³.
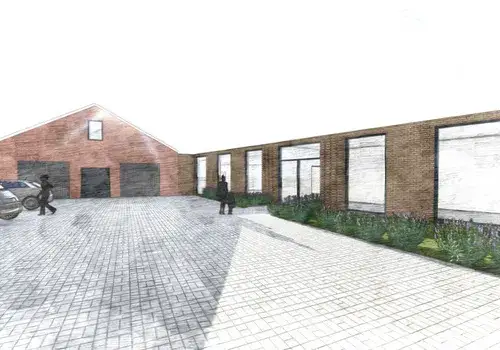
The housing stock is relatively young — 70% dates from after 1990.
Over the past year a home for sale in Berkel Noord was listed for an average of €659,482 (€4,332 per m²). That is 25% above the Dutch national average.
Buurt Berkel Noord has 2,435 residents. Many families: 41% of the households have children.
The housing supply in Berkel Noord is remarkably efficient: 86% has an A, A+ or B label. The average natural gas consumption per household is 830 m³ per year.
From Berkel Noord you can on average reach a supermarket at 1.1 km, a GP at 0.9 km, a railway station at 5.7 km, a primary school at 1.4 km (as the crow flies, source: CBS).