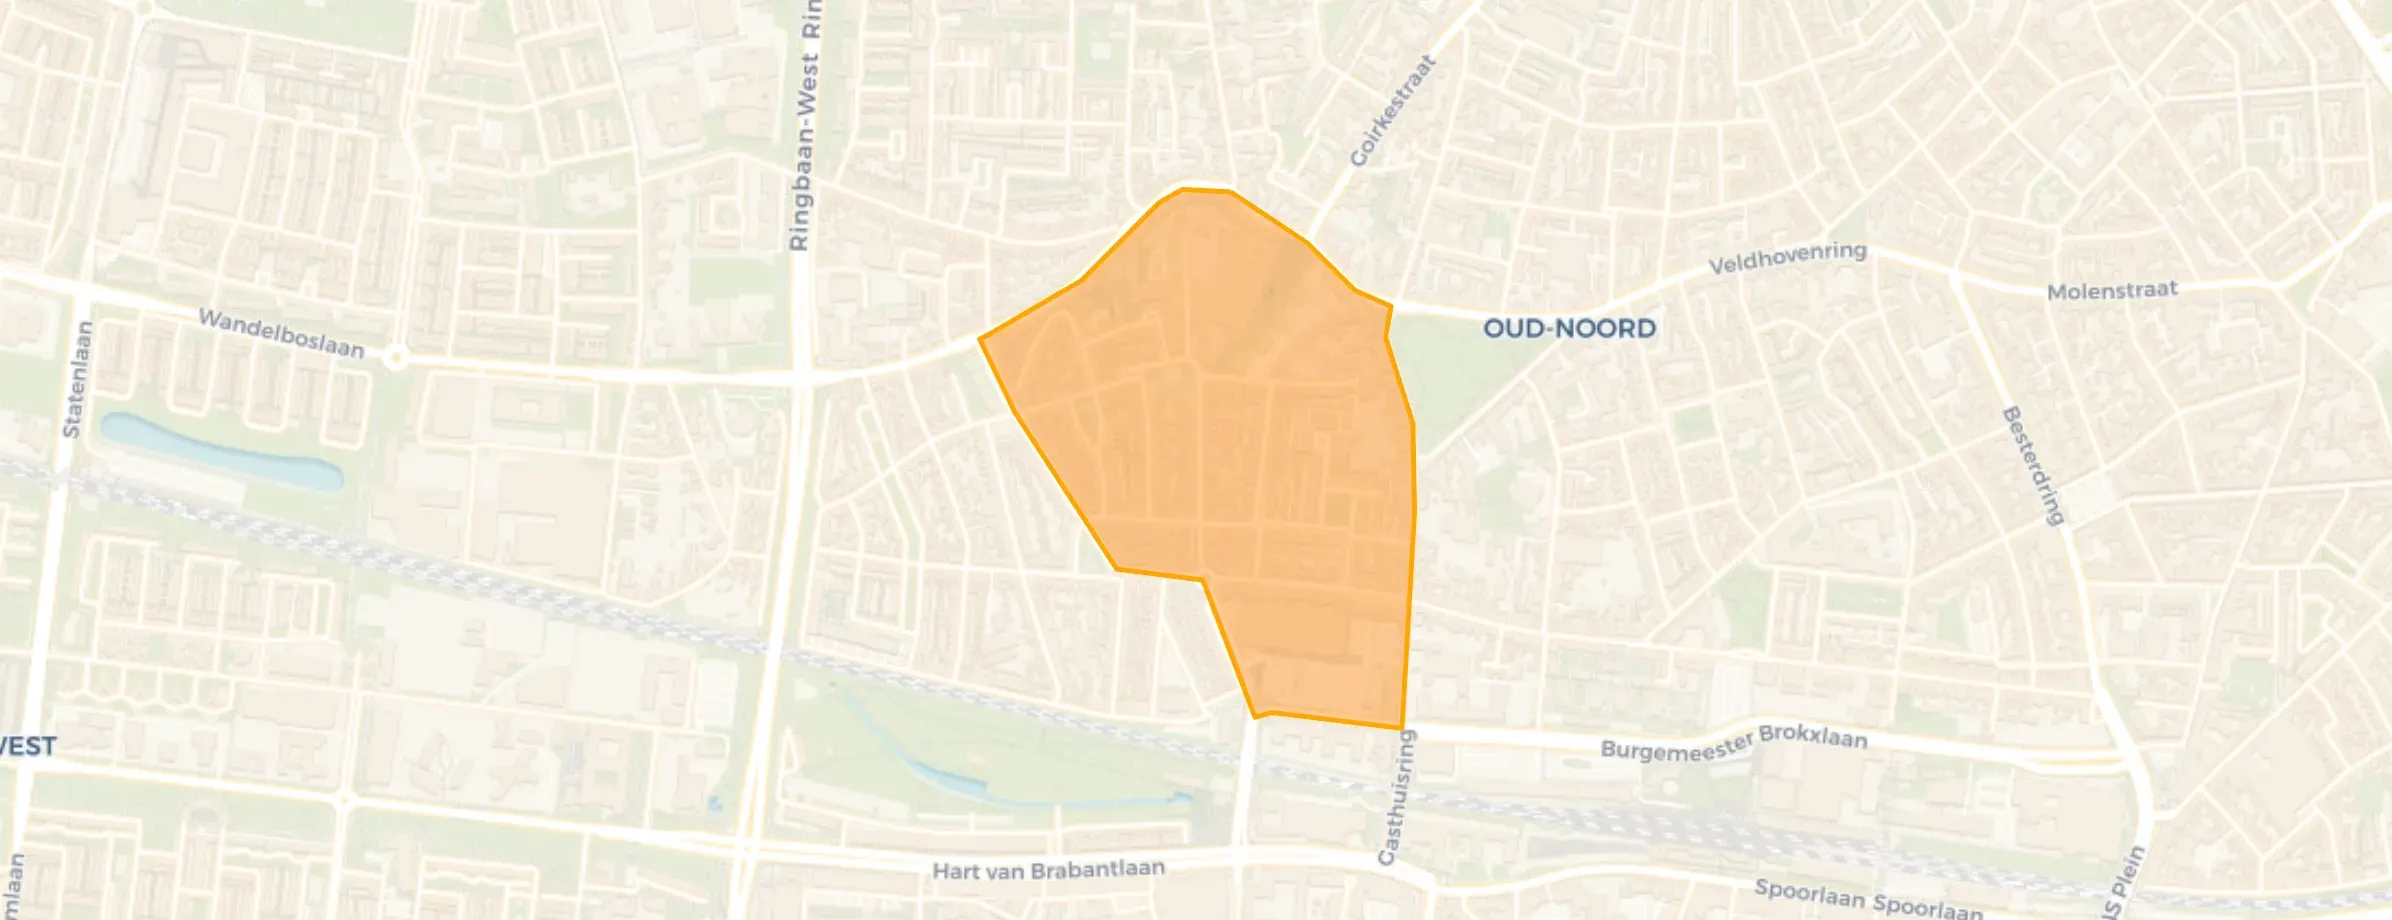
Neighbourhood in Tilburg
Bouwmeestersbuurt Noord is located in the province of Noord-Brabant, in the municipality of Tilburg, in the district Bouwmeester The neighbourhood has a total area of 27 hectares, of which 27 hectares are land and 0 hectares are water. The neighbourhood is coded as BU08552201. The postcode area is 5041DP-5041RS.
Three residents rate the neighbourhood as more than satisfactory with a score of 6.7. They describe it as 'Peaceful living', 'Messy' and 'A diverse neighbourhood'. Aspects such as amenities, accessibility, housing are rated well in this neighbourhood, while greenery and cleanliness score less well.
Bouwmeestersbuurt Noord has 2.105 residents. Of these, 51,1% are men and 48,7% are women. Most residents are 45 to 65 years (26,4%). The other age groups are 26,1% for '25 to 45 years', 24,0% for '65 years or older', 13,5% for '15 to 25 years' and 9,7% for '0 to 15 years'. Of the residents, 53,2% is unmarried, 30,6% is married, 9,0% is divorced and 7,1% is widowed. 1.590 residents originate from the Netherlands, 255 come from Europe and 255 come from countries outside Europe.
There are 1.130 households in Bouwmeestersbuurt Noord. 54,9% of these are single-person households, 26,1% households without children and 19,0% households with children. The average household size is 1,7 persons. The national average is 2,1 persons.
In Bouwmeestersbuurt Noord there are 1.800 income recipients. The average income per income recipient is €36.500, which is €5.700 (14%) lower than the national average of €42.200. Per resident, the average income is €32.200, which is €2.700 (8%) lower than the national average of €34.900. Most residents of Bouwmeestersbuurt Noord are highly educated. 37,8% have a university or higher professional education (HBO/WO), 34,1% have an intermediate education (HAVO, VWO or MBO 2-4) and 28,0% have a lower education (VMBO or MBO 1).
Of the 2.105 residents, around 73% are in paid employment, which amounts to 1.537 people. This is 1% higher than the national average of 72%. The majority of workers are in salaried employment (87%), while 13% are self-employed. In Bouwmeestersbuurt Noord, 26% of residents receive a benefit. The largest group is those receiving a state pension (AOW). 400 people receive this benefit.
In Bouwmeestersbuurt Noord there are 1.111 homes with an average assessed value (WOZ) of €294.000. Of these, around 94% are occupied and 6% unoccupied. Most homes are owner-occupied. This amounts to 44% rental homes and 56% owner-occupied homes. Of the homes, 55% privately owned, 31% owned by housing associations and 14% owned by other landlords. The most common construction periods in Bouwmeestersbuurt Noord are 1980-1990 (28%) and 1925-1950 (25%).
There are currently 22 homes for sale in Bouwmeestersbuurt Noord. The most recently listed home is Kwaadeindstraat 69 by Martijn Makelaardij op Funda. Over the past year, 91 homes were sold in Bouwmeestersbuurt Noord. On average, a home was sold within 38 days.
The average asking price for a home for sale in Bouwmeestersbuurt Noord over the past year was €442.948. This is 51% higher than the average assessed value (WOZ) of €294.000. The average asking price per m² of plot is €4.219.
There is 1 homes for rent in Bouwmeestersbuurt Noord. The most recent home is Berlagehof 35, offered by www.woninginzicht.nl. Over the past year, 42 homes were let in Bouwmeestersbuurt Noord. On average, a listing was let within 14 days.
No recent rental data available for Bouwmeestersbuurt Noord.
In Bouwmeestersbuurt Noord there are 700 addresses with a registered energy label. The most common labels are C (21%), B (20%) and A (17%). On average, an address in Bouwmeestersbuurt Noord uses 2.190 kWh of electricity per year. This is 14% below the national average of 2.550 kWh. Natural gas consumption, at 860 m³ per year, is 8% above the national average of 800 m³.
Moved from a village to the city..Nice surroundings..peaceful living..shops within walking distance…the manager is reachable…there is also an enclosed playground for the youth, secured by a gate.
Auto-translated to English by AIMany elderly people. Many foreign people who are younger. Many people who leave everything lying around. There are enough opportunities to dispose of it properly. There is greenery in the neighbourhood. Dare to address each other about their behaviour. It is possible to report it to the neighbourhood supervisor.
Auto-translated to English by AIA neighbourhood with a diverse population. You'll find many students and student houses here. With the homeless shelter, a coffee shop and a park with a dark past, there's always plenty to see in the neighbourhood.
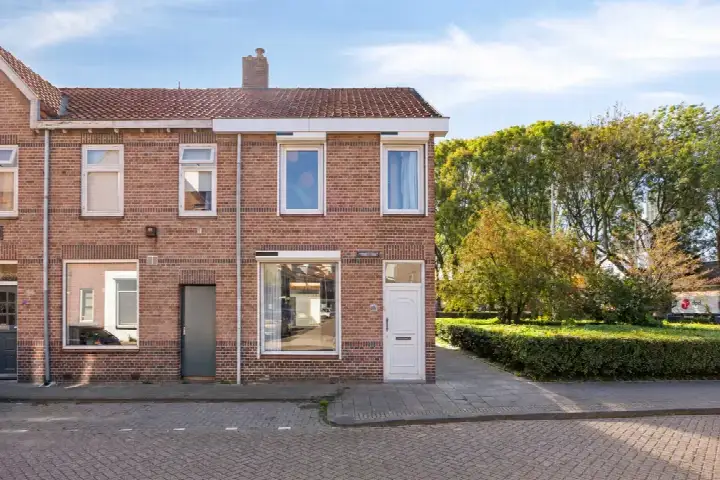
Auto-translated to English by AIThe housing stock is predominantly pre-war — 53% of the homes date from before 1945. In addition, the most common type is terraced houses (47%).
Over the past year a home for sale in Bouwmeestersbuurt Noord was listed for an average of €461,669 (€3,822 per m²).
Residents give Bouwmeestersbuurt Noord a 6.7 out of 10 based on 3 reviews. The strongest score is for amenities (8.0), the weakest for cleanliness (5.3).
Buurt Bouwmeestersbuurt Noord has 2,105 residents. Notably, 55% of the households are single-person households.
From Bouwmeestersbuurt Noord you can on average reach a supermarket at 0.4 km, a GP at 0.9 km, a railway station at 1.0 km, a primary school at 0.6 km (as the crow flies, source: CBS).
Right now you will find 25 homes for sale and 11 homes for rent in Bouwmeestersbuurt Noord.