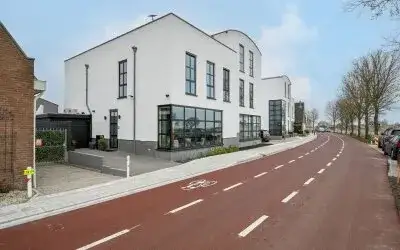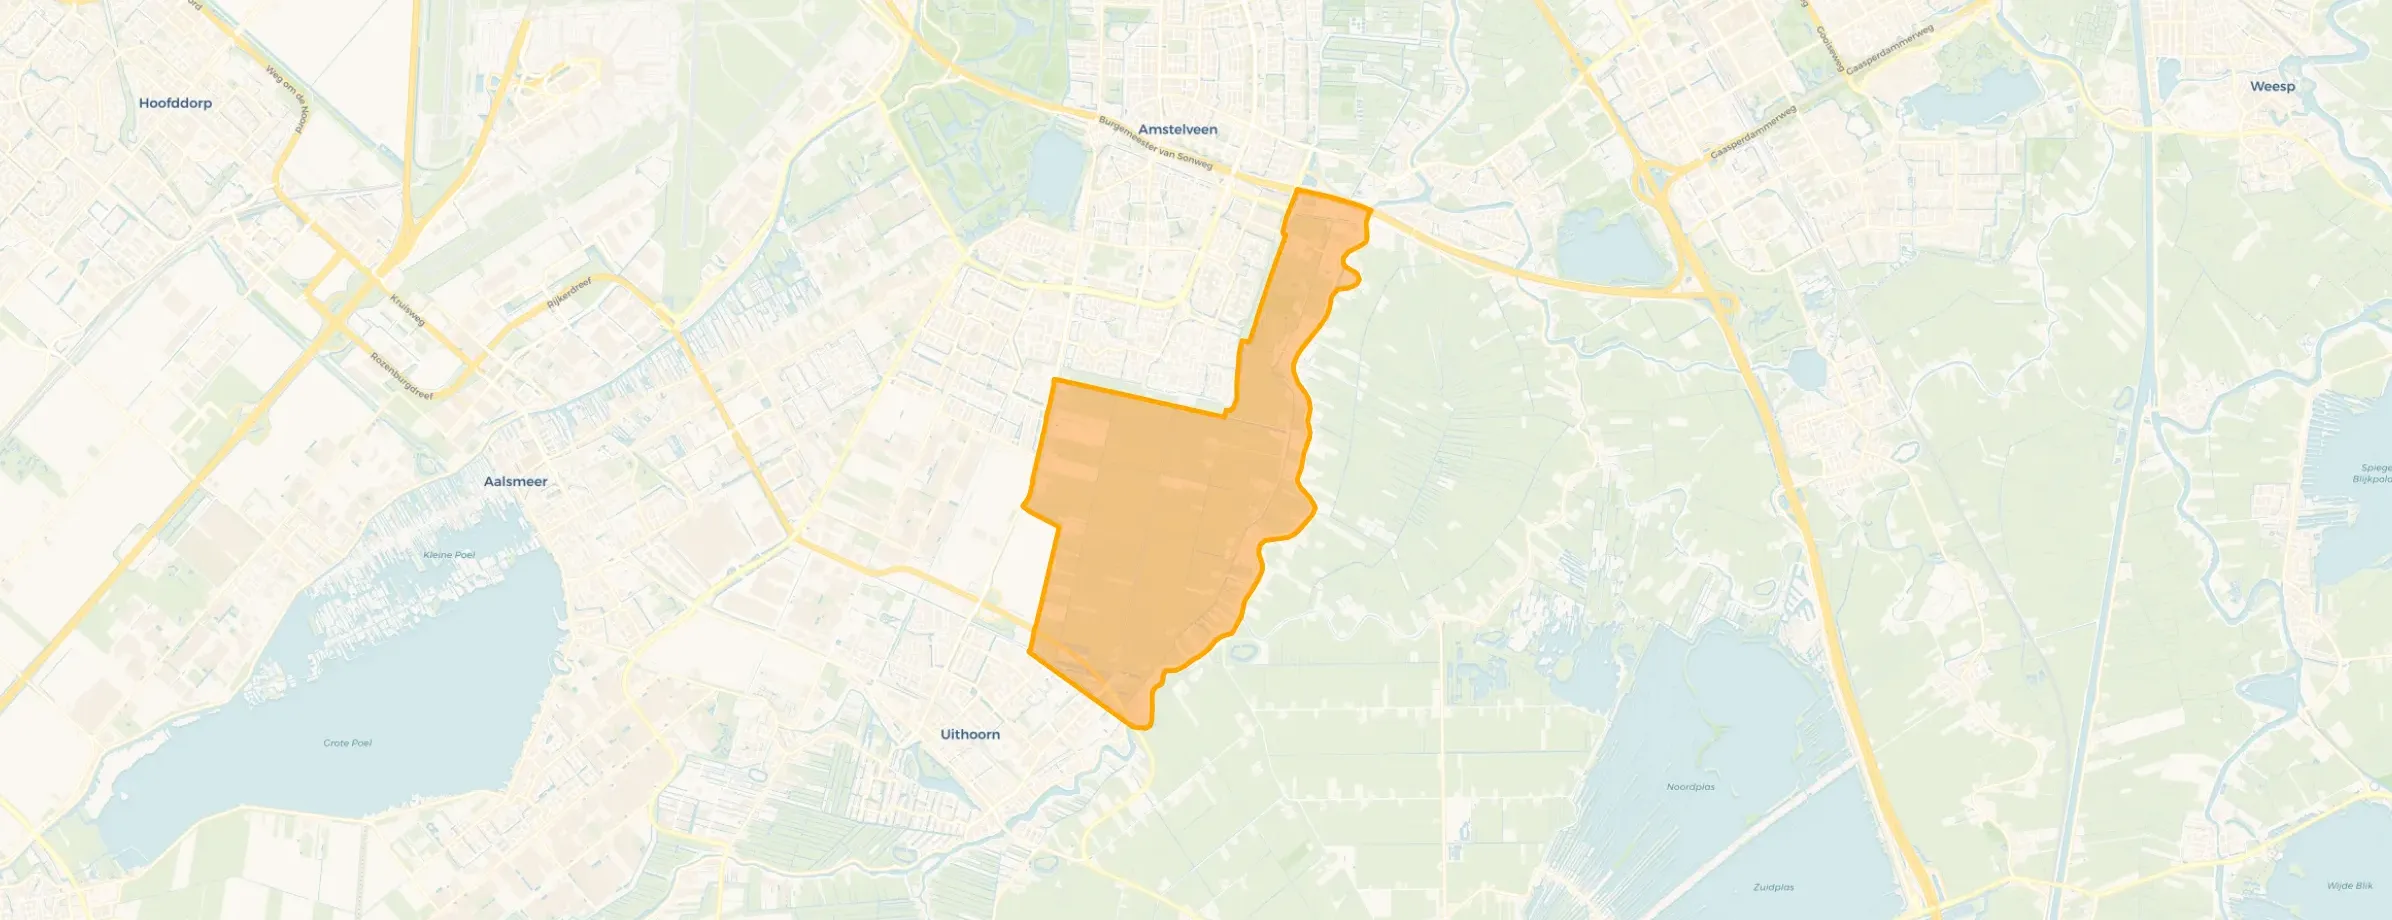
Neighbourhood in Amstelveen
Nes aan de Amstel is located in the province of Noord-Holland, in the municipality of Amstelveen, in the district Buitengebied Zuid The neighbourhood has a total area of 1.039 hectares, of which 984 hectares are land and 55 hectares are water. The neighbourhood is coded as BU03621301. The postcode area is 1184VD-1189WP.
One resident rates the neighbourhood as more than satisfactory with a score of 6.8. The resident describes this neighbourhood as 'A quiet, beautiful neighbourhood that is only really accessible by car.'. Based on a limited number of reviews, no clear trends are visible yet in this neighbourhood.
Nes aan de Amstel has 1.005 residents. Of these, 50,2% are men and 49,3% are women. Most residents are 45 to 65 years (33,3%). The other age groups are 23,9% for '65 years or older', 15,4% for '25 to 45 years', 14,4% for '15 to 25 years' and 12,4% for '0 to 15 years'. Of the residents, 48,8% is unmarried, 39,8% is married, 7,0% is divorced and 5,0% is widowed. 765 residents originate from the Netherlands, 85 come from Europe and 155 come from countries outside Europe.
There are 420 households in Nes aan de Amstel. 31,0% of these are single-person households, 27,4% households without children and 41,7% households with children. The average household size is 2,3 persons. The national average is 2,1 persons.
In Nes aan de Amstel there are 800 income recipients. The average income per income recipient is €52.500, which is €10.300 (24%) higher than the national average of €42.200. Per resident, the average income is €43.900, which is €9.000 (26%) higher than the national average of €34.900. Most residents of Nes aan de Amstel are highly educated. 44,2% have a university or higher professional education (HBO/WO), 39,0% have an intermediate education (HAVO, VWO or MBO 2-4) and 16,9% have a lower education (VMBO or MBO 1).
Of the 1.005 residents, around 73% are in paid employment, which amounts to 734 people. This is 1% higher than the national average of 72%. The majority of workers are in salaried employment (65%), while 35% are self-employed. In Nes aan de Amstel, 28% of residents receive a benefit. The largest group is those receiving a state pension (AOW). 220 people receive this benefit.
In Nes aan de Amstel there are 571 homes. Of these, around 67% are occupied and 33% unoccupied. In Nes aan de Amstel there are roughly as many rental as owner-occupied homes. This amounts to 53% rental homes and 47% owner-occupied homes. Of the homes, 47% privately owned, 16% owned by housing associations and 37% owned by other landlords. The most common construction periods in Nes aan de Amstel are 1970-1980 (48%) and 1900-1925 (10%).
There are currently 7 homes for sale in Nes aan de Amstel. The most recently listed home is Amsteldijk Zuid 195 by Carla van den Brink B.V.. Over the past year, 15 homes were sold in Nes aan de Amstel. On average, a home was sold within 98 days.
There are 2 homes for rent in Nes aan de Amstel. The most recent home is Amsteldijk Zuid 79B, offered by Broersma Wonen. Over the past year, 40 homes were let in Nes aan de Amstel. On average, a listing was let within 36 days.
The average rent for a rental home in Nes aan de Amstel over the past year was €3.225 per month. Per m² of plot area that is €12 per month.
In Nes aan de Amstel there are 254 addresses with a registered energy label. The most common labels are A (37%), A+ (14%) and C (13%). On average, an address in Nes aan de Amstel uses 3.270 kWh of electricity per year. This is 28% above the national average of 2.550 kWh. Natural gas consumption, at 1.200 m³ per year, is 50% above the national average of 800 m³.
Nes aan de Amstel is a cosy neighbourhood with some people in it. It's a nice community with mostly elderly people, but most people take you reasonably seriously. The only problem here is that there are very few amenities. There is one restaurant with unpleasant owners, so it's almost never visited. The biggest problem is that it's not accessible. There is public transport, officially once an hour. In practice, it runs once every two hours or once every three hours. Actually, you never know, so the public transport here is very unreliable, the little bus. The public transport also just leaves you behind if the bus, which can hold a maximum of five people, is full. By bike, it's not possible yet from Amsterdam. With a normal bike, you'd be on the road for over an hour, and since it's on the Amstel, the wind is stronger. So accessibility is really only by car.
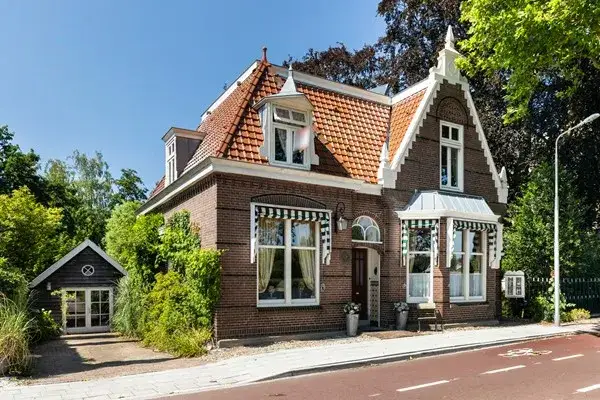
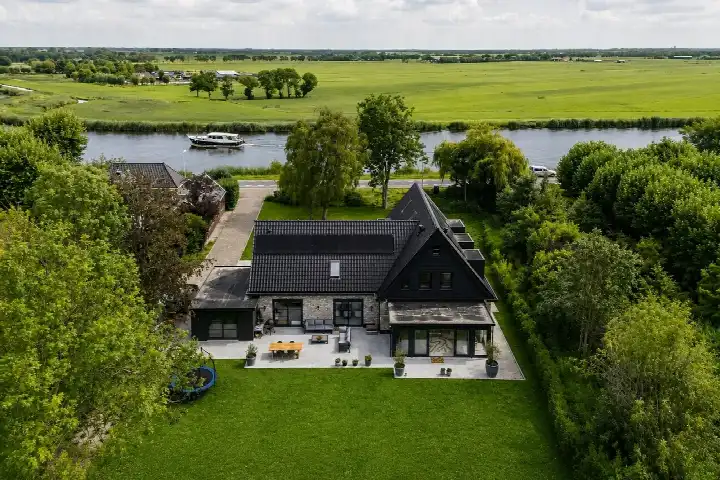
Auto-translated to English by AIThe most common type is detached houses (51%).
Over the past year a home for sale in Nes aan de Amstel was listed for an average of €1,564,667 (€8,263 per m²). That is 196% above the Dutch national average.
A rental home in Nes aan de Amstel cost an average of €3,739 per month (€15 per m²). That is 73% above the national average.
Buurt Nes aan de Amstel has 1,005 residents. The largest age group is 45 to 65 years (33%). Many families: 42% of the households have children.
The housing supply in Nes aan de Amstel is remarkably efficient: 78% has an A, A+ or B label. The average natural gas consumption per household is 1,200 m³ per year.
From Nes aan de Amstel you can on average reach a supermarket at 4.0 km, a GP at 4.5 km, a railway station at 9.1 km, a primary school at 4.3 km (as the crow flies, source: CBS).