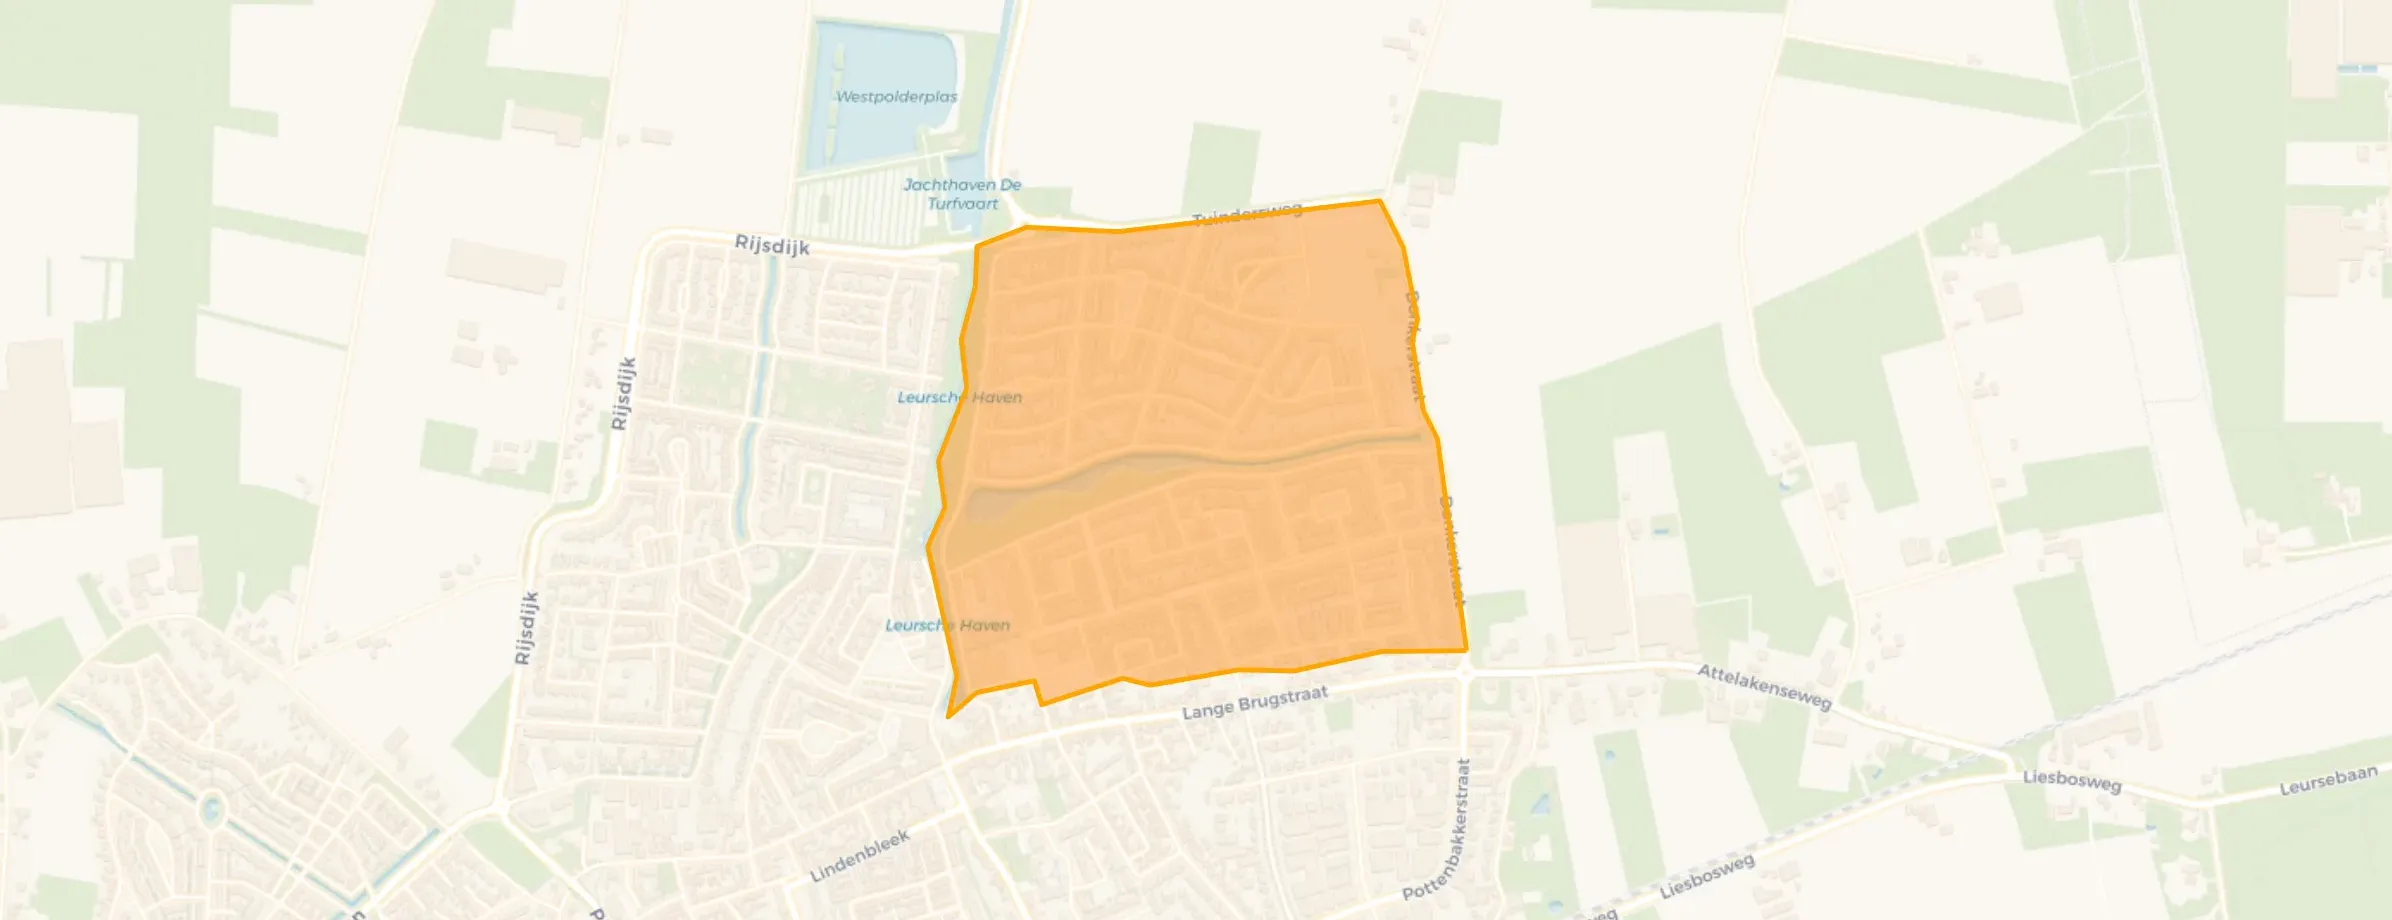
Schoenmakershoek is located in the province of Noord-Brabant, in the municipality of Etten-Leur, in the district Noord woongebied. The neighbourhood has a total area of 65 hectares, of which 63 hectares are land and 2 hectares are water. The neighbourhood is coded as BU07771015. The postcode area is 4871KC-4871NP.
One resident rates the neighbourhood as very good with a score of 8.1. The resident describes this neighbourhood as 'Coming of age neighbourhood'. Based on a limited number of reviews, no clear trends are visible yet in this neighbourhood.
Schoenmakershoek has 4.120 residents. Of these, 49,5% are men and 50,6% are women. Most residents are 25 to 45 years (26,5%). The other age groups are 25,1% for '45 to 65 years', 23,2% for '0 to 15 years', 14,1% for '65 years or older' and 11,3% for '15 to 25 years'. Of the residents, 52,2% is unmarried, 37,3% is married, 7,0% is divorced and 3,5% is widowed. 3.285 residents originate from the Netherlands, 340 come from Europe and 495 come from countries outside Europe.
There are 1.575 households in Schoenmakershoek. 25,7% of these are single-person households, 24,1% households without children and 50,2% households with children. The average household size is 2,6 persons. The national average is 2,1 persons.
In Schoenmakershoek there are 3.100 income recipients. The average income per income recipient is €48.000, which is €5.800 (14%) higher than the national average of €42.200. Per resident, the average income is €36.400, which is €1.500 (4%) higher than the national average of €34.900. Most residents of Schoenmakershoek are highly educated. 39,0% have a university or higher professional education (HBO/WO), 37,3% have an intermediate education (HAVO, VWO or MBO 2-4) and 23,7% have a lower education (VMBO or MBO 1).
Of the 4.120 residents, around 80% are in paid employment, which amounts to 3.296 people. This is 8% higher than the national average of 72%. The majority of workers are in salaried employment (87%), while 13% are self-employed. In Schoenmakershoek, 18% of residents receive a benefit. The largest group is those receiving a state pension (AOW). 530 people receive this benefit.
In Schoenmakershoek there are 1.560 homes with an average assessed value (WOZ) of €462.000. Of these, around 99% are occupied and 1% unoccupied. Most homes are owner-occupied. This amounts to 37% rental homes and 63% owner-occupied homes. Of the homes, 64% privately owned, 33% owned by housing associations and 3% owned by other landlords. The most common construction periods in Schoenmakershoek are 2000-2010 (56%) and 2010-2020 (44%).
There are currently 6 homes for sale in Schoenmakershoek. The most recently listed home is Schutsgildelaan 12 by Agnes Tomesen Makelaardij | Qualis op Funda. Over the past year, 38 homes were sold in Schoenmakershoek. On average, a home was sold within 34 days.
The average asking price for a home for sale in Schoenmakershoek over the past year was €626.099. This is 36% higher than the average assessed value (WOZ) of €462.000. The average asking price per m² of floor area is €4.121.
There are 3 homes for rent in Schoenmakershoek. The most recent home is Muldersweg 20, offered by www.klikvoorwonen.nl. Over the past year, 3 homes were let in Schoenmakershoek. On average, a listing was let within 26 days.
The average rent for a rental home in Schoenmakershoek over the past year was €1.483 per month. Per m² of floor area that is €12 per month.
In Schoenmakershoek there are 1.084 addresses with a registered energy label. The most common labels are A (50%), A++ (25%) and A+++ (18%). On average, an address in Schoenmakershoek uses 4.430 kWh of electricity per year. This is 74% above the national average of 2.550 kWh. With an annual consumption of 50 m³ per address, natural gas consumption is 94% below the national average of 800 m³.
We moved here when it was a new neighbourhood. It started with lots of children playing, who have now all grown up and prefer to play with other things. There are loads of amenities and you don't have to leave quickly to do something fun. Although after a few years you've seen it all. The youth of today do cause trouble, you can easily be spoken to or threatened if you're alone somewhere at the wrong time. So I don't go out for a walk in the evening at weekends. The nature here isn't always well maintained, except for individual plots of land that people take care of themselves. However, there are several beautiful parks and lots of trees and greenery throughout the neighbourhoods. There is a neighbourhood app and community and we can fight for our rights and will quickly know if something is going on in the area. We have a good bus system and a train station that often run late, but if you take that into account, there's no problem. We have a shopping centre and cinema and several schools. I have many good memories in the city of shopping and gathering. Because of the pubs and the lack of clubs, there's a very homey atmosphere and the kids all go to Breda to go out. Only with the number of young people who don't clean up after themselves, there can be some litter. Especially after events, parties or holidays, there is a lot of rubbish on the streets. Especially after New Year, it takes at least two months for all the mess to be cleared from the streets. And in the spots with benches that are secluded for peace and quiet, there is a lot of rubbish in the water and in nature, after people have been there to do things. They have also often found nitrous oxide canisters just outside and just inside the neighbourhood.
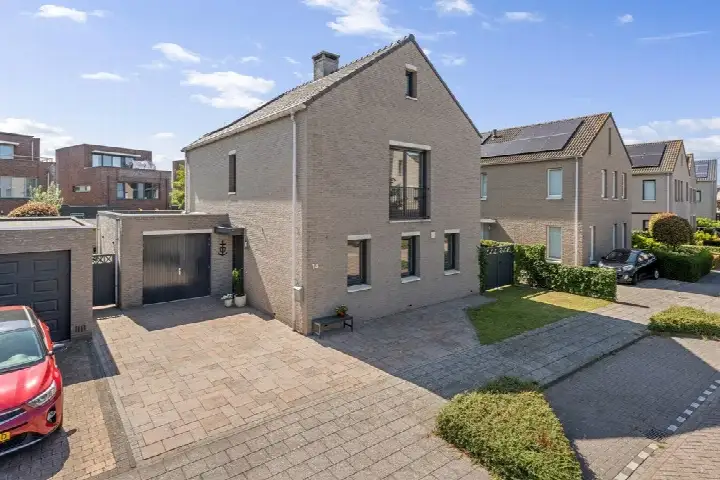
Auto-translated to English by AIThe housing stock is relatively young — 100% dates from after 1990. In addition, the most common type is terraced houses (48%).
Over the past year a home for sale in Schoenmakershoek was listed for an average of €626,099 (€4,121 per m²). That is 21% above the Dutch national average. Last quarter prices fell by 6%.
Buurt Schoenmakershoek has 4,120 residents. Many families: 50% of the households have children.
The housing supply in Schoenmakershoek is remarkably efficient: 100% has an A, A+ or B label. The average natural gas consumption per household is 50 m³ per year.
From Schoenmakershoek you can on average reach a supermarket at 1.1 km, a GP at 1.9 km, a railway station at 3.3 km, a primary school at 0.8 km (as the crow flies, source: CBS).