Neighbourhood in Rotterdam
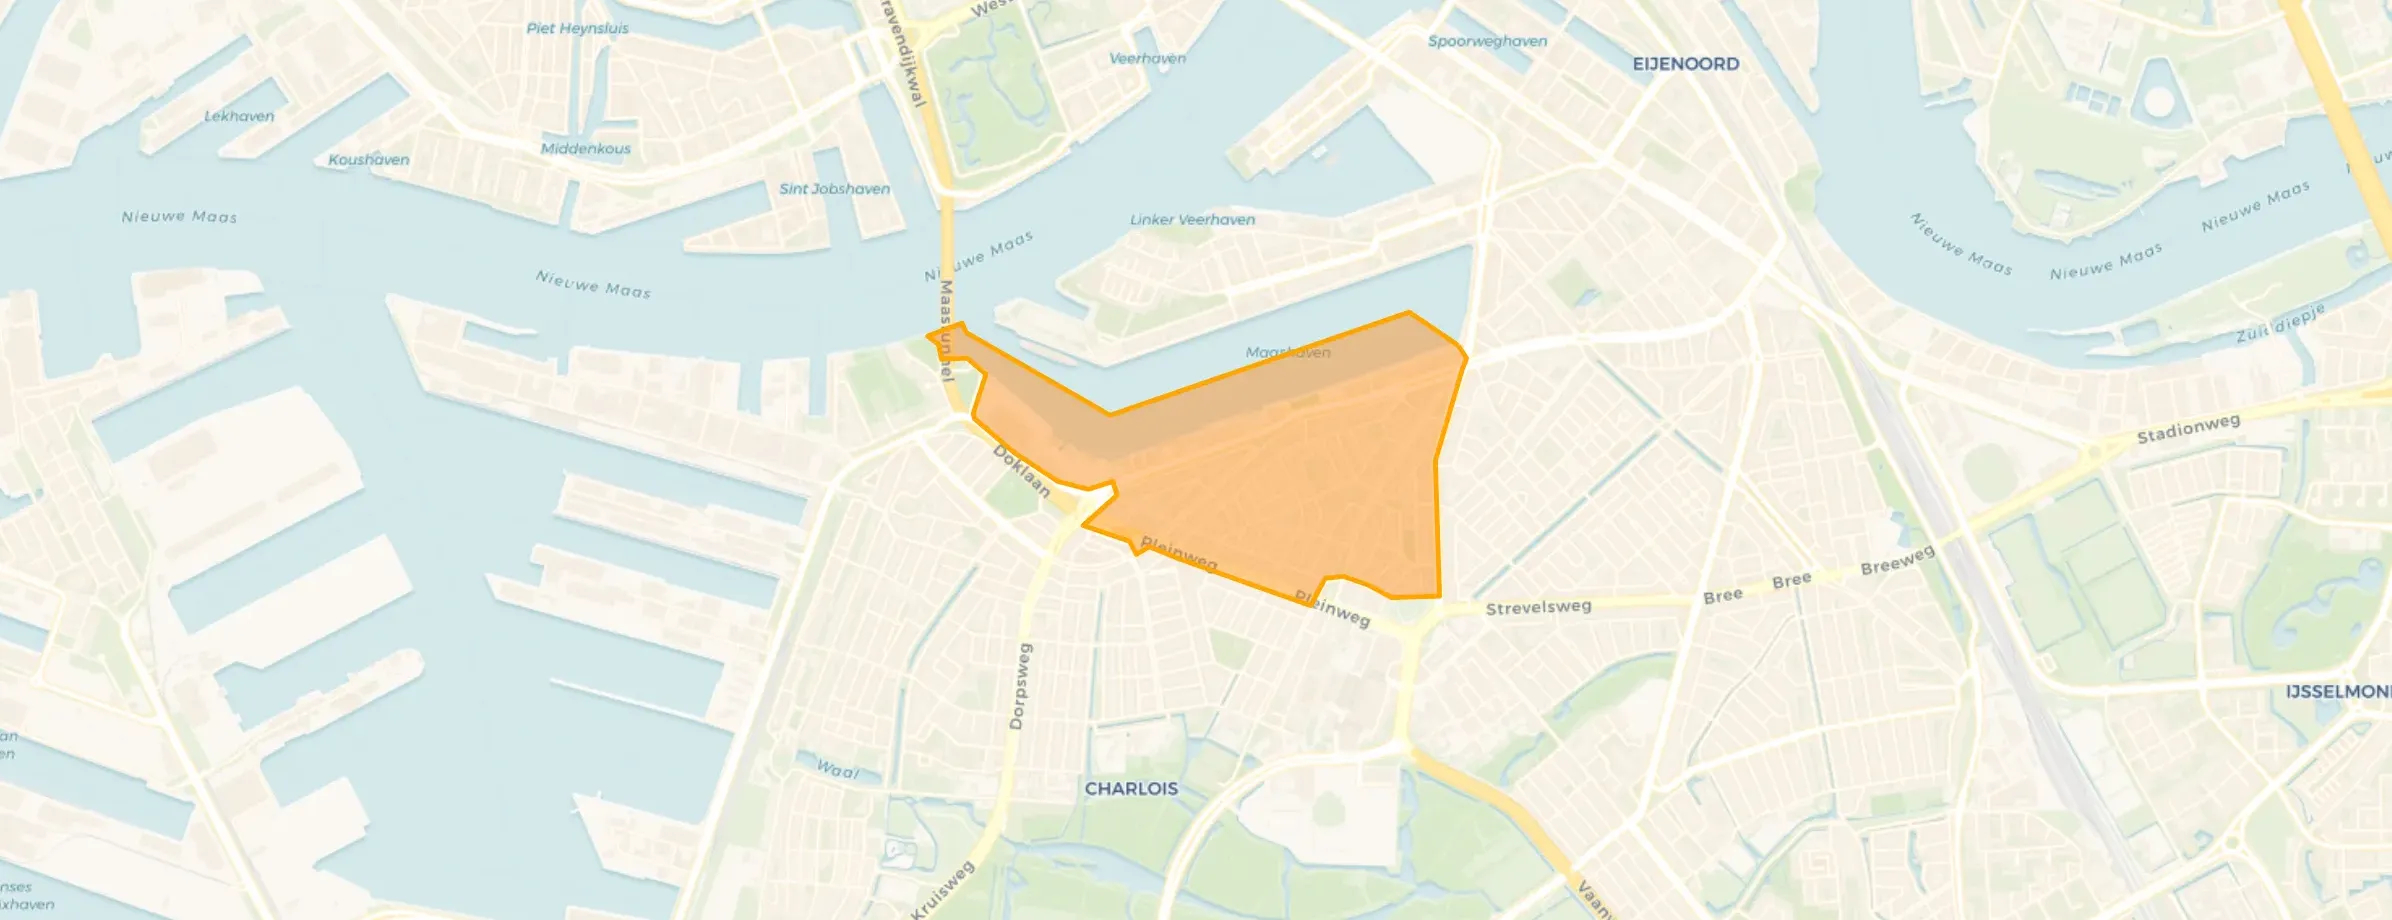
Tarwewijk is located in the province of Zuid-Holland, in the municipality of Rotterdam, in the district Charlois The neighbourhood has a total area of 114 hectares, of which 85 hectares are land and 30 hectares are water. The neighbourhood is coded as BU05991571. The postcode area is 3081AA-3081ZW.
Five residents rate the neighbourhood as more than satisfactory with a score of 6.8. They describe it as 'Top location and affordable.', 'Good, but it could always be better' and 'a nice spot with a diversity of people'. Residents experience big differences in this neighbourhood: accessibility, amenities, safety receive high ratings, while greenery and cleanliness are mentioned as weak points.
Tarwewijk has 12.245 residents. Of these, 51,3% are men and 48,7% are women. Most residents are 25 to 45 years (38,2%). The other age groups are 22,1% for '45 to 65 years', 15,8% for '0 to 15 years', 15,6% for '15 to 25 years' and 8,3% for '65 years or older'. Of the residents, 68,2% is unmarried, 20,9% is married, 9,0% is divorced and 1,8% is widowed. 2.225 residents originate from the Netherlands, 3.025 come from Europe and 6.995 come from countries outside Europe.
There are 6.320 households in Tarwewijk. 51,9% of these are single-person households, 19,0% households without children and 29,1% households with children. The average household size is 1,9 persons. The national average is 2,1 persons.
In Tarwewijk there are 9.400 income recipients. The average income per income recipient is €31.300, which is €10.900 (26%) lower than the national average of €42.200. Per resident, the average income is €24.800, which is €10.100 (29%) lower than the national average of €34.900. Most residents of Tarwewijk are educated to an intermediate level. 44,0% have an intermediate education (HAVO, VWO or MBO 2-4), 38,5% have a lower education (VMBO or MBO 1) and 17,5% have a university or higher professional education (HBO/WO).
Of the 12.245 residents, around 65% are in paid employment, which amounts to 7.959 people. This is 7% lower than the national average of 72%. The majority of workers are in salaried employment (80%), while 20% are self-employed. In Tarwewijk, 19% of residents receive a benefit. The largest group is those receiving a state pension (AOW). 850 people receive this benefit.
In Tarwewijk there are 5.833 homes with an average assessed value (WOZ) of €223.000. Of these, around 93% are occupied and 7% unoccupied. Most homes are rental properties. This amounts to 75% rental homes and 25% owner-occupied homes. Of the homes, 25% privately owned, 33% owned by housing associations and 41% owned by other landlords. The most common construction periods in Tarwewijk are 1925-1950 (70%) and 1950-1970 (9%).
There are currently 79 homes for sale in Tarwewijk. The most recently listed home is Bonaventurastraat 69A02 by @Work Makelaardij. Over the past year, 468 homes were sold in Tarwewijk. On average, a home was sold within 68 days.
The average asking price for a home for sale in Tarwewijk over the past year was €274.303. This is 23% higher than the average assessed value (WOZ) of €223.000. The average asking price per m² of plot is €3.657.
There are 10 homes for rent in Tarwewijk. The most recent home is Katendrechtse Lagedijk 3081Z, offered by Rent an Apartment. Over the past year, 228 homes were let in Tarwewijk. On average, a listing was let within 19 days.
The average rent for a rental home in Tarwewijk over the past year was €1.422 per month. Per m² of plot area that is €18 per month.
In Tarwewijk there are 4.493 addresses with a registered energy label. The most common labels are A (29%), C (21%) and B (17%). On average, an address in Tarwewijk uses 2.030 kWh of electricity per year. This is 20% below the national average of 2.550 kWh. With an annual consumption of 760 m³ per address, natural gas consumption is 5% below the national average of 800 m³.
The neighbourhood is improving more and more each year. Thanks to the rent law, there are fewer slumlords and more and more families. It sometimes still has a bad reputation, but that is undeserved except for a few streets. The location is fantastic, metro, Zuidplein, city centre a quarter of an hour by bike. Zuiderpark is also around the corner and soon the Nelson Mandela park.
Auto-translated to English by AIGood, quiet, but the municipality could pay a bit more attention, like containers with an awful lot of mess. Green areas could certainly be better, and clean up the containers.
Auto-translated to English by AIyou can do all sorts of things there, shop and walk your dog. it can be busy at night but during the day it's usually quiet. i'm happy to live here. pollution is quite a problem, especially around overflowing bins where seagulls get at them. it would be nice if the council took more account of that.
Auto-translated to English by AIIn terms of hygiene and education, it could be a lot better.
Auto-translated to English by AIDe Tarwewijk is a nice neighbourhood where people from all backgrounds live together. As a woman, I feel reasonably safe there and I love trying restaurants with food from different countries. The downside is the dirt. There is a lot of litter and bins are often overflowing.
Auto-translated to English by AIThe housing stock is predominantly pre-war — 77% of the homes date from before 1945. In addition, the most common type is flats (89%).
Over the past year a home for sale in Tarwewijk was listed for an average of €270,670 (€3,939 per m²). That is 49% below the Dutch national average. Last quarter prices fell by 6%.
A rental home in Tarwewijk cost an average of €1,336 per month (€20 per m²). That is 38% below the national average.
Residents give Tarwewijk a 6.8 out of 10 based on 5 reviews. Especially amenities (8.2) scores well; cleanliness (4.8) receives the lowest rating.
Buurt Tarwewijk has 12,245 residents. The largest age group is 25 to 45 years (38%). Notably, 52% of the households are single-person households.
From Tarwewijk you can on average reach a supermarket at 0.4 km, a GP at 0.6 km, a railway station at 2.8 km, a primary school at 0.4 km (as the crow flies, source: CBS).
Right now you will find 88 homes for sale and 15 homes for rent in Tarwewijk.