Neighbourhood in Utrecht
Tolsteeg en Rotsoord is located in the province of Utrecht, in the municipality of Utrecht, in the district Zuid The neighbourhood has a total area of 39 hectares, of which 39 hectares are land and 1 hectares are water. The neighbourhood is coded as BU03440721. The postcode area is 3523AA-3582AV.
Two residents rate the neighbourhood as good with a score of 7.5. They describe it as 'Spacious and open, rectangular, well-connected, friendly people with character,' and 'living as a student'. Based on a limited number of reviews, no clear trends are visible yet in this neighbourhood.
Tolsteeg en Rotsoord has 4.220 residents. Of these, 45,6% are men and 54,5% are women. Most residents are 25 to 45 years (53,7%). The other age groups are 19,7% for '15 to 25 years', 11,5% for '45 to 65 years', 7,7% for '0 to 15 years' and 7,5% for '65 years or older'. Of the residents, 81,2% is unmarried, 13,2% is married, 4,6% is divorced and 1,3% is widowed. 2.590 residents originate from the Netherlands, 570 come from Europe and 1.060 come from countries outside Europe.
There are 2.910 households in Tolsteeg en Rotsoord. 68,4% of these are single-person households, 21,8% households without children and 9,8% households with children. The average household size is 1,4 persons. The national average is 2,1 persons.
In Tolsteeg en Rotsoord there are 3.700 income recipients. The average income per income recipient is €41.100, which is €1.100 (3%) lower than the national average of €42.200. Per resident, the average income is €37.100, which is €2.200 (6%) higher than the national average of €34.900. Most residents of Tolsteeg en Rotsoord are highly educated. 68,5% have a university or higher professional education (HBO/WO), 23,6% have an intermediate education (HAVO, VWO or MBO 2-4) and 7,9% have a lower education (VMBO or MBO 1).
Of the 4.220 residents, around 77% are in paid employment, which amounts to 3.249 people. This is 5% higher than the national average of 72%. The majority of workers are in salaried employment (89%), while 11% are self-employed. In Tolsteeg en Rotsoord, 12% of residents receive a benefit. The largest group is those receiving a state pension (AOW). 260 people receive this benefit.
In Tolsteeg en Rotsoord there are 2.584 homes with an average assessed value (WOZ) of €351.000. Of these, around 96% are occupied and 4% unoccupied. Most homes are rental properties. This amounts to 68% rental homes and 32% owner-occupied homes. Of the homes, 32% privately owned, 30% owned by housing associations, 37% owned by other landlords and 1% of unknown ownership. The most common construction periods in Tolsteeg en Rotsoord are 1950-1970 (70%) and 2010-2020 (26%).
There are currently 9 homes for sale in Tolsteeg en Rotsoord. The most recently listed home is Smaragdplein 188 by WD Makelaars op Funda. Over the past year, 109 homes were sold in Tolsteeg en Rotsoord. On average, a home was sold within 27 days.
The average asking price for a home for sale in Tolsteeg en Rotsoord over the past year was €411.862. This is 17% higher than the average assessed value (WOZ) of €351.000. The average asking price per m² of plot is €5.349.
There are 3 homes for rent in Tolsteeg en Rotsoord. The most recent home is Smaragdplein 74, offered by Hoeks Makelaardij op Pararius. Over the past year, 43 homes were let in Tolsteeg en Rotsoord. On average, a listing was let within 32 days.
The average rent for a rental home in Tolsteeg en Rotsoord over the past year was €2.133 per month. Per m² of plot area that is €4 per month.
In Tolsteeg en Rotsoord there are 2.194 addresses with a registered energy label. The most common labels are A (29%), C (22%) and D (15%). On average, an address in Tolsteeg en Rotsoord uses 1.480 kWh of electricity per year. This is 42% below the national average of 2.550 kWh. With an annual consumption of 510 m³ per address, natural gas consumption is 36% below the national average of 800 m³.
I give nature a 6 compared to the rest of the Netherlands. But for the city of Utrecht, nature is nearby here in Tolsteeg. Beatrixpark is one of the most beautiful parks and Amelisweerd is within cycling distance, which is doable. In itself, you can be in the forest at Driebergen-Zeist via the Vaartse Rijn. That threshold is a bit higher. The amenities of the not-so-cozy/pretty shopping centre are very pleasant. There's everything. That the Lidl is there is very nice, and also the Plus. The people there can sometimes spontaneously joke or talk to you. Furthermore, I appreciate how open Tolsteeg is. Many green strips, a lot of open feeling around the Rietveld flats. The only downside is that that area can sometimes feel a bit rectangular and straight-lined, also the road along the Lidl is somewhat busy and unpleasant. It is certainly not like Oudwijk or Wittevrouwen, but living there with the same floor space is simply reserved for millionaires in 2024. The Rietveld flats also have a charming, interesting appearance for apartment buildings. It's fantastic how well-connected the neighbourhood is. A few buses take you to Utrecht Central in about 5 minutes, on straight roads. You can also easily walk to Vaartse Rijn, from there the Oosterkade and Westerkade begin, which look just as beautiful and cosy as the city centre. Living south of the city centre I find nice. That part is much quieter.
Auto-translated to English by AIthe neighbourhood is not far from the city centre, but is still usually nice and quiet. having the Smaragdplein shopping centre nearby is very handy. Lidl is just a few minutes away, which can save you a lot of money.
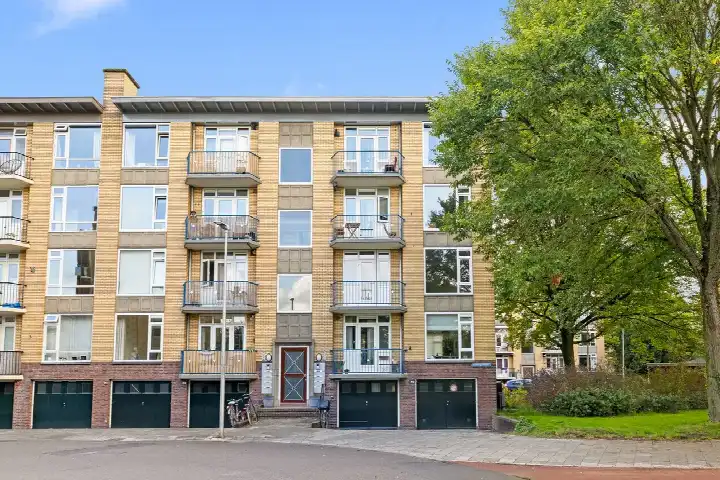
Auto-translated to English by AIThe housing stock is mainly post-war — 97% was built between 1945 and 1990. In addition, the most common type is flats (86%).
Over the past year a home for sale in Tolsteeg en Rotsoord was listed for an average of €410,145 (€5,681 per m²). That is 22% below the Dutch national average.
A rental home in Tolsteeg en Rotsoord cost an average of €2,051 per month (€26 per m²).
Buurt Tolsteeg en Rotsoord has 4,220 residents. The largest age group is 25 to 45 years (54%). Notably, 68% of the households are single-person households.
From Tolsteeg en Rotsoord you can on average reach a supermarket at 0.4 km, a GP at 0.9 km, a railway station at 0.8 km, a primary school at 0.8 km (as the crow flies, source: CBS).
Right now you will find 16 homes for sale and 1 homes for rent in Tolsteeg en Rotsoord.