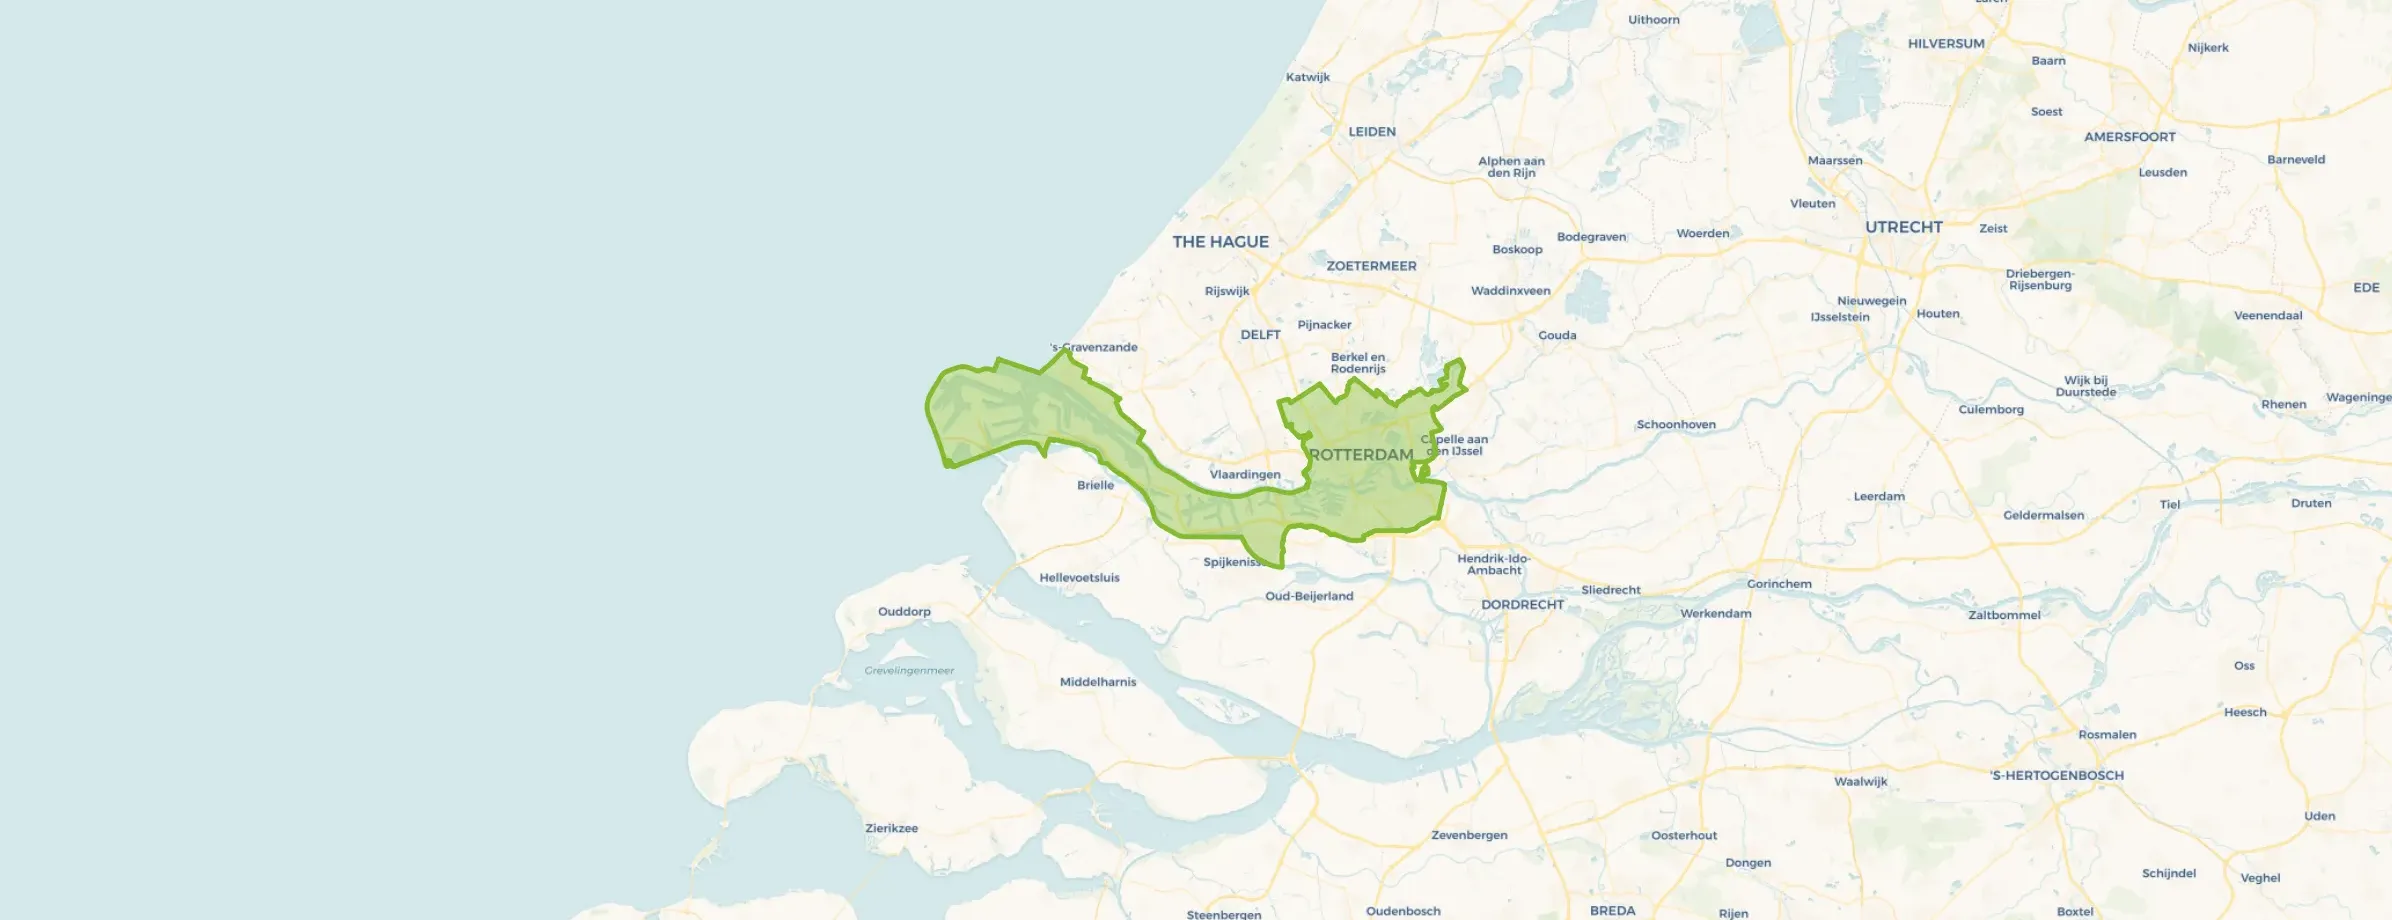
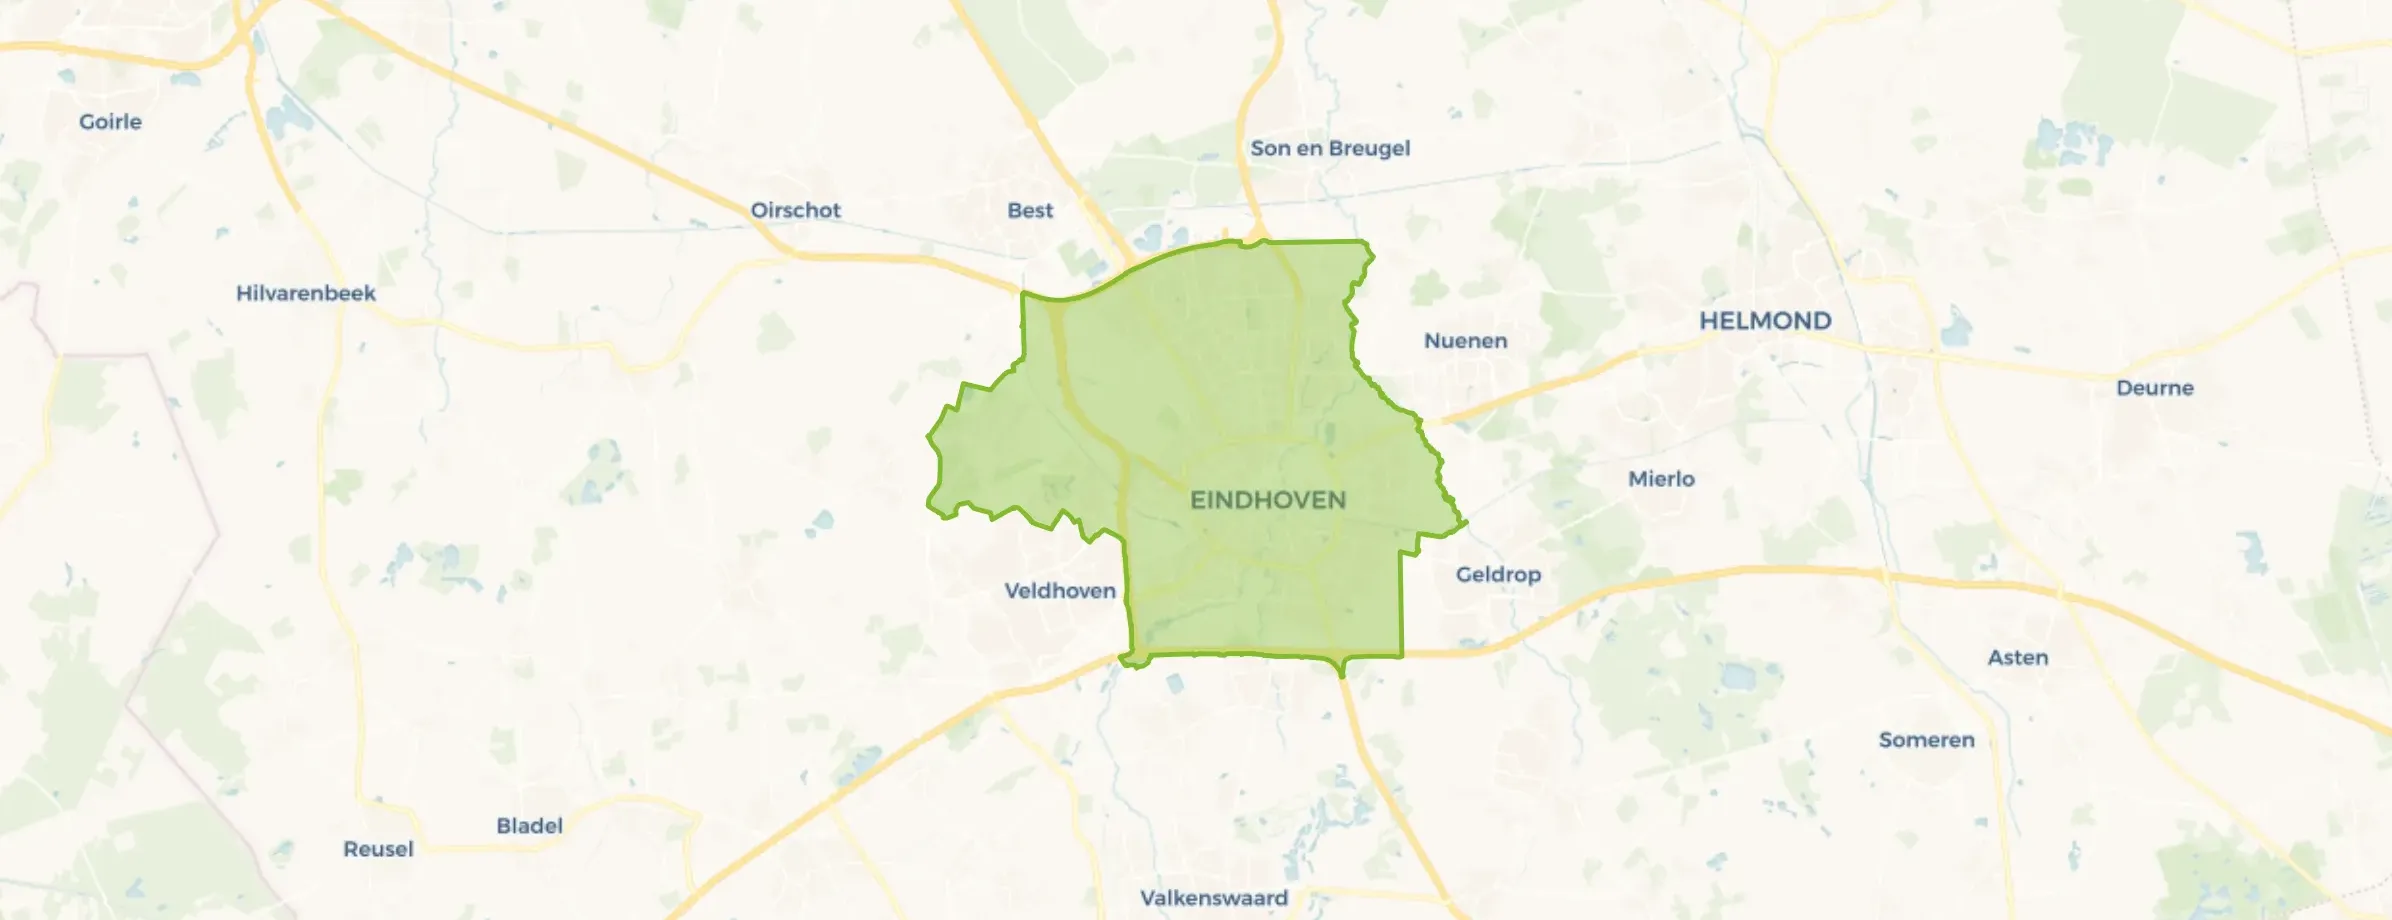
Vogelbuurt-Oost is located in the province of Zuid-Holland, in the municipality of Delft, in the district Tanthof-Oost. The neighbourhood has a total area of 13 hectares, of which 13 hectares are land and 0 hectares are water. The neighbourhood is coded as BU05032304. The postcode area is 2623GA-2623JA.
One resident rates the neighbourhood as very good with a score of 8.9. The resident describes this neighbourhood as 'Top little neighbourhood'. Based on a limited number of reviews, no clear trends are visible yet in this neighbourhood.
Vogelbuurt-Oost has 1.330 residents. Of these, 51,1% are men and 48,9% are women. Most residents are 45 to 65 years (24,8%). The other age groups are 24,8% for '65 years or older', 23,3% for '25 to 45 years', 13,9% for '15 to 25 years' and 12,8% for '0 to 15 years'. Of the residents, 52,3% is unmarried, 35,7% is married, 7,5% is divorced and 5,3% is widowed. 875 residents originate from the Netherlands, 80 come from Europe and 370 come from countries outside Europe.
There are 685 households in Vogelbuurt-Oost. 44,5% of these are single-person households, 28,5% households without children and 27,0% households with children. The average household size is 2,0 persons. The national average is 2,1 persons.
In Vogelbuurt-Oost there are 1.100 income recipients. The average income per income recipient is €35.200, which is €7.000 (17%) lower than the national average of €42.200. Per resident, the average income is €30.100, which is €4.800 (14%) lower than the national average of €34.900. Most residents of Vogelbuurt-Oost are educated to an intermediate level. 40,6% have an intermediate education (HAVO, VWO or MBO 2-4), 30,7% have a university or higher professional education (HBO/WO) and 28,7% have a lower education (VMBO or MBO 1).
Of the 1.330 residents, around 63% are in paid employment, which amounts to 838 people. This is 9% lower than the national average of 72%. The majority of workers are in salaried employment (87%), while 13% are self-employed. In Vogelbuurt-Oost, 32% of residents receive a benefit. The largest group is those receiving a state pension (AOW). 290 people receive this benefit.
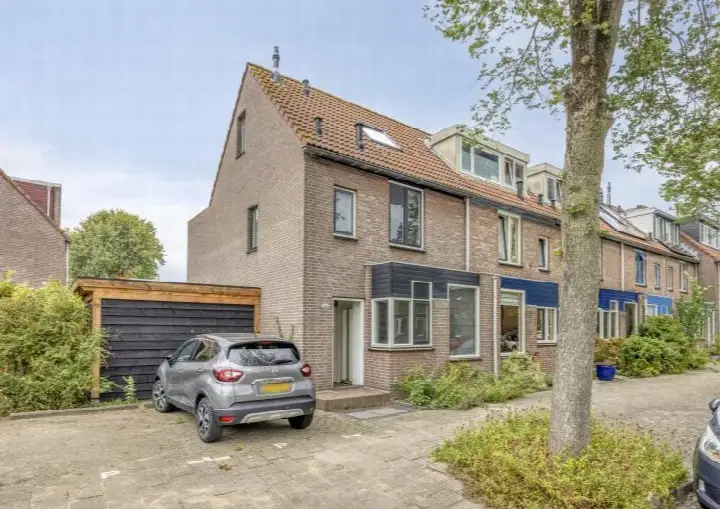
In Vogelbuurt-Oost there are 678 homes with an average assessed value (WOZ) of €321.000. Of these, around 98% are occupied and 2% unoccupied. Most homes are rental properties. This amounts to 63% rental homes and 37% owner-occupied homes. Of the homes, 37% privately owned, 60% owned by housing associations and 3% owned by other landlords. The most common construction periods in Vogelbuurt-Oost are 1980-1990 (57%) and 1970-1980 (43%).
There are currently 3 homes for sale in Vogelbuurt-Oost. The most recently listed home is Valkenlaan 81 by Prinsenstad Makelaardij op Pararius. Over the past year, 8 homes were sold in Vogelbuurt-Oost. On average, a home was sold within 33 days.
The average asking price for a home for sale in Vogelbuurt-Oost over the past year was €459.563. This is 43% higher than the average assessed value (WOZ) of €321.000. The average asking price per m² of floor area is €4.638.
There are currently no homes for rent in Vogelbuurt-Oost. The most recent home is Bosuilstraat 14, offered by www.woonnet-haaglanden.nl. Over the past year, 2 homes were let in Vogelbuurt-Oost. On average, a listing was let within 42 days.
The average rent for a rental home in Vogelbuurt-Oost over the past year was €1.650 per month. Per m² of floor area that is €17 per month.
In Vogelbuurt-Oost there are 492 addresses with a registered energy label. The most common labels are C (34%), B (24%) and D (23%). On average, an address in Vogelbuurt-Oost uses 2.040 kWh of electricity per year. This is 20% below the national average of 2.550 kWh. With an annual consumption of 680 m³ per address, natural gas consumption is 15% below the national average of 800 m³.
We've lived here for 3 years and everyone always says hello to each other, there's an annual neighbourhood party on Neighbours' Day and we get together in playgrounds with the children. Next to our neighbourhood lies the beautiful Abtwoudse park. On its edge is our football club where a family atmosphere prevails. Within walking distance there are schools, a supermarket, a restaurant, a snack bar, a Primera and a hairdresser. Actually everything you need (except a chemist). So a top place!
Auto-translated to English by AI