Vreewijk

Vreewijk, Rotterdam – “Reasonably nice neig...”

Neighbourhood in Rotterdam

7.0
Residents give Vreewijk a good ratingThis score is based on 14 responses
View
Vreewijk has 15,470 residentsMost are 25 to 45 years old
There are 7,794 homes in VreewijkCurrently there are 73 for sale and 17 for rent
Energy label A is the most common in VreewijkBased on registered homes

Vreewijk is located in the province of Zuid-Holland, in the municipality of Rotterdam, in the district Feijenoord The neighbourhood has a total area of 207 hectares, of which 204 hectares are land and 3 hectares are water. The neighbourhood is coded as BU05991080. The postcode area is 3075AA-3083LX.

14 residents rate the neighbourhood as good with a score of 7.0. They describe it as 'Reasonably nice neighbourhood, shame that household waste stays on the street too long', 'Quiet' and 'High crime rate'. Aspects such as greenery, education, amenities are rated well in this neighbourhood, while community and cleanliness score less well.

Residents

Vreewijk has 15.470 residents. Of these, 48,7% are men and 51,3% are women. Most residents are 25 to 45 years (28,7%). The other age groups are 24,8% for '45 to 65 years', 18,6% for '65 years or older', 16,1% for '0 to 15 years' and 11,7% for '15 to 25 years'. Of the residents, 57,9% is unmarried, 26,5% is married, 11,2% is divorced and 4,3% is widowed. 6.745 residents originate from the Netherlands, 1.750 come from Europe and 6.975 come from countries outside Europe.

There are 8.020 households in Vreewijk. 50,0% of these are single-person households, 20,2% households without children and 29,8% households with children. The average household size is 1,9 persons.

In Vreewijk there are 11.900 income recipients. The average income per income recipient is €28.100, which is €7.700 (22%) lower than the national average of €35.800. Per resident, the average income is €23.000, which is €6.200 (21%) lower than the national average of €29.200. Most residents of Vreewijk are educated to an intermediate level. 42,5% have an intermediate education (HAVO, VWO or MBO 2-4), 40,4% have a lower education (VMBO or MBO 1) and 17,1% have a university or higher professional education (HBO/WO).

Of the 15.470 residents, around 53% are in paid employment, which amounts to 8.199 people. This is 12% lower than the national average of 65%. The majority of workers are in salaried employment (86%), while 14% are self-employed. In Vreewijk, 31% of residents receive a benefit. The largest group is those receiving a state pension (AOW). 2.510 people receive this benefit.

Housing

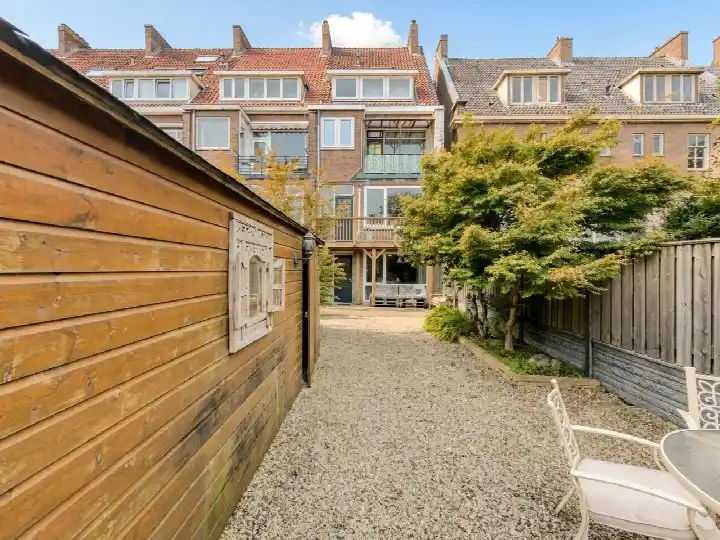
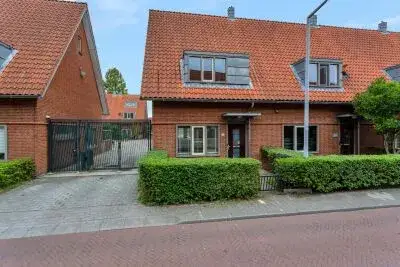
In Vreewijk there are 7.794 homes with an average assessed value (WOZ) of €251.000. Of these, around 95% are occupied and 5% unoccupied. Most homes are rental properties. This amounts to 86% rental homes and 14% owner-occupied homes. Of the homes, 14% privately owned, 72% owned by housing associations and 14% owned by other landlords. The most common construction periods in Vreewijk are 1925-1950 (33%) and 1900-1925 (25%).

Homes for sale

There are currently 65 homes for sale in Vreewijk. The most recently listed home is Hovendaal 65 by vandeVijver Makelaardij op Vastgoed Nederland. Over the past year, 141 homes were sold in Vreewijk. On average, a home was sold within 63 days.

The average asking price for a home for sale in Vreewijk over the past year was €359.812. This is 43% higher than the average assessed value (WOZ) of €251.000. The average asking price per m² of plot is €3.954.

Rental homes

There are 15 homes for rent in Vreewijk. The most recent home is Strevelsweg 26B-01, offered by Fransen Vastgoed op Pararius. Over the past year, 89 homes were let in Vreewijk. On average, a listing was let within 27 days.

The average rent for a rental home in Vreewijk over the past year was €1.354 per month. Per m² of plot area that is €33 per month.

Energy

In Vreewijk there are 8.243 addresses with a registered energy label. The most common labels are C (27%), A (27%) and B (17%). On average, an address in Vreewijk uses 2.060 kWh of electricity per year. This is 27% below the national average of 2.810 kWh. With an annual consumption of 780 m³ per address, natural gas consumption is 39% below the national average of 1.280 m³.

Street names

  • Valkeniersbrug
  • Enkbrug
  • Ploegstraat
  • Manpad
  • Wolvepad
  • Voorde
  • Vonderkriel
  • Clingendaal
  • Stadionviaduct
  • Olmendaal
  • Jagerslaan
  • Donk
  • Dalweg
  • Randweg
  • Meiland
  • Jan van Weeldenstraat
  • Boogjes
  • Zuster Van Dijkplein
  • Blekerslaan
  • Mare
  • Lichtegaard
  • Montessoriweg
  • Vonder
  • Casimirstraat
  • Zuiderparkweg
  • Molenwei
  • Sikkelstraat
  • Weimansweg
  • Leo Lashleylaan
  • Jan Kleingeldstraat
  • Zuideras
  • Oudelandstraat
  • Pleinweg
  • Beukendaal
  • Batterijstraat
  • Rondewei
  • Melkpad
  • Langegeer
  • Dynamostraat
  • Wilgeweerd
  • Berkendaal
  • Weimanspad
  • Zeisstraat
  • Klaphek
  • Dordtsestraatweg
  • Bloemenlaan
  • West-Varkenoordseweg
  • Heggepad
  • Smeetslandsedijk
  • Smalleweer
  • Reineveld
  • Dreef
  • Sparrendaal
  • Jean Jonxisstraat
  • Dennendaal
  • Wijdehof
  • Motorstraat
  • Jan Ligthartstraat
  • Reepstraat
  • Elzendaal
  • Kouterstraat
  • Grift
  • Coen Moulijnweg
  • Molenvliet
  • Albertus de Voogtstraat
  • Bollenland
  • Hazesprong
  • Hendrick Croesinckstraat
  • Rozegaarde
  • Hazenakker
  • Enk
  • Maarland
  • Slag
  • Frits Touwstraat
  • Lentewei
  • Van Malsenstraat
  • Slinge
  • Bredehof
  • Strevelsweg
  • Wellebrug
  • Wildzang
  • Treek
  • Langewelle
  • Veldstraat
  • Lindendaal
  • Valkeniersweg
  • Groenezoombrug
  • Schaarweide
  • Zuiderziekenhuisstraat
  • Vossepad
  • Kortewelle
  • Korte Kromhout
  • Bree
  • Breeplein
  • Achterdonk
  • Blokland
  • Eikendaal
  • Zuidplein Hoog
  • Vorkstraat
  • Brinkpoort
  • Sandelingplein
  • Kastanjedaal
  • Cor Ditewegstraat
  • Meiendaal
  • Dordtselaan
  • Eiberpad
  • Spinozaweg
  • Welleplein
  • Weipad
  • Lede
  • Schoepstraat
  • Pinksterweide
  • Paasweide
  • Disselstraat
  • Bongert
  • Tiengeburen
  • Tandwielstraat
  • Colosseumweg
  • Breeweg
  • Hogehof
  • Cilinderstraat
  • Egstraat
  • Krielerf
  • Vaanweg
  • Struweel
  • Zonnehof
  • Groene Hilledijk
  • Lange Hilleweg
  • Vaarzeveld
  • Spastraat
  • Iependaal
  • Reigerpad
  • Zaailand
  • Hovendaal
  • Marebrug
  • Kortedreef
  • Wed
  • Geitenkamp
  • Geerbrug
  • Groenezoom
  • Voordonk
  • Frankendaal
  • Verlengde Motorstraat
  • Vinkenbaan
  • Schovenhoek
  • Weipoort
  • Wildbaan
  • Brink
  • Zuiderparkpromenade-Oost

Amenities

GP
0,7 km
Pharmacy
0,8 km
Hospital
1,6 km
Supermarket
0,7 km
Railway station
2,4 km
Day nursery
0,5 km
Primary school
0,7 km
Secondary school
0,8 km
View homes in Vreewijk

Easily find available homes, schools and supermarkets on our map.

View 73 homes for sale View 17 homes for rent
Rate Vreewijk

Share your opinion and help improve the neighbourhood.

  • Takes less than 2 minutes
  • Help home seekers
  • Improve your neighbourhood
Write a review
7.0
Residents give Vreewijk a good rating
This score is based on 14 responses
Join the conversation
Safety
Housing
Cleanliness
Amenities
Education
Community
Greenery
Accessibility

Experiences of Vreewijk

Join the conversation
5.8
Maria Nederland
Family · Terraced house
27-02-2026
Reasonably nice neighbourhood, shame that household waste stays on the street too long

Well, I was born here so I grew up with the neighbourhood as it is now.

Auto-translated to English by AI
7.8
1lnge muter
Living together · Terraced house
20-01-2026
Quiet

L

Auto-translated to English by AI
8.0
Inge muter
Living together · Terraced house
07-12-2025
Quiet

M

Auto-translated to English by AI
3.3
Rotterdam
Family · Terraced house
10-11-2025
High crime rate

A very unfriendly and unsafe environment for both adults and children. Every month there is a woman/girl raped, people shooting wildly, or a burglary. It is not recommended to go outside after dark. Neighbours don't greet each other and there is always tension between neighbours. Children who tear up flowers/plants. Parents who say nothing about it.

Auto-translated to English by AI
7.3
Anit
Living alone · Terraced house
03-08-2025
Good and bad parts in the neighbourhood

This part little nuisance Neighbours looking out for each other Still togetherness and cosiness

Auto-translated to English by AI
6.9
Brenda geluk
Living alone · Overig
14-01-2025
Old-fashioned cosy

It's a cosy neighbourhood that's quickly deteriorating, but people still look out for each other. It's a working-class neighbourhood. A shame it's so dirty, etc. But I'm staying. The municipality should deploy more litter pickers, etc., and possibly increase fines for littering.

Auto-translated to English by AI
6.5
S
Family · Overig
17-12-2024
Unusually self-evident

I know a larger part of the area, but it's difficult to share my experience because I'm mostly at work; I only come home after work and go out for work.

Auto-translated to English by AI
7.6
Wilma van der Heiden
Living alone · Terraced house
17-12-2024
Decent neighbourhood

It's like a village, which makes it cosy. Parking is sometimes a problem, even if you pay for it annually. Otherwise cosy and quiet, except around New Year's Eve with fireworks, then there's some noise. Reasonably clean, sometimes a bit of a mess near the playground.

Auto-translated to English by AI

Statistics about the residents

Ages

Residents per age category

Household composition

Households per category
4,010Single-person households
1,620Households without children
2,390Households with children

Gender

Residents by gender
Men
Women

Marital status

Residents by marital status
Married
Unmarried
Divorced
Widowed

Origin

Residents per category of origin
Netherlands
Europe
Outside Europe

Work & income

Labour participation and average income
€23,000 P.A.average per resident25% below the national average
€28,100 P.A.average per income recipient25% below the national average
1%is in paid employment
0%is self-employed
1%
of the residents are employed
72%
is the national average

Education level

Residents per education level
VMBO, MBO 1
HAVO/VWO, MBO 2-4
HBO/WO

Wealth

Median wealth per household
Vreewijk
Netherlands

Benefits

Residents per benefit type
Social assistance
Disability
Unemployment
Sponsored
View more than 250 topics about Vreewijk in clear figures and charts on AlleCijfers.nl!
View on AlleCijfers.nl

Housing market in Vreewijk

Sale price · Q3 2026
€374.188
average▲ 2,8%
€345.000
median▼ 4,8%
16 sales · vs. Q2 2026
€/m² for sale · Q3 2026
€3.689
average▼ 11,2%
€3.650
median▼ 9,6%

Sales market

Market speed and dynamics, last 12 months
73 days ▲ 16,3%
average time listed · vs. last year
85
sales in the past year
91 m²
average living area
€185.000
lowest sale price in the past year

Rental market

Market speed and dynamics, last 12 months
63 days
average time listed · vs. last year
15
lettings in the past year
102 m²
average living area
€715
lowest rent in the past year

Year built

Age of the housing stock

Energy labels

Sustainability of the housing stock

Living area

Distribution of home sizes

Statistics about the homes

Home types

Addresses per home type

Construction periods

Addresses per construction period

Labels

Addresses per energy label

Energy consumption

Average per address, compared with the Netherlands
Natural gas (m³)
Vreewijk
780
Netherlands
1.280
Electricity (kWh)
Vreewijk
2.060
Netherlands
2.810

Frequently asked questions about Vreewijk

Which type of home is most common in Vreewijk?

The housing stock is predominantly pre-war — 56% of the homes date from before 1945. In addition, the most common type is flats (43%).

How expensive are houses in Vreewijk?

Over the past year a home for sale in Vreewijk was listed for an average of €358,400 (€4,034 per m²).

What is the rent in Vreewijk?

A rental home in Vreewijk cost an average of €1,792 per month (€18 per m²).

Is Vreewijk a nice place to live?

Residents give Vreewijk a 7.0 out of 10 based on 14 reviews. Especially nature and greenery (7.7) scores well; cleanliness (6.1) receives the lowest rating.

Who lives in Vreewijk?

Buurt Vreewijk has 15,470 residents. Notably, 50% of the households are single-person households.

How sustainable is the housing supply in Vreewijk?

The housing supply in Vreewijk is remarkably efficient: 53% has an A, A+ or B label. The average natural gas consumption per household is 780 m³ per year.

Which amenities are close to Vreewijk?

From Vreewijk you can on average reach a supermarket at 0.7 km, a GP at 0.7 km, a railway station at 2.4 km, a primary school at 0.7 km (as the crow flies, source: CBS).

What is the current housing supply in Vreewijk?

Right now you will find 73 homes for sale and 17 homes for rent in Vreewijk. A home for sale here is listed for an average of 73 days — relatively long for the current market.

Buurtje.nl
Buurtje.nl in the appSearch faster and respond first
Open