District in Harderwijk
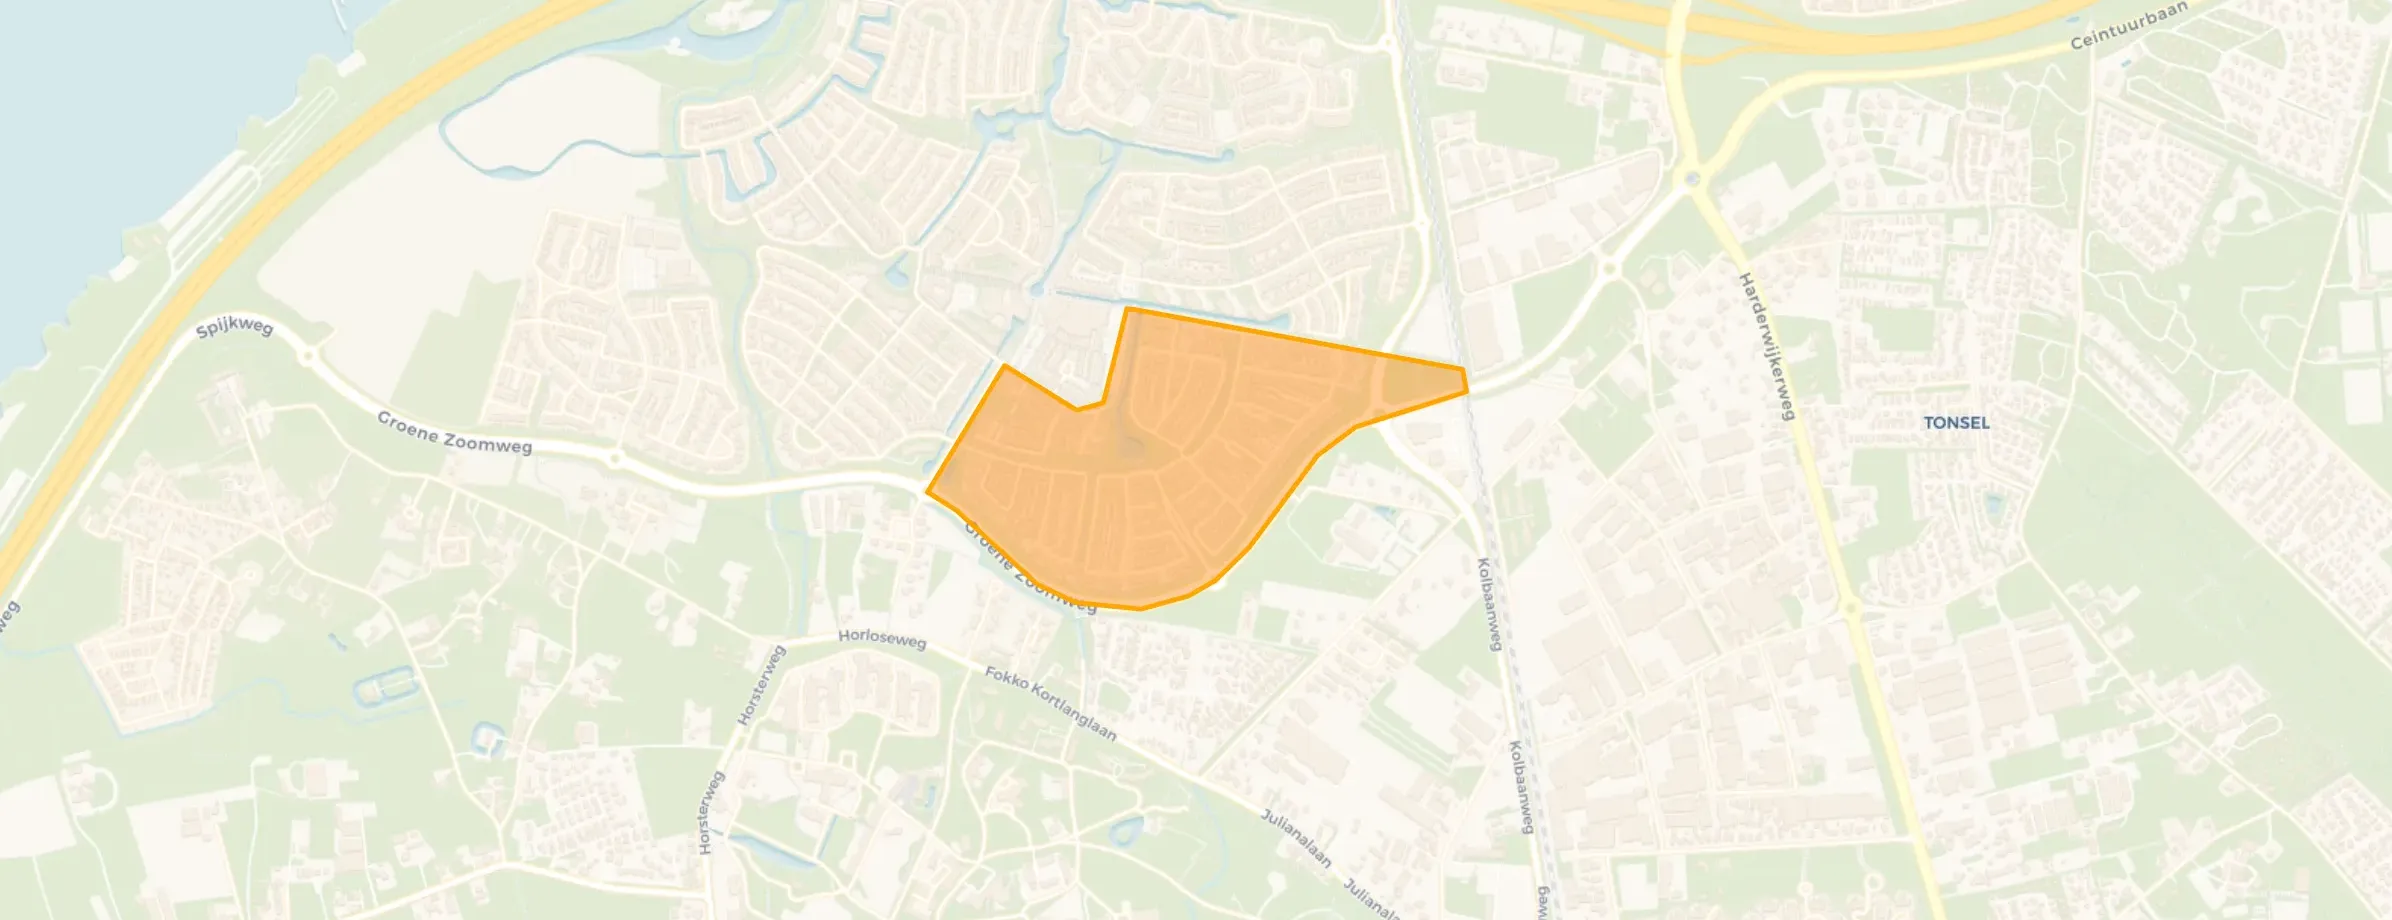
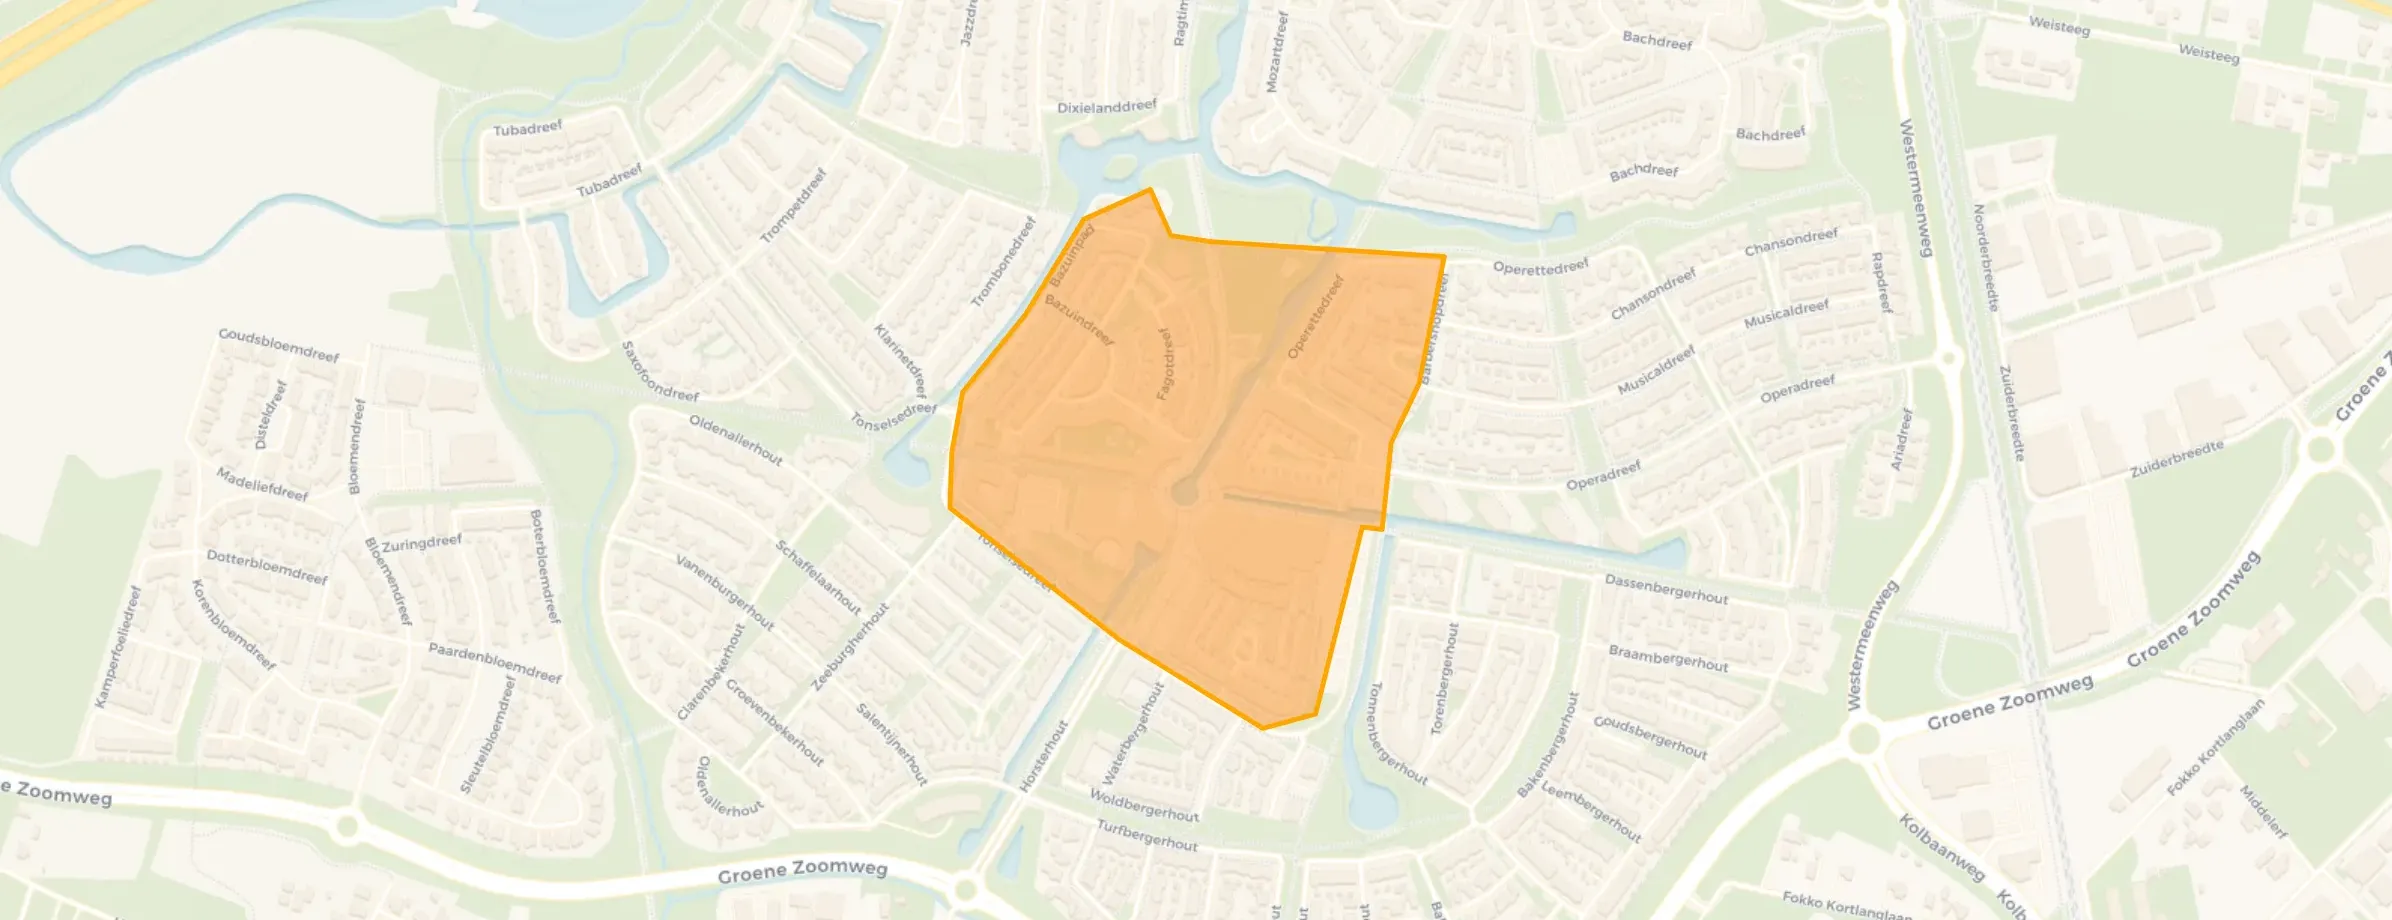
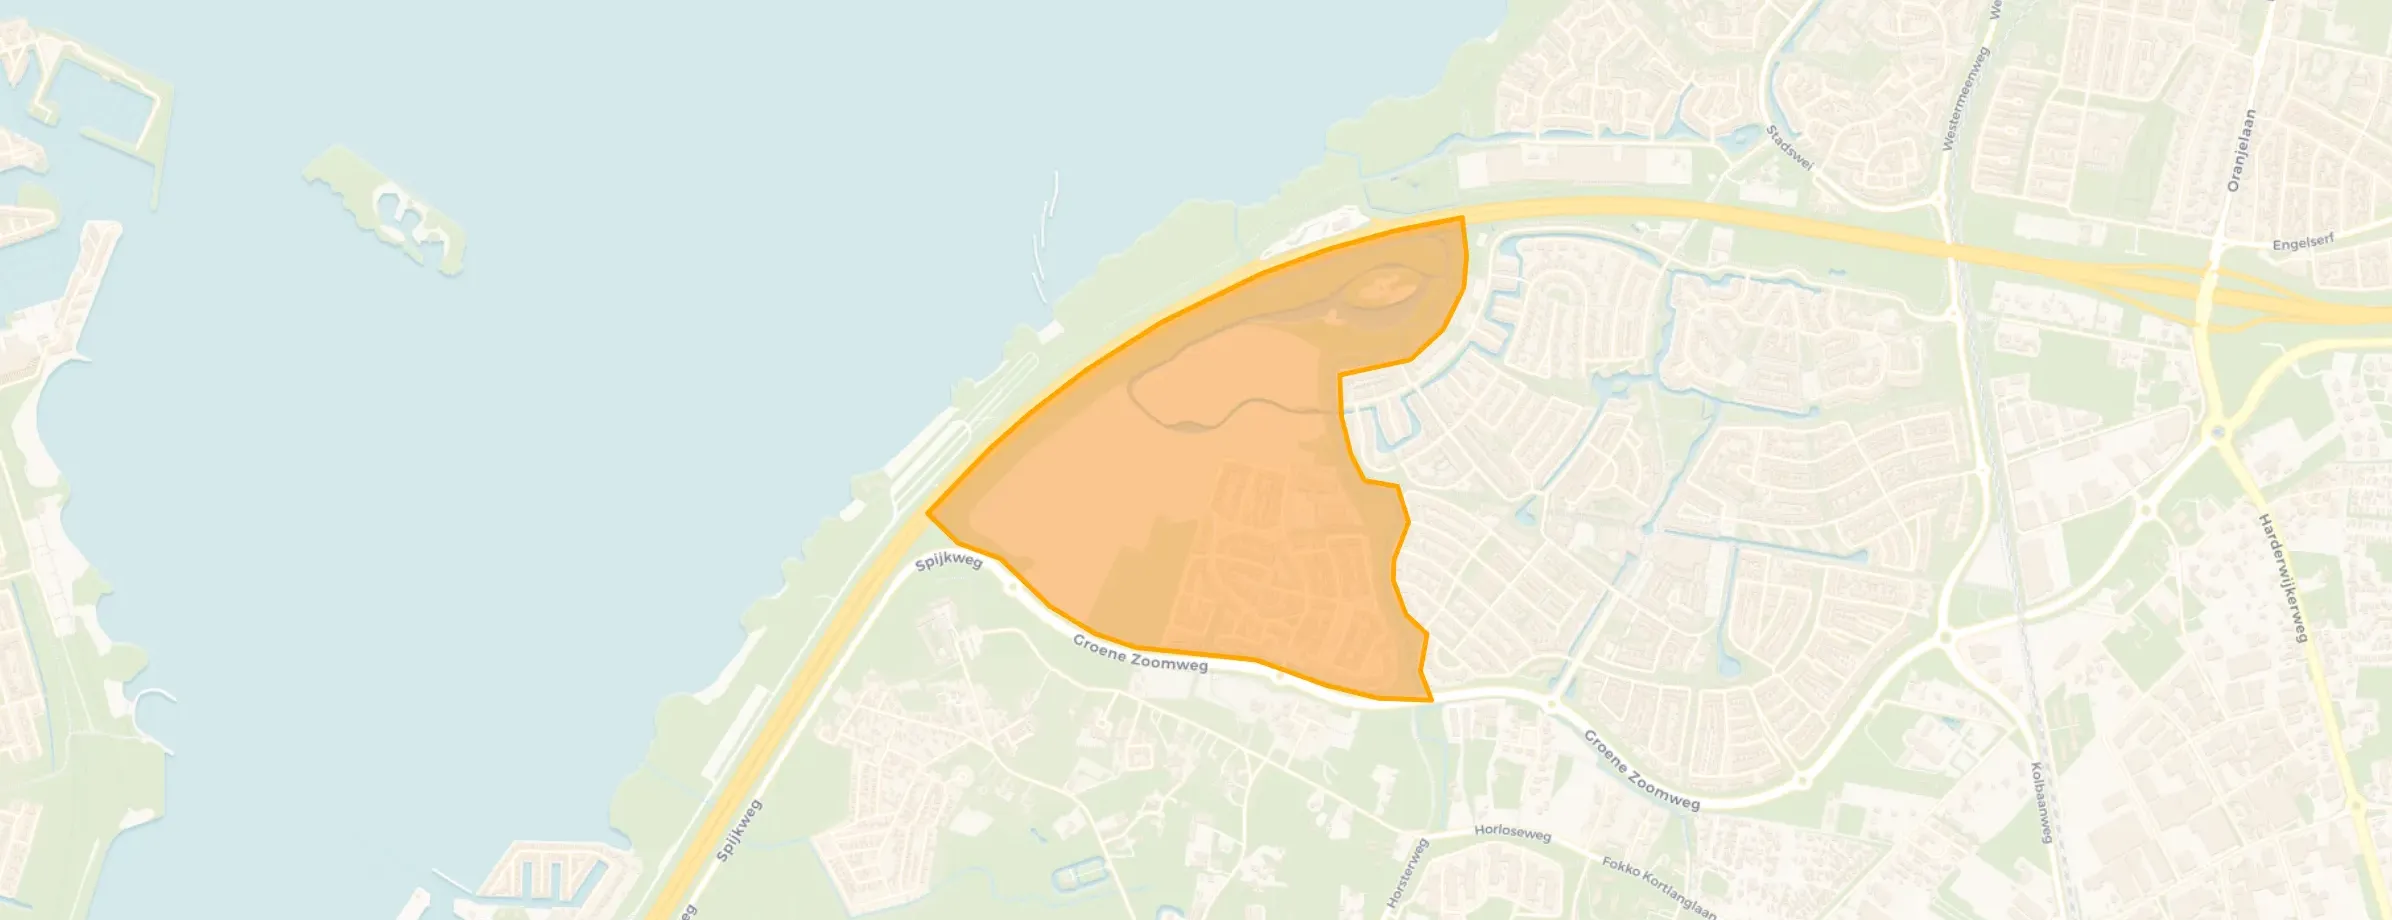
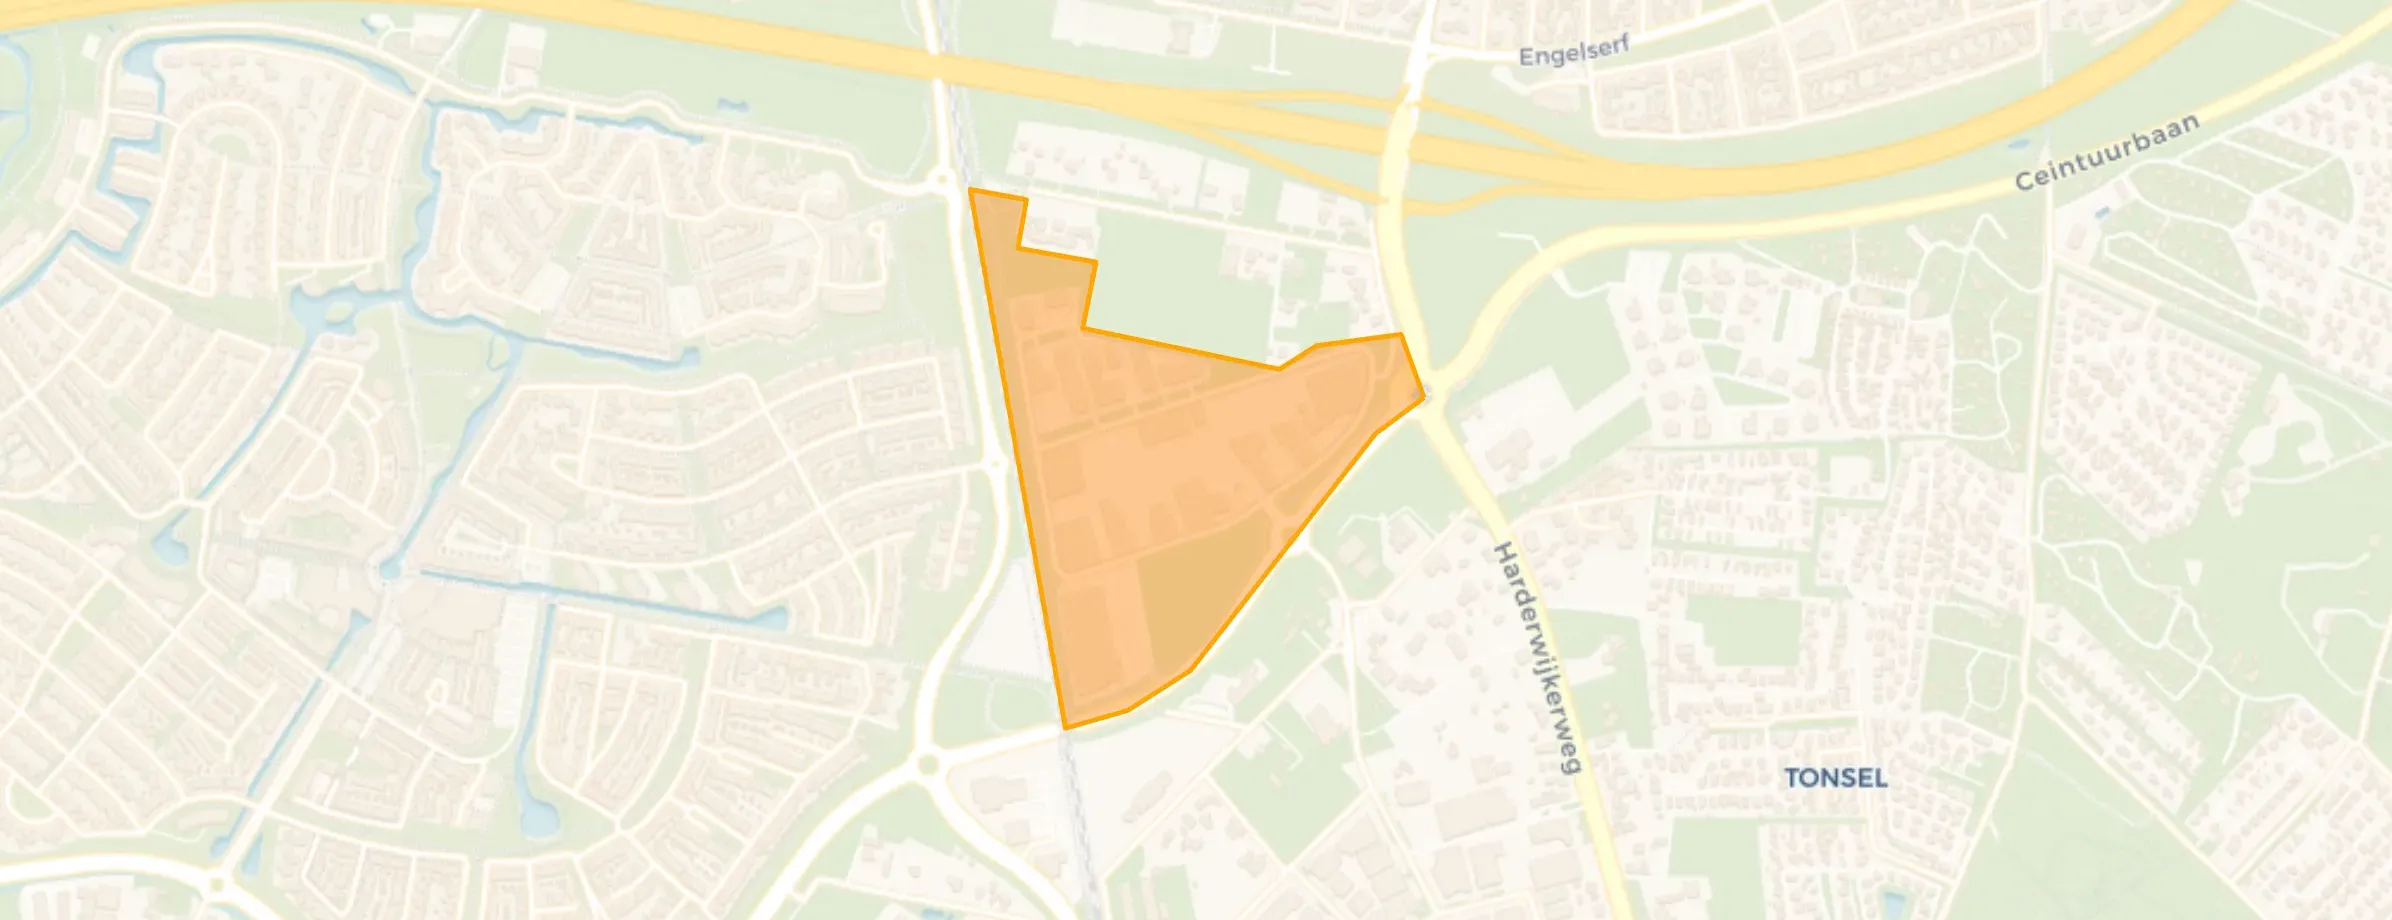
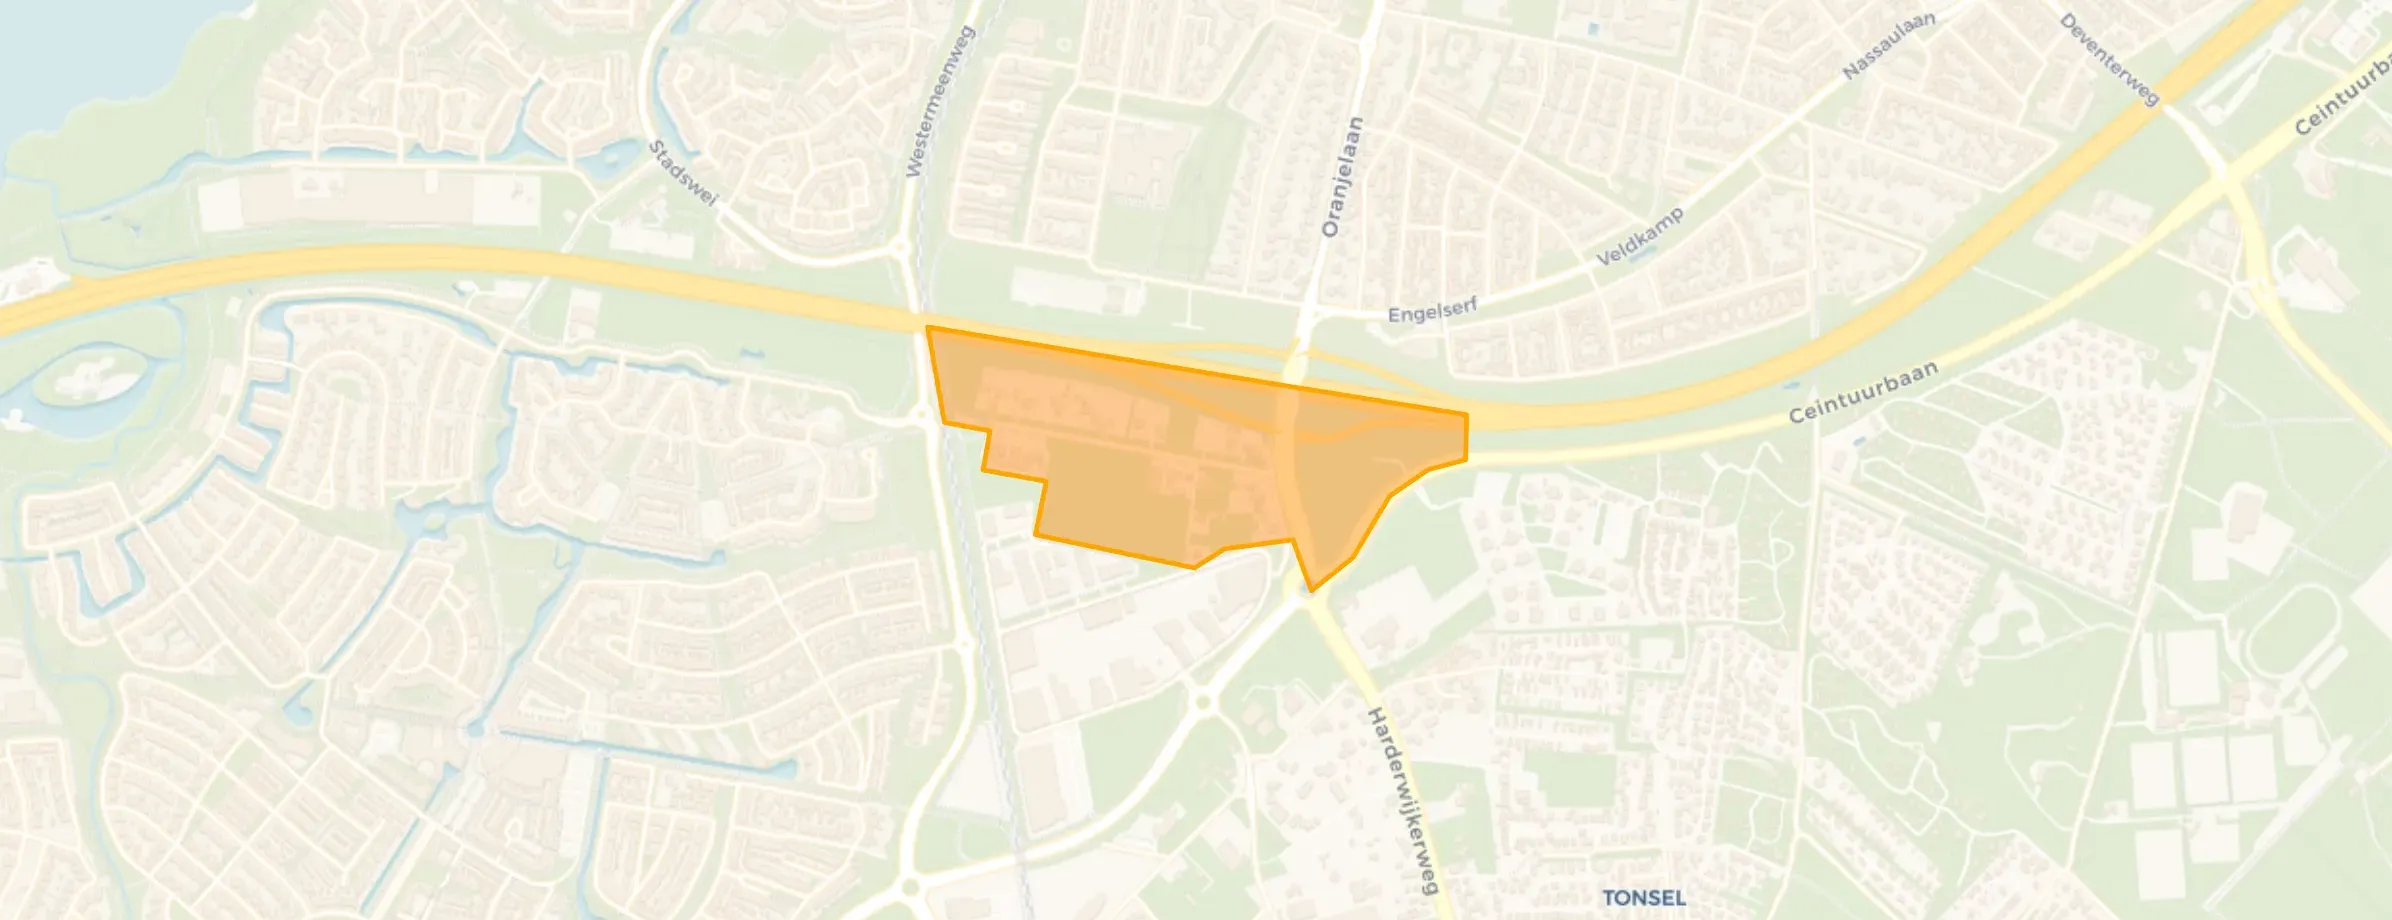
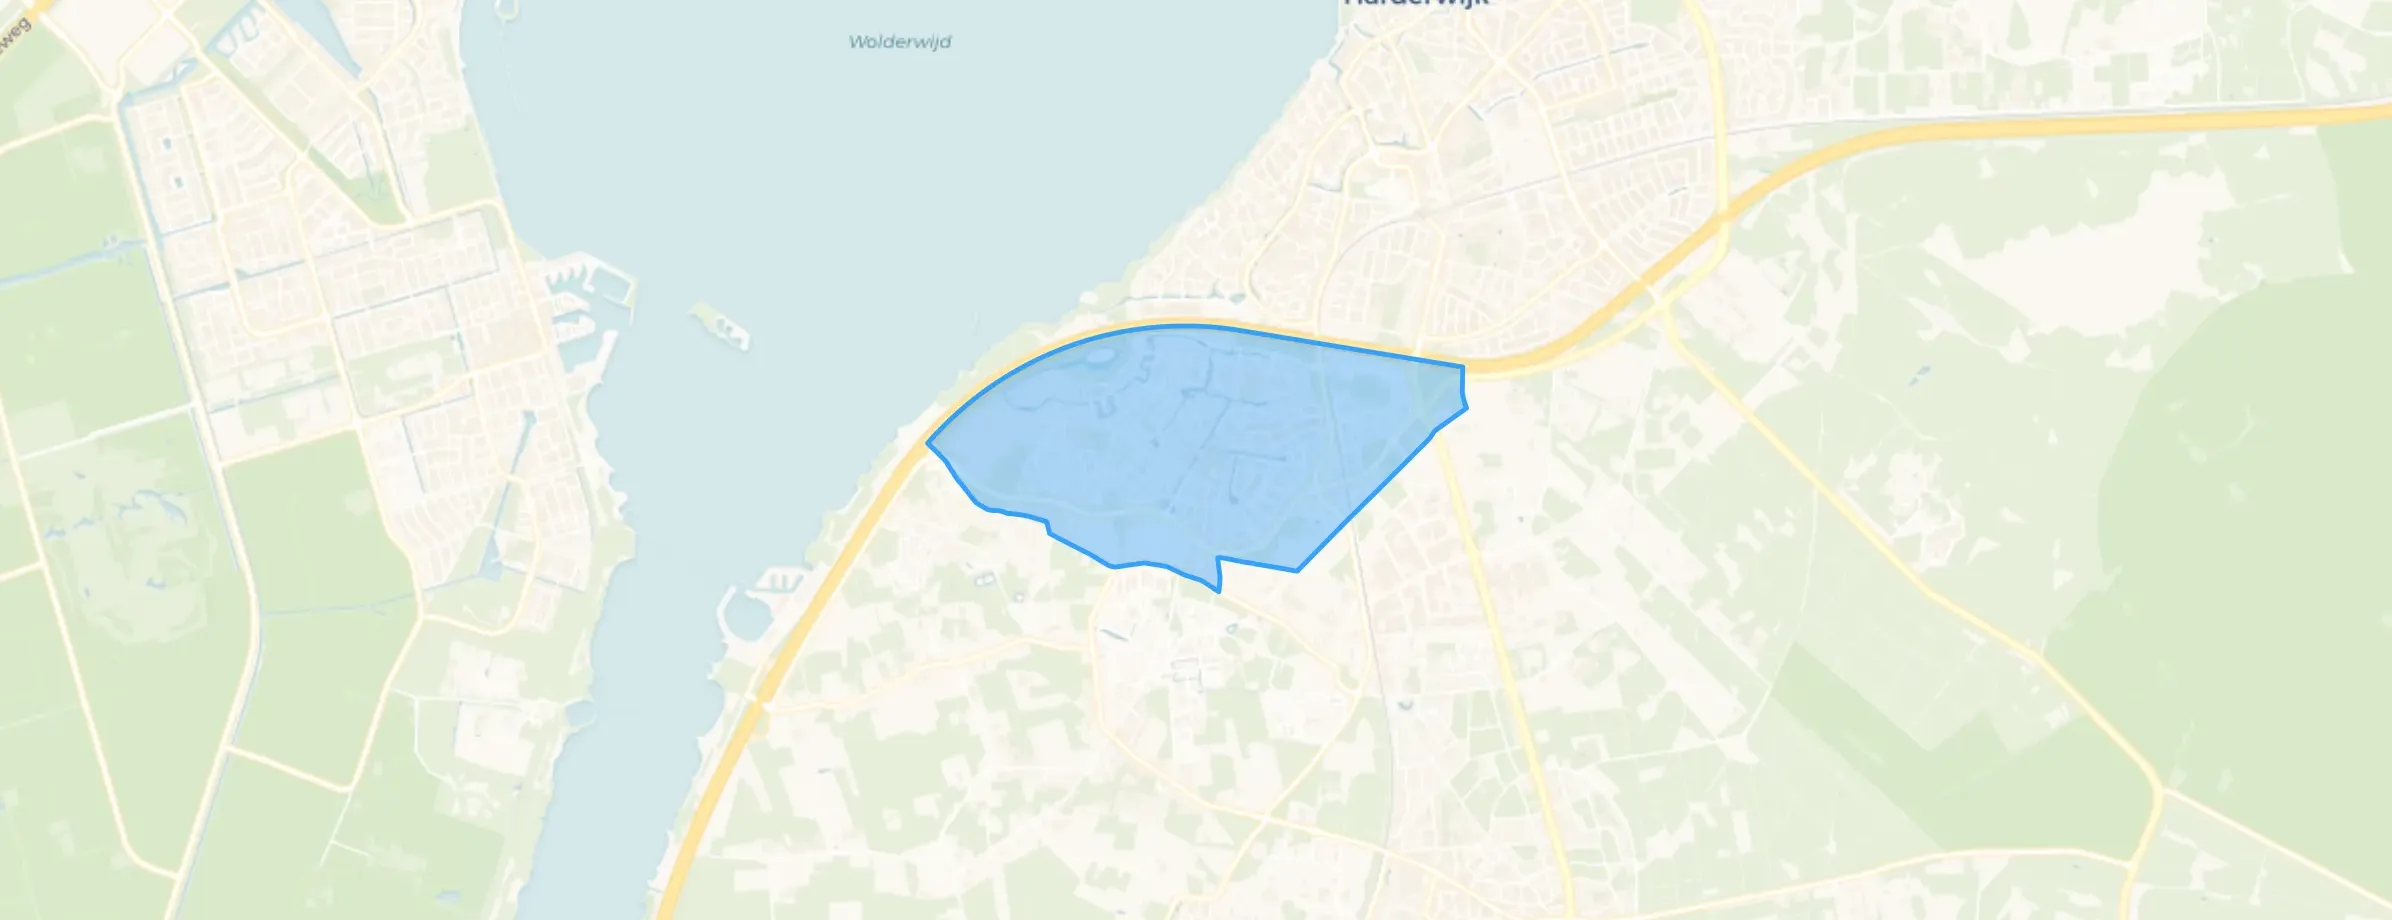
Drielanden is located in the province of Gelderland, in the municipality of Harderwijk The district has a total area of 309 hectares, of which 305 hectares are land and 4 hectares are water. The district is coded as WK024312. The postcode area is 3845AA-3845NX.
Drielanden has 10.415 residents. Of these, 49,8% are men and 50,2% are women. Most residents are 45 to 65 years (27,4%). The other age groups are 24,4% for '25 to 45 years', 20,6% for '0 to 15 years', 14,7% for '65 years or older' and 12,7% for '15 to 25 years'. Of the residents, 46,7% is unmarried, 43,9% is married, 6,4% is divorced and 3,0% is widowed. 8.605 residents originate from the Netherlands, 445 come from Europe and 1.360 come from countries outside Europe.
There are 3.980 households in Drielanden. 24,2% of these are single-person households, 27,3% households without children and 48,5% households with children. The average household size is 2,6 persons. The national average is 2,1 persons.
In Drielanden there are 8.100 income recipients. The average income per income recipient is €45.200, which is €3.000 (7%) higher than the national average of €42.200. Per resident, the average income is €35.500, which is €600 (2%) higher than the national average of €34.900. Most residents of Drielanden are educated to an intermediate level. 40,7% have an intermediate education (HAVO, VWO or MBO 2-4), 37,8% have a university or higher professional education (HBO/WO) and 21,4% have a lower education (VMBO or MBO 1).
Of the 10.415 residents, around 79% are in paid employment, which amounts to 8.228 people. This is 7% higher than the national average of 72%. The majority of workers are in salaried employment (87%), while 13% are self-employed. In Drielanden, 19% of residents receive a benefit. The largest group is those receiving a state pension (AOW). 1.390 people receive this benefit.
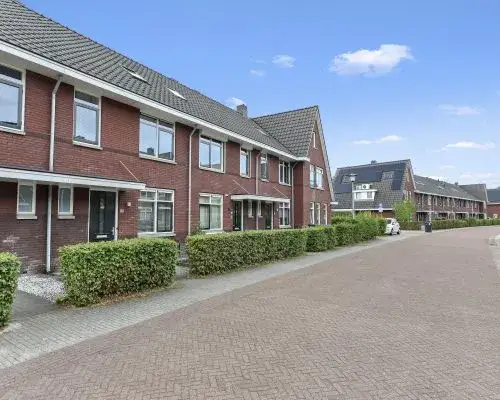
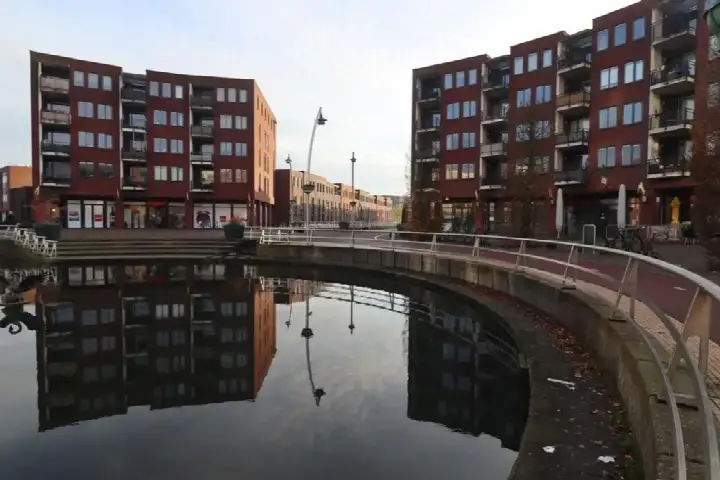
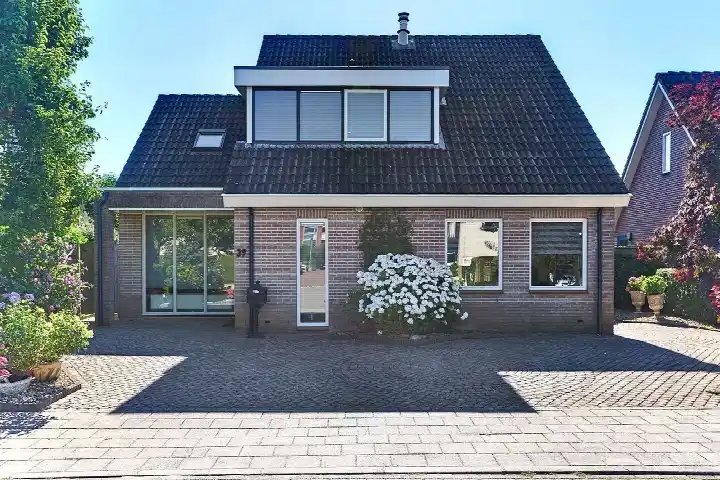
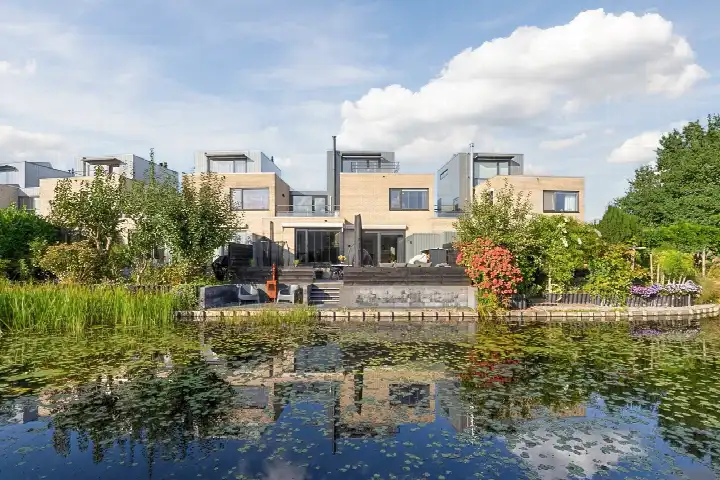
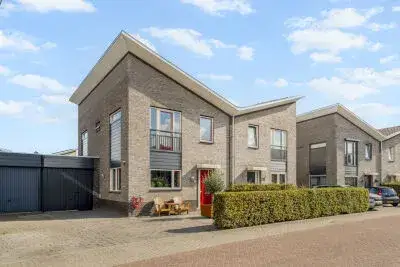
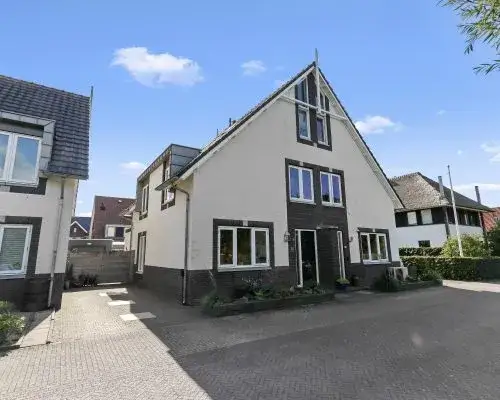
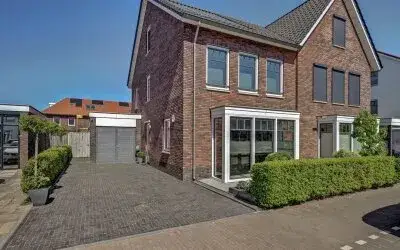
In Drielanden there are 3.980 homes with an average assessed value (WOZ) of €469.000. Of these, around 98% are occupied and 2% unoccupied. Most homes are owner-occupied. This amounts to 25% rental homes and 75% owner-occupied homes. Of the homes, 75% privately owned, 14% owned by housing associations and 11% owned by other landlords. The most common construction periods in Drielanden are 2000-2010 (45%) and 1990-2000 (30%).
There are currently no homes for sale in Drielanden. The most recently listed home is Stakenbergerhout 106 by Midden Nederland Makelaars Harderwijk B.V. op Funda. No homes were sold in Drielanden over the past year.
There are currently no homes for rent in Drielanden. The most recent home is Triasplein 108, offered by 365 Makelaardij op Pararius. No homes were let in Drielanden over the past year.
No recent rental data available for Drielanden.
In Drielanden there are 2.862 addresses with a registered energy label. The most common labels are A (64%), B (13%) and A+ (8%). On average, an address in Drielanden uses 2.750 kWh of electricity per year. This is 8% above the national average of 2.550 kWh. With an annual consumption of 750 m³ per address, natural gas consumption is 6% below the national average of 800 m³.
Nice neighbourhood, I feel safe. The area is reasonably clean, lots of greenery
Auto-translated to English by AIWe've been living here for about 8 years and are super happy with the neighbourhood; it's a quiet and safe neighbourhood. Also, it's always nice and clean and there are friendly people living here.
Auto-translated to English by AILiving in Drielanden on Mozartdreef is very pleasant. From our house, both the city centre of Harderwijk and the village centre of Ermelo are easily accessible. Drielanden also has a shopping centre for groceries close to our house, and it is a safe neighbourhood with many facilities for children and animals, among others. We have never had any problems with neighbours either. So all in all, a very pleasant neighbourhood to live in.
Auto-translated to English by AIActually, I don't have much to complain about, maybe a bit more attention to litter and nuisance from youngsters on the football fields. Fantastic neighbourhood otherwise and the city/supermarkets etc are easy to reach.
Auto-translated to English by AIVery nice and quiet neighbourhood with enough playgrounds nearby and there are 3 schools in the area and the same goes for supermarkets. The playgrounds are well maintained and there is hardly any nuisance in the evenings and if people are around, they always clean up neatly.
Auto-translated to English by AIThe neighbourhood is nicely spacious and green, but a nice park is missing. There is a park further in the district, but it is aimed at children and it is very open. Also, there could be a bit more greenery/shade for when it is very hot (I am mainly talking about the area around the shopping centre now). In addition, it is a real shame that a lot of dog owners let their dogs do their business on the pavement without cleaning it up. The municipality could also do something about the graffiti near the motorway. Simply put some greenery in front of it and it is no longer visible... Another minor downside is New Year's Eve. It is as if war has broken out, the (clearly illegal) fireworks are so loud that it is unbearable. I cannot stay in my home then. And walking around the neighbourhood quietly in the week before is also not possible. Then I feel very uncomfortable and less safe. The rest of the year, luckily, it is pleasant to live here and I feel safe in the neighbourhood.
Auto-translated to English by AIThe housing stock is relatively young — 99% dates from after 1990. In addition, the most common type is terraced houses (40%).
Over the past year a home for sale in Drielanden was listed for an average of €586,196 (€4,334 per m²). That is 11% above the Dutch national average. Last quarter prices rose by 23%.
A rental home in Drielanden cost an average of €1,339 per month (€13 per m²). That is 38% below the national average.
Residents give Drielanden a 8.3 out of 10 based on 6 reviews. Especially accessibility (9.2) scores well; nature and greenery (7.3) receives the lowest rating.
Wijk Drielanden has 10,415 residents. Many families: 48% of the households have children.
The housing supply in Drielanden is remarkably efficient: 98% has an A, A+ or B label. The average natural gas consumption per household is 750 m³ per year.
From Drielanden you can on average reach a supermarket at 1.1 km, a GP at 1.4 km, a railway station at 3.5 km, a primary school at 1.0 km (as the crow flies, source: CBS).
Right now you will find 41 homes for sale and 3 homes for rent in Drielanden.