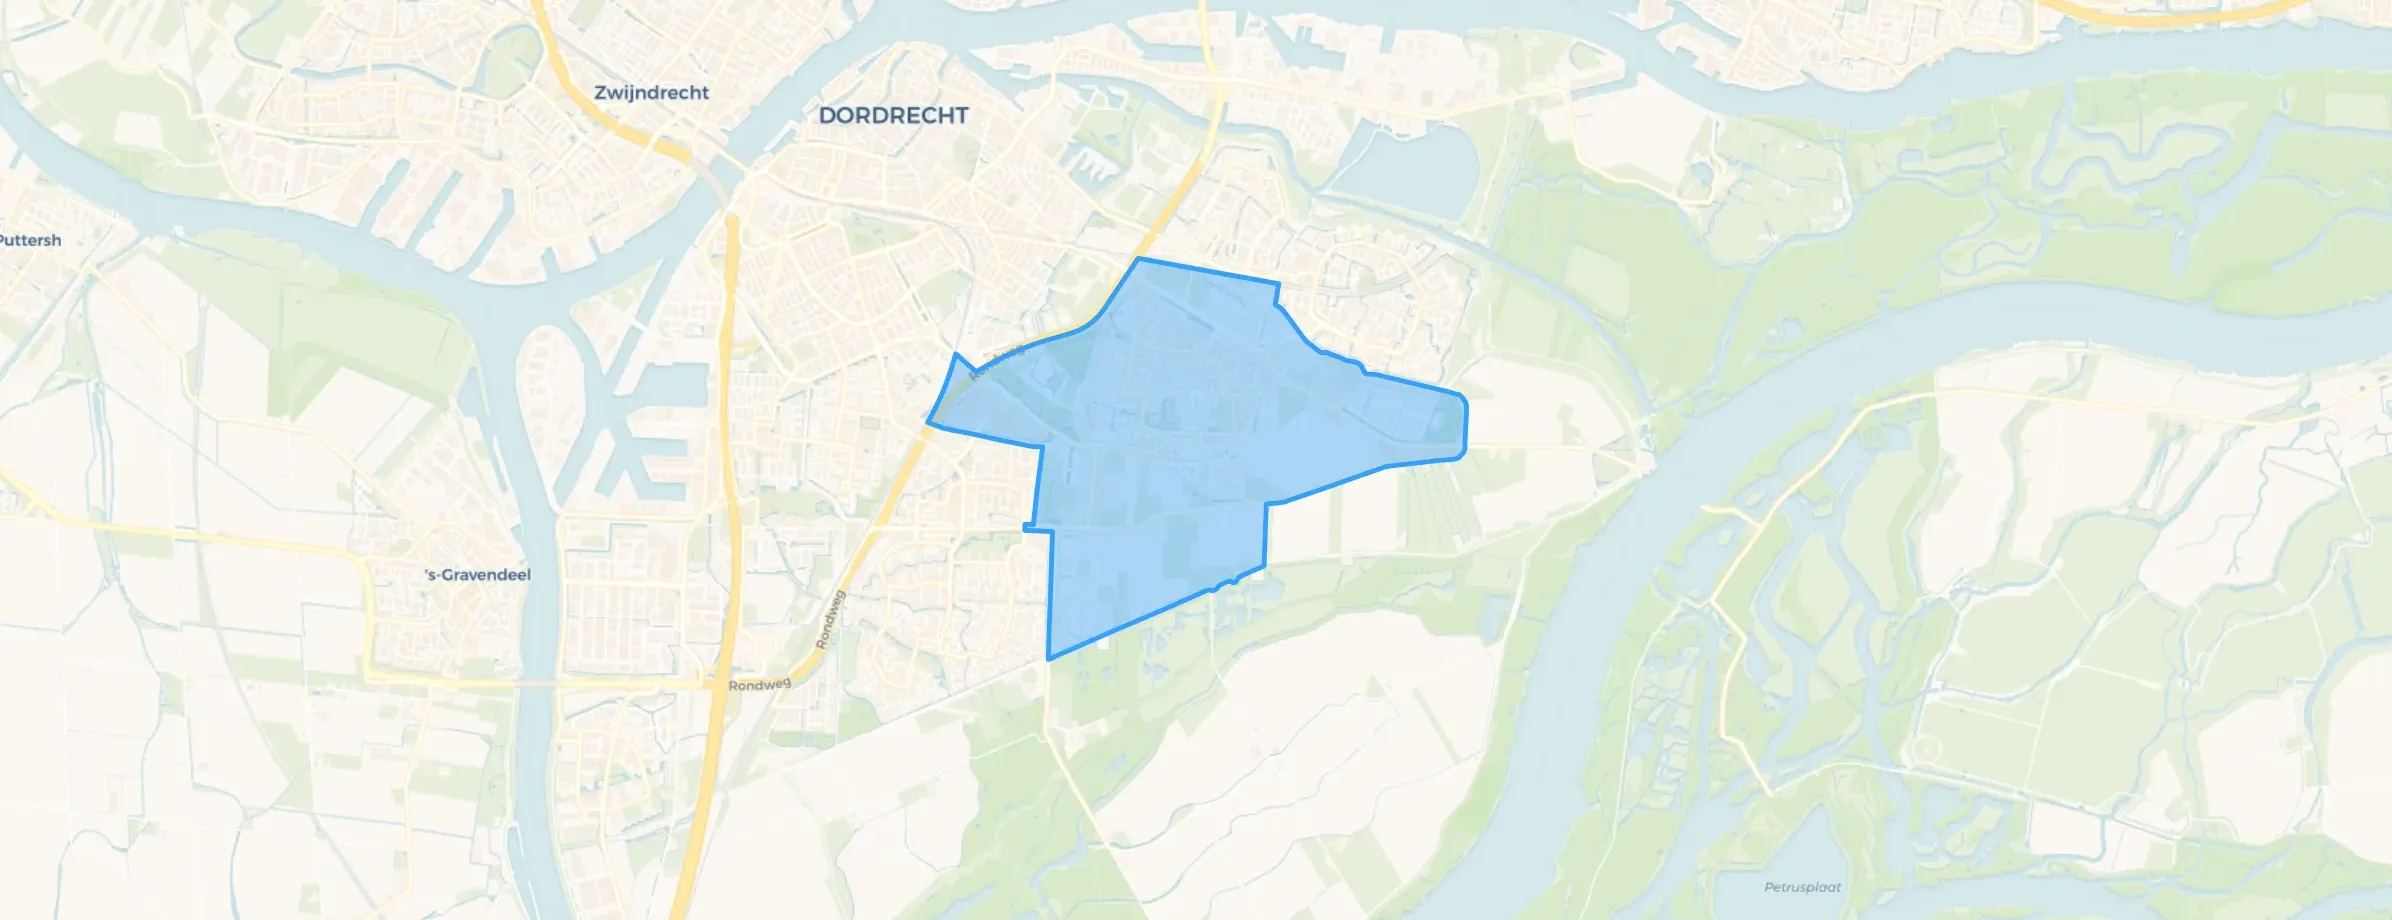
District in Dordrecht
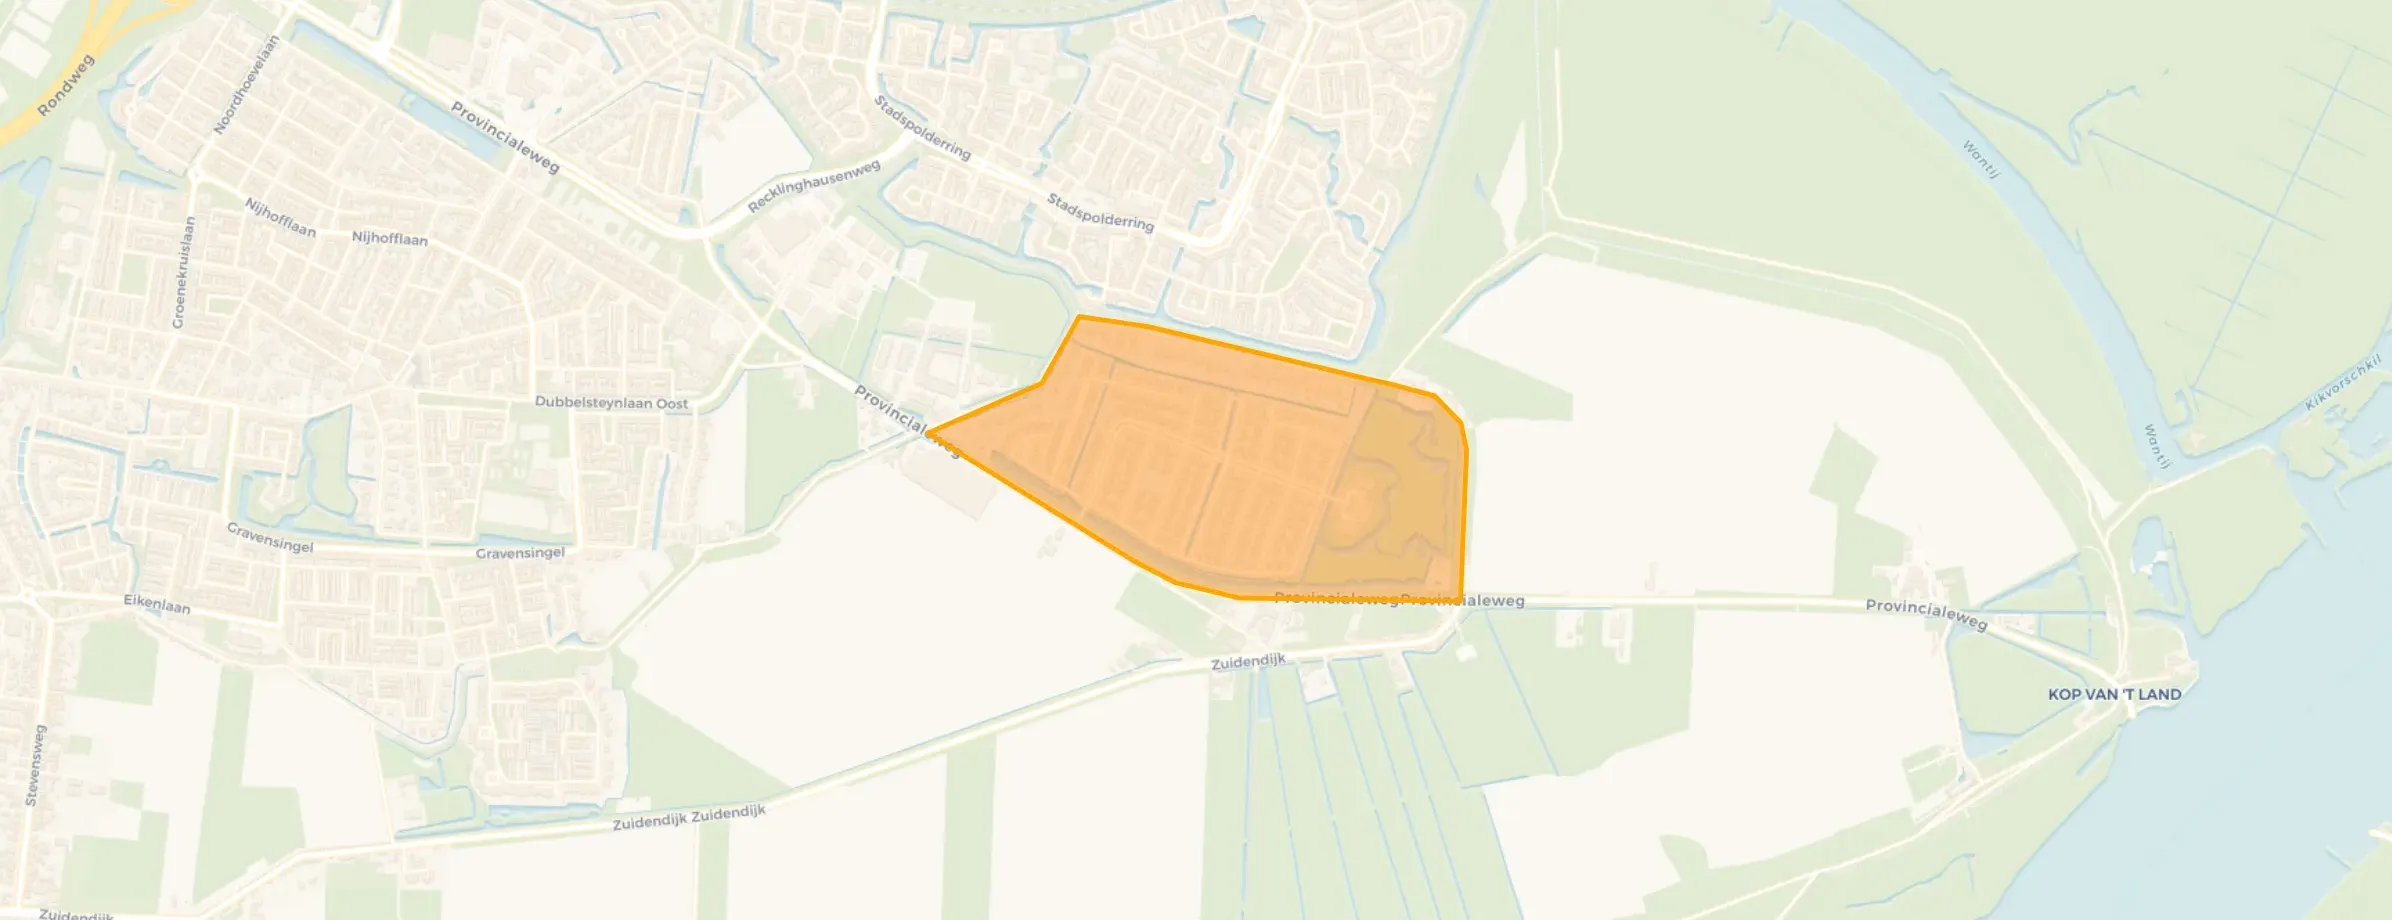
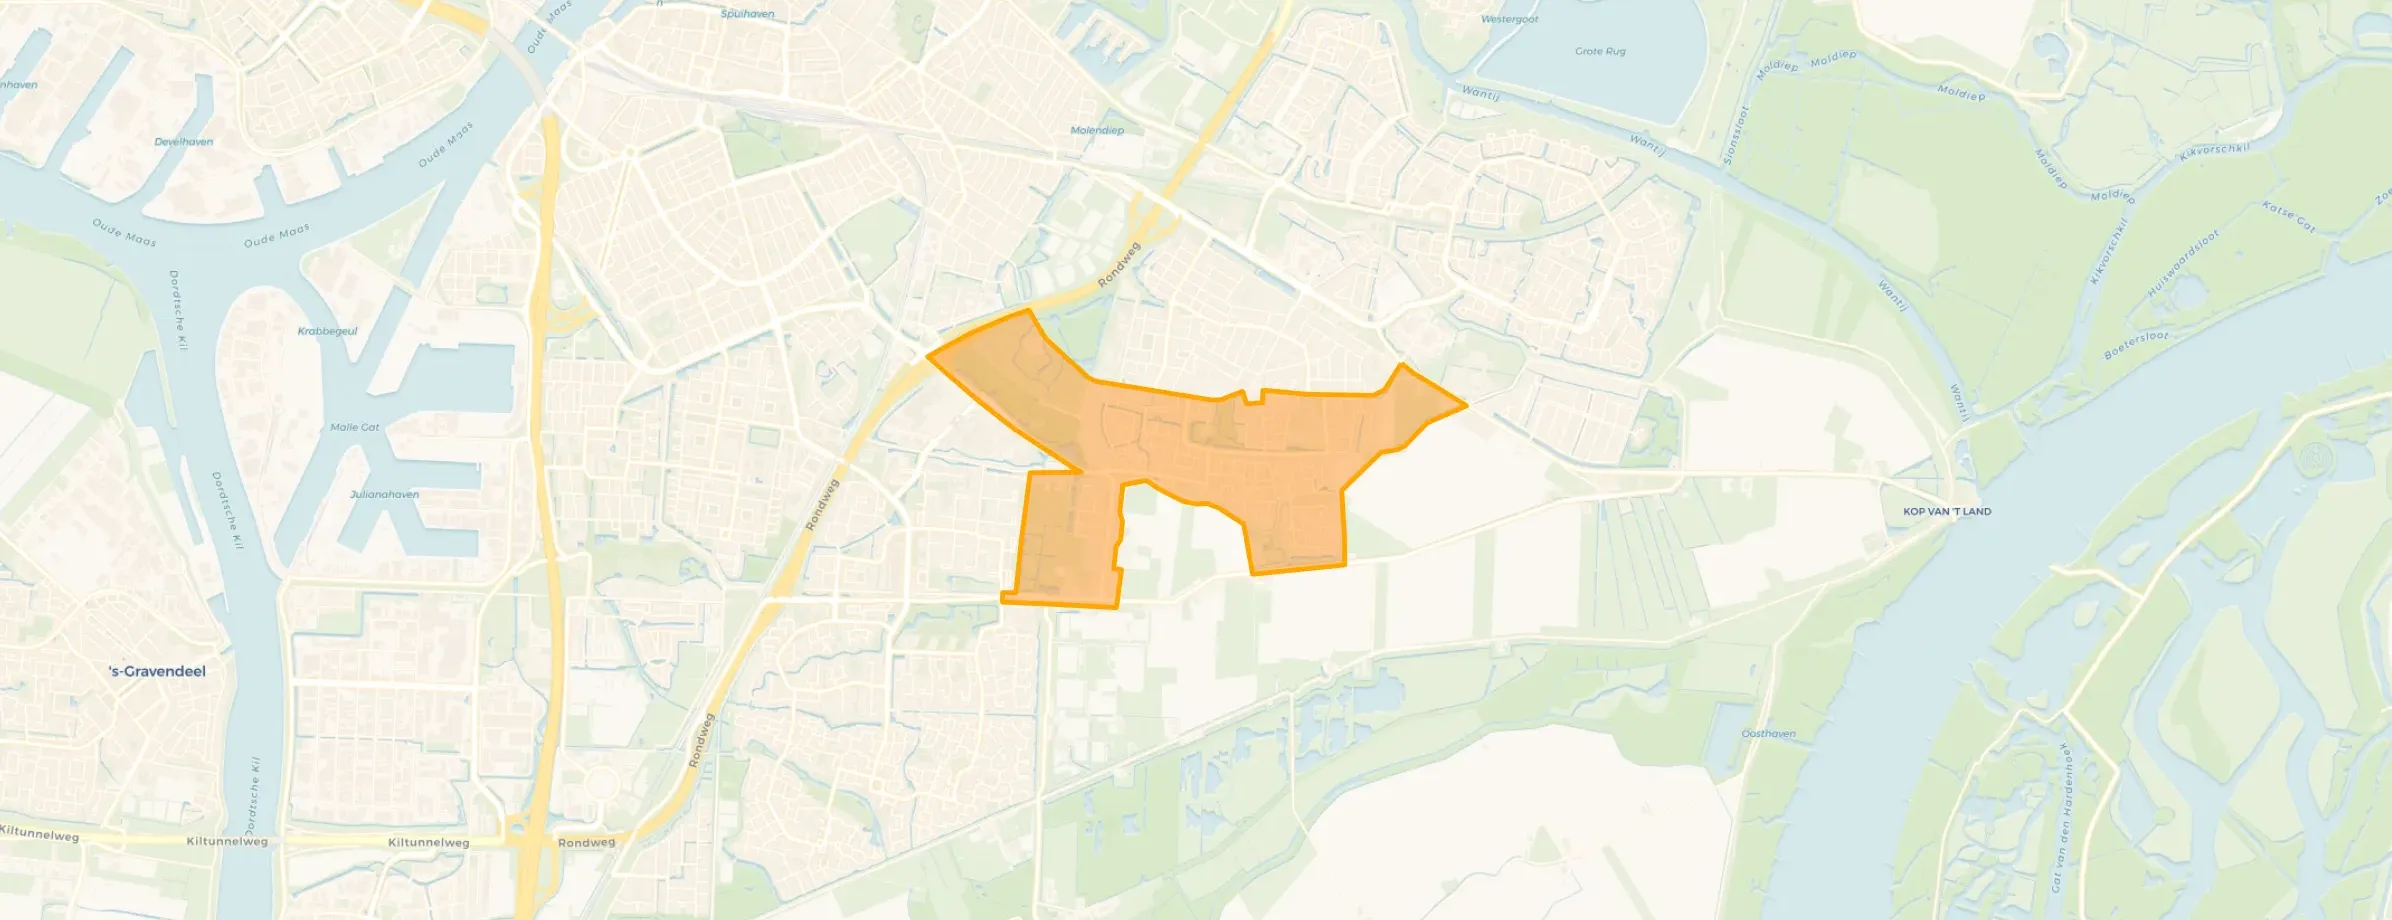
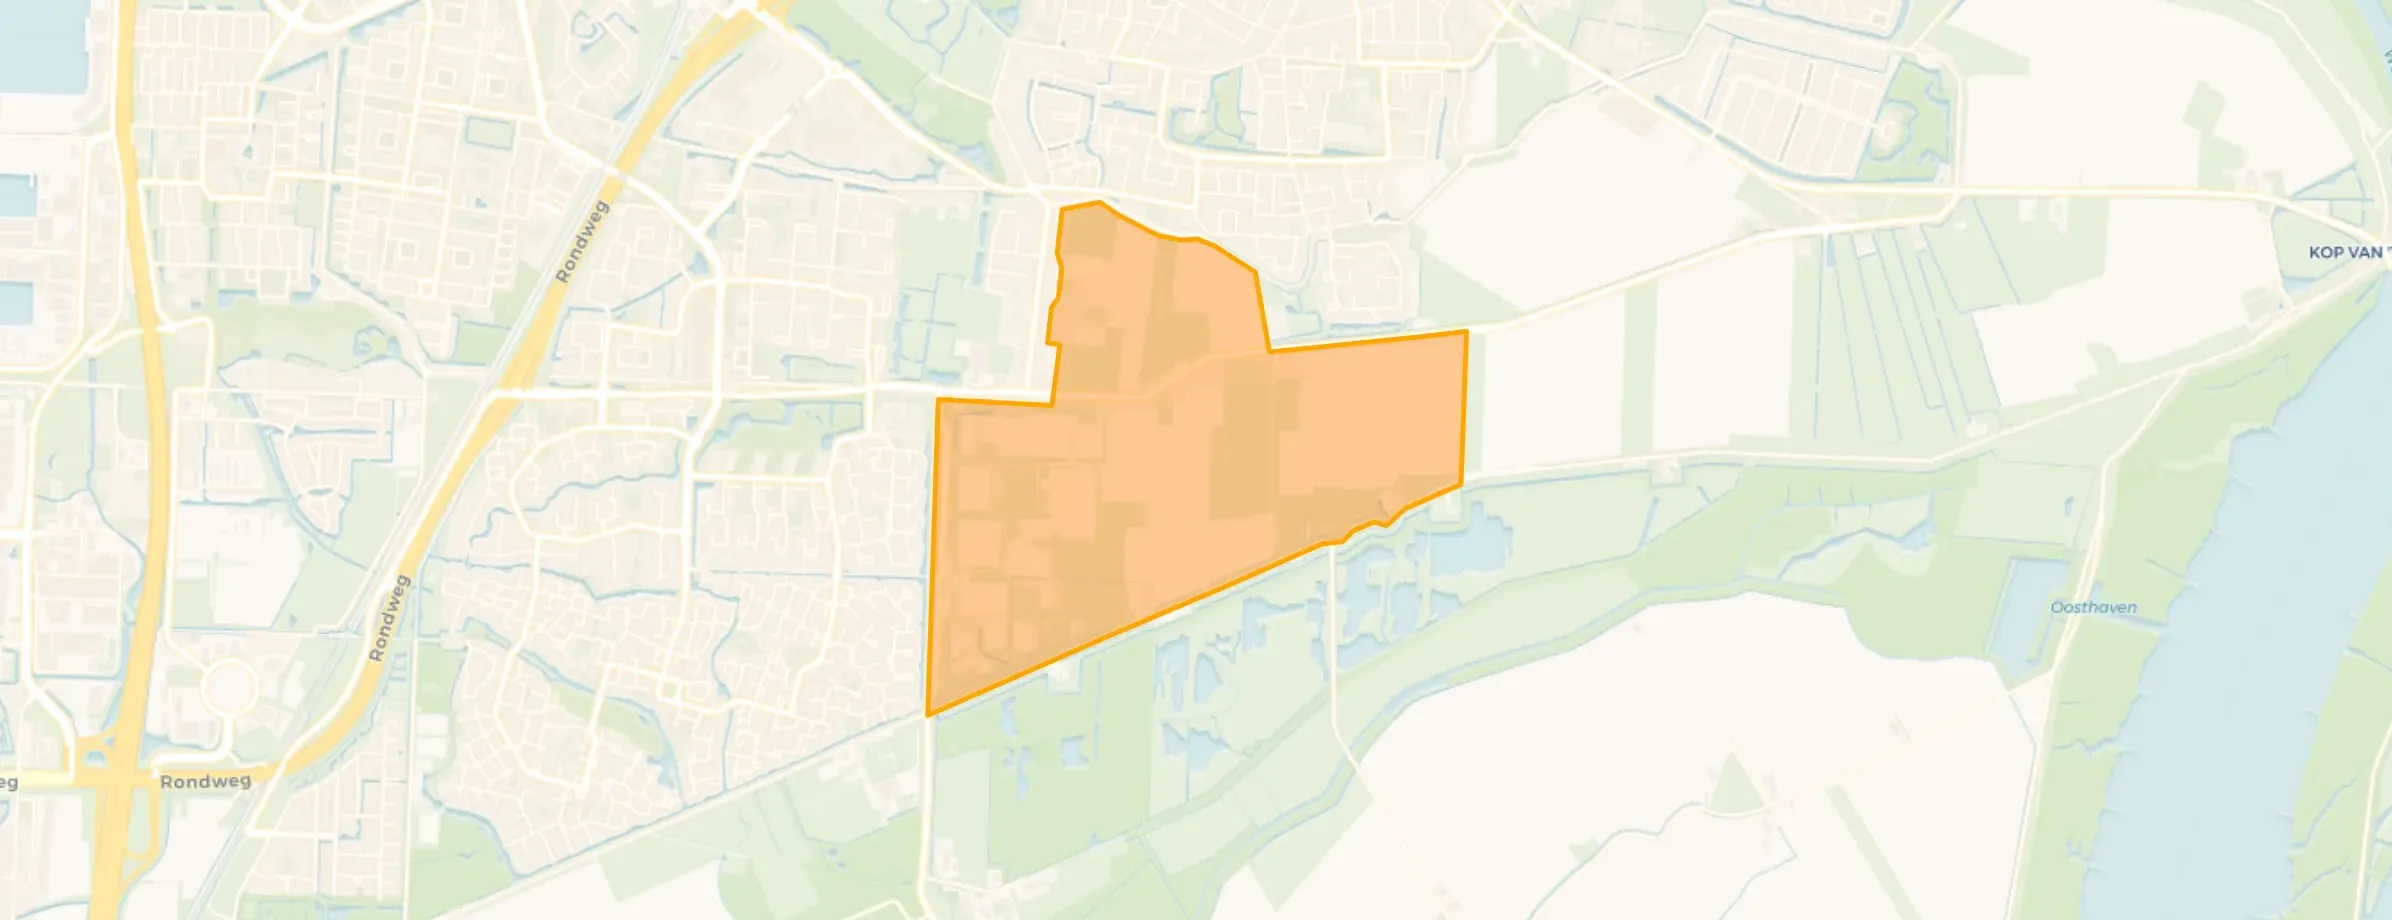
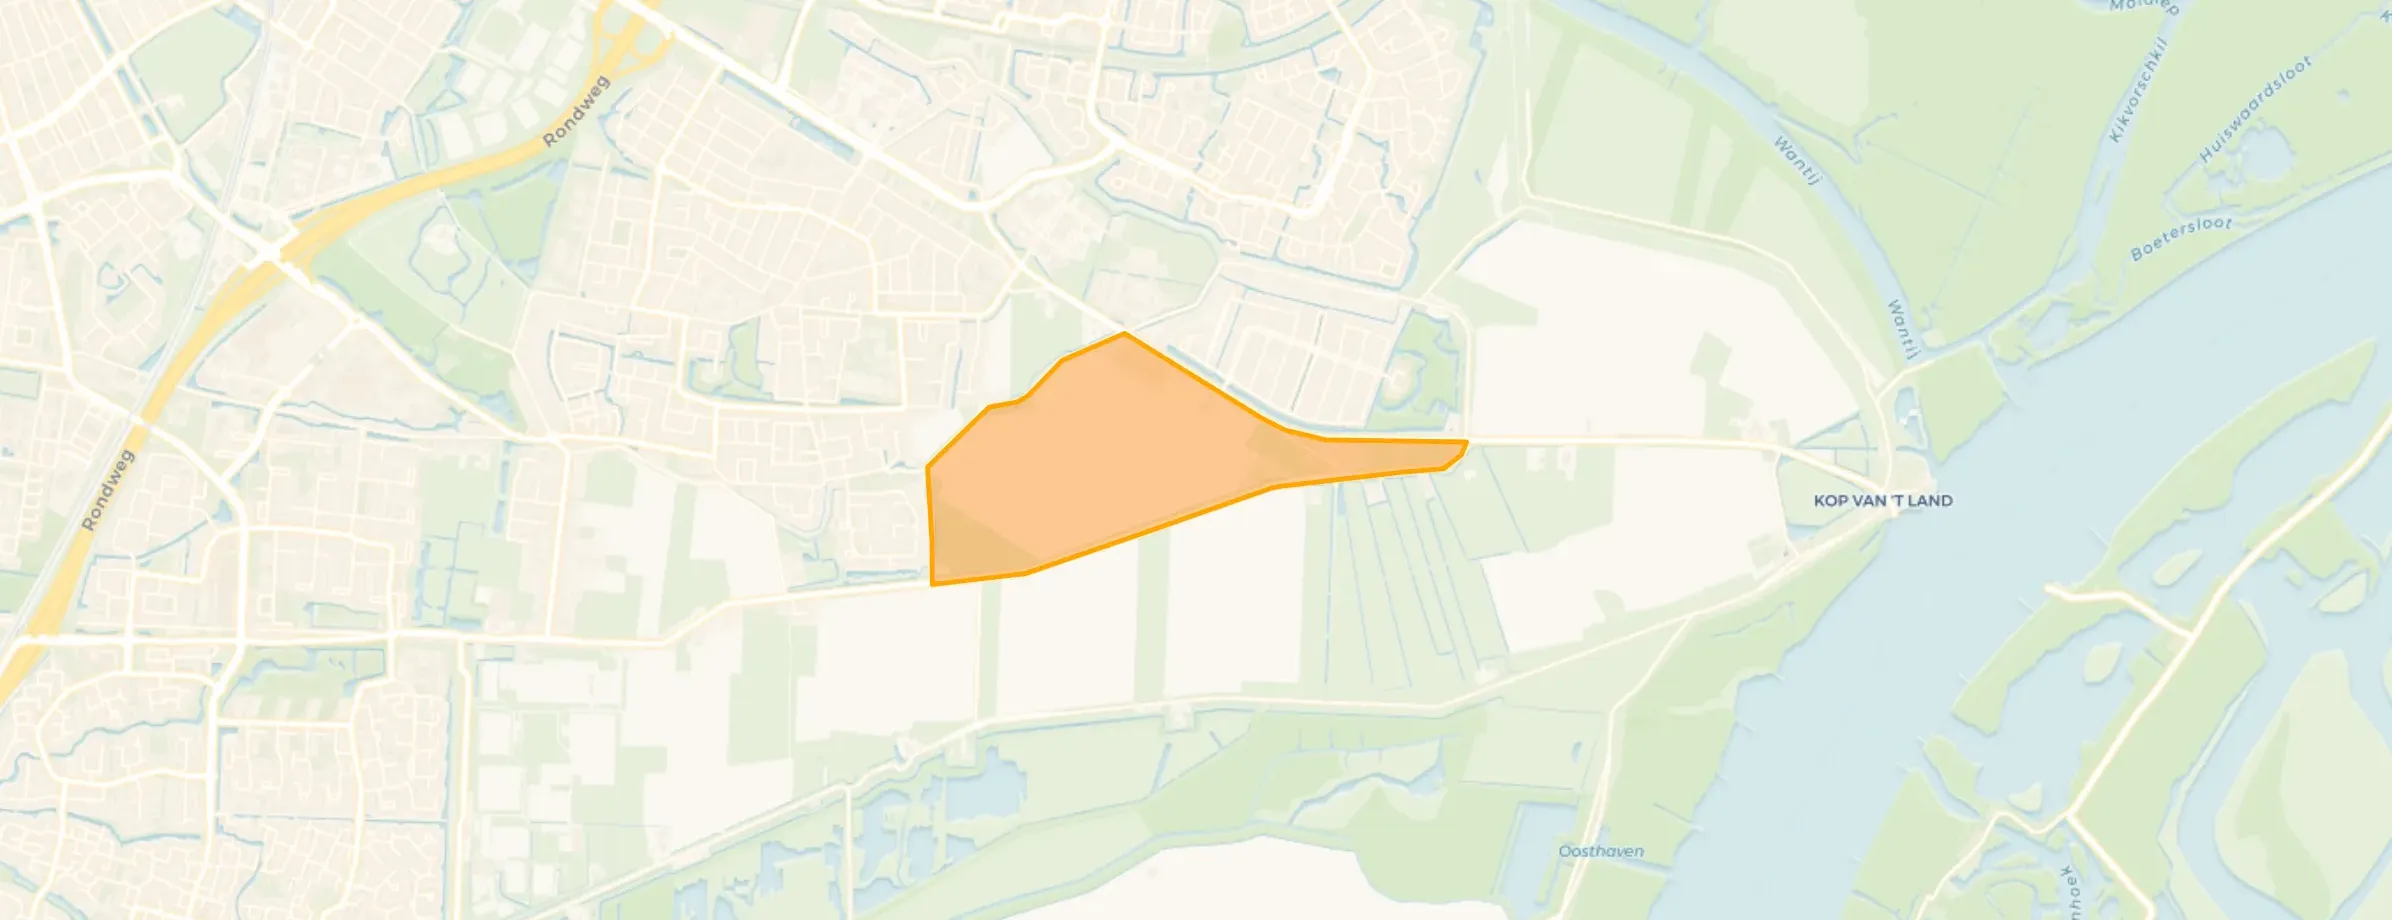
Dubbeldam is located in the province of Zuid-Holland, in the municipality of Dordrecht The district has a total area of 692 hectares, of which 678 hectares are land and 14 hectares are water. The district is coded as WK050510. The postcode area is 3318AG-3329LK.
Dubbeldam has 12.850 residents. Of these, 48,6% are men and 51,3% are women. Most residents are 45 to 65 years (28,6%). The other age groups are 27,4% for '65 years or older', 17,7% for '25 to 45 years', 14,5% for '0 to 15 years' and 11,6% for '15 to 25 years'. Of the residents, 39,8% is unmarried, 46,9% is married, 6,0% is divorced and 7,3% is widowed. 11.055 residents originate from the Netherlands, 680 come from Europe and 1.115 come from countries outside Europe.
There are 5.200 households in Dubbeldam. 26,5% of these are single-person households, 35,5% households without children and 38,0% households with children. The average household size is 2,4 persons. The national average is 2,1 persons.
In Dubbeldam there are 10.300 income recipients. The average income per income recipient is €48.800, which is €6.600 (16%) higher than the national average of €42.200. Per resident, the average income is €40.300, which is €5.400 (15%) higher than the national average of €34.900. Most residents of Dubbeldam are educated to an intermediate level. 40,8% have an intermediate education (HAVO, VWO or MBO 2-4), 37,3% have a university or higher professional education (HBO/WO) and 21,9% have a lower education (VMBO or MBO 1).
Of the 12.850 residents, around 74% are in paid employment, which amounts to 9.509 people. This is 2% higher than the national average of 72%. The majority of workers are in salaried employment (81%), while 19% are self-employed. In Dubbeldam, 29% of residents receive a benefit. The largest group is those receiving a state pension (AOW). 3.170 people receive this benefit.
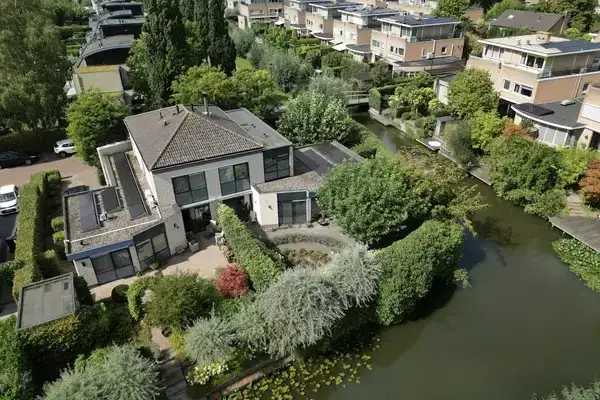
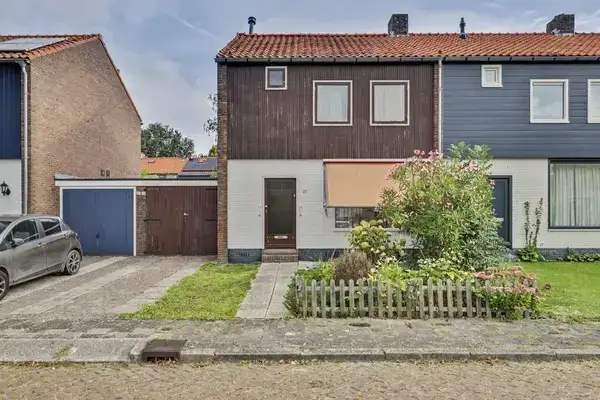
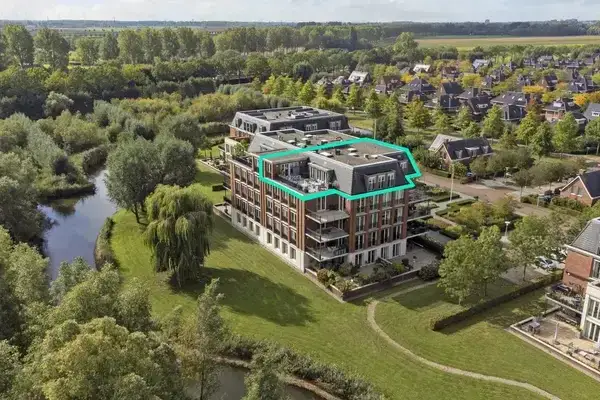
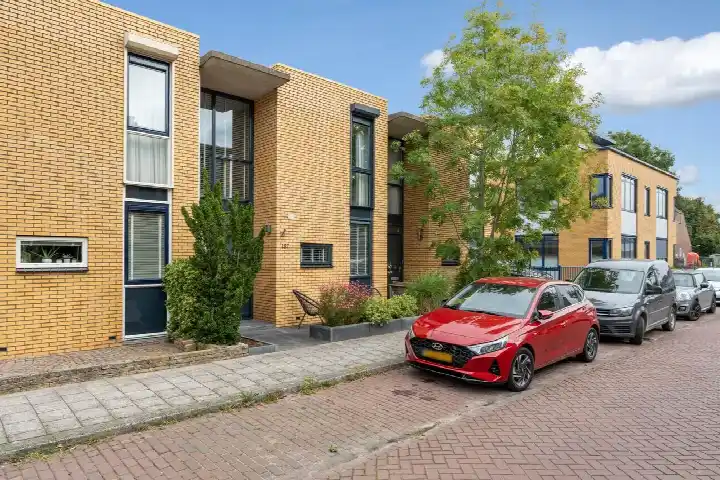
In Dubbeldam there are 5.644 homes with an average assessed value (WOZ) of €486.000. Of these, around 94% are occupied and 6% unoccupied. Most homes are owner-occupied. This amounts to 28% rental homes and 72% owner-occupied homes. Of the homes, 72% privately owned, 12% owned by housing associations and 16% owned by other landlords. The most common construction periods in Dubbeldam are 1950-1970 (36%) and 1970-1980 (14%).
There are currently no homes for sale in Dubbeldam. The most recently listed home is Dubbelsteynlaan Oost 198 by Kolpa OZP Makelaars. No homes were sold in Dubbeldam over the past year.
There are currently no homes for rent in Dubbeldam. The most recent home is Overkampweg 451, offered by vb&t Verhuurmakelaars. No homes were let in Dubbeldam over the past year.
No recent rental data available for Dubbeldam.
In Dubbeldam there are 2.877 addresses with a registered energy label. The most common labels are A (38%), C (19%) and B (15%). On average, an address in Dubbeldam uses 2.880 kWh of electricity per year. This is 13% above the national average of 2.550 kWh. Natural gas consumption, at 900 m³ per year, is 13% above the national average of 800 m³.
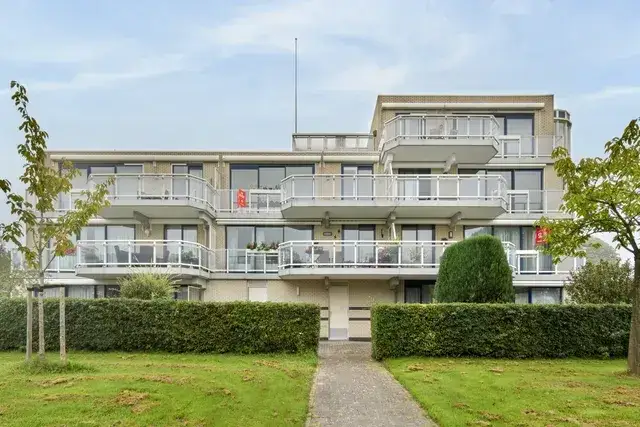
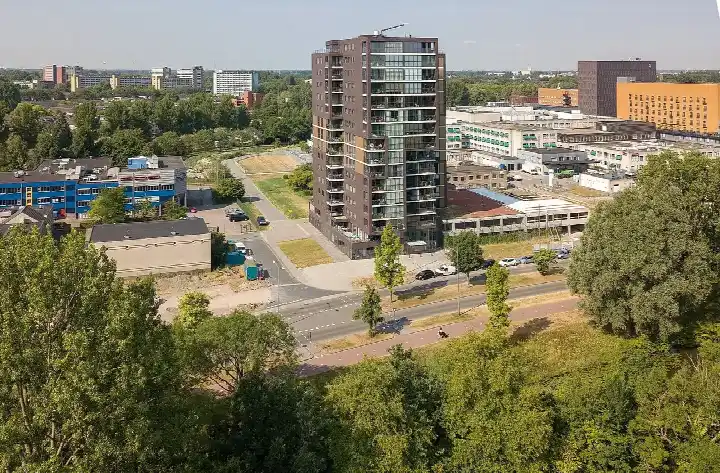
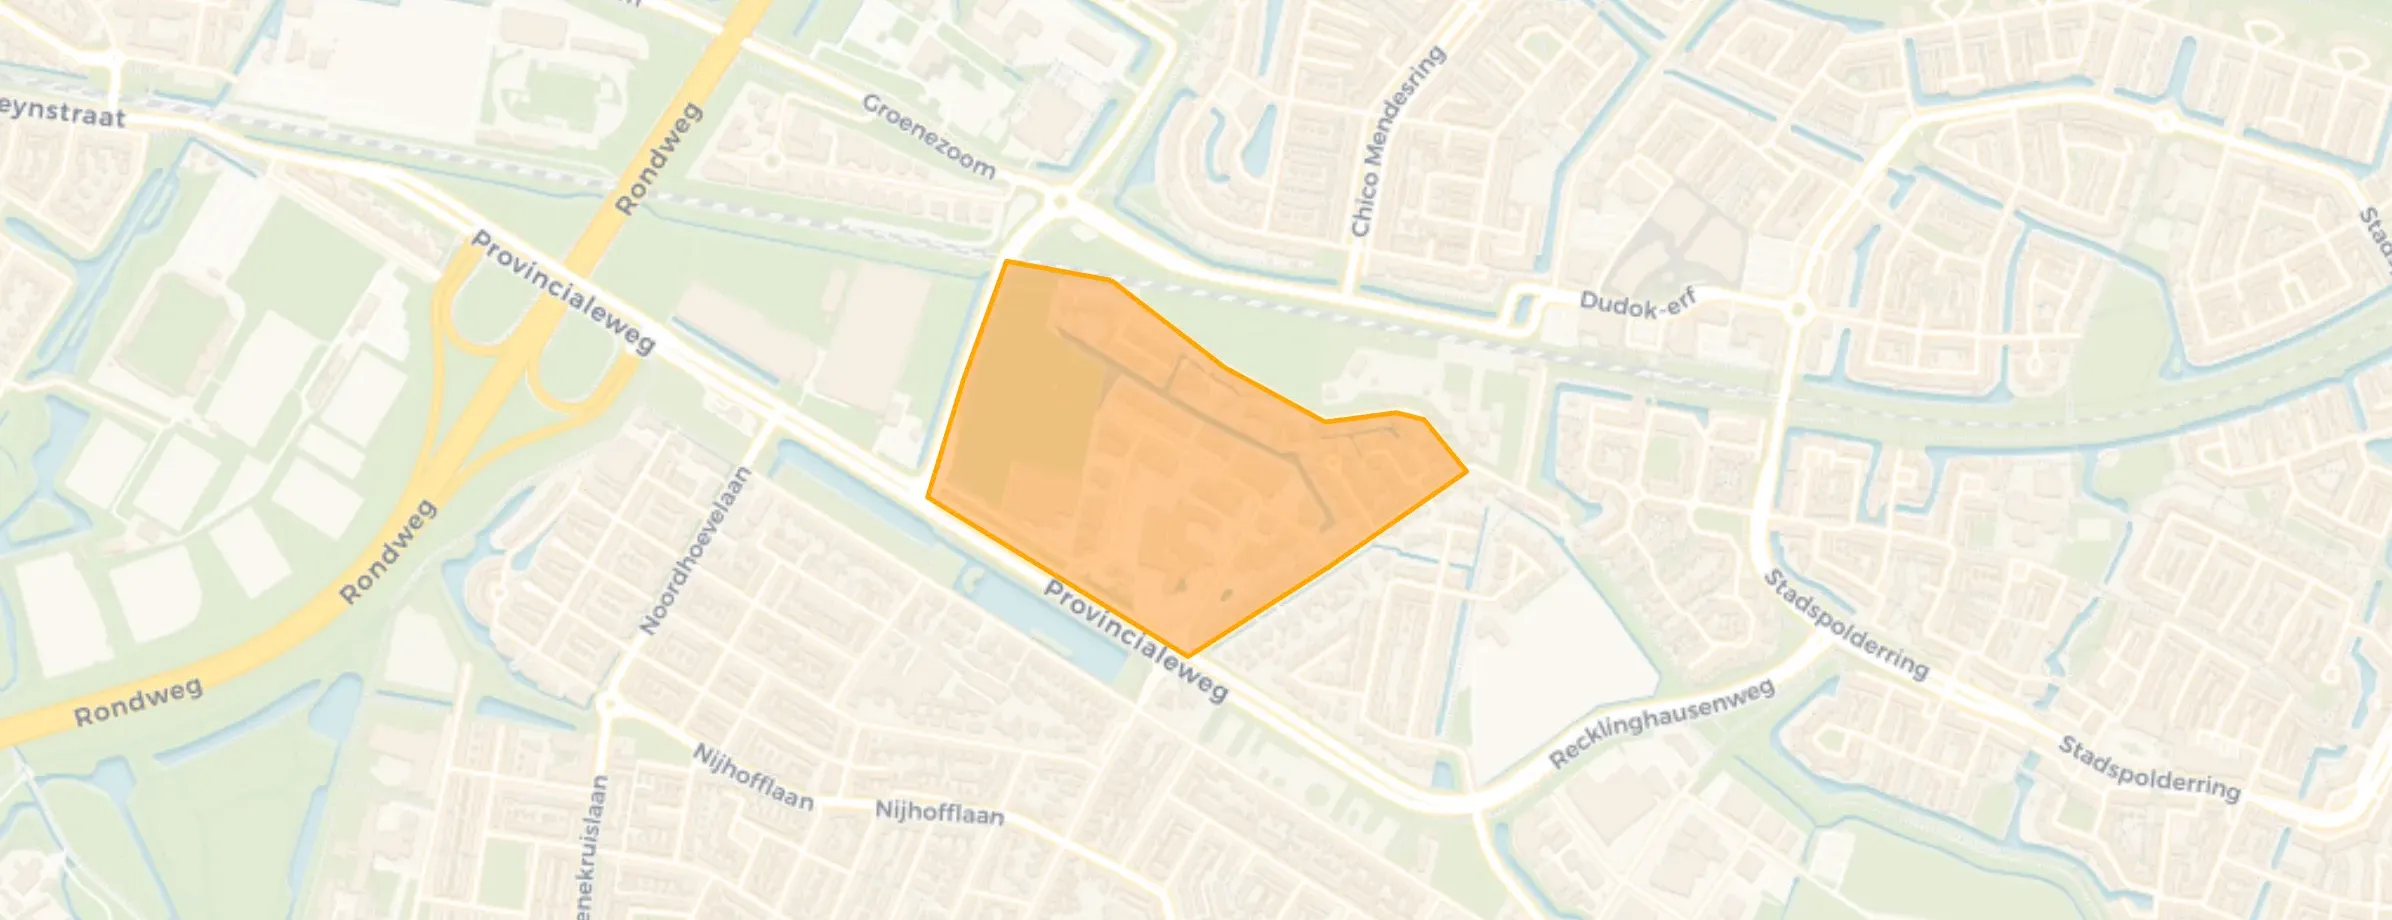
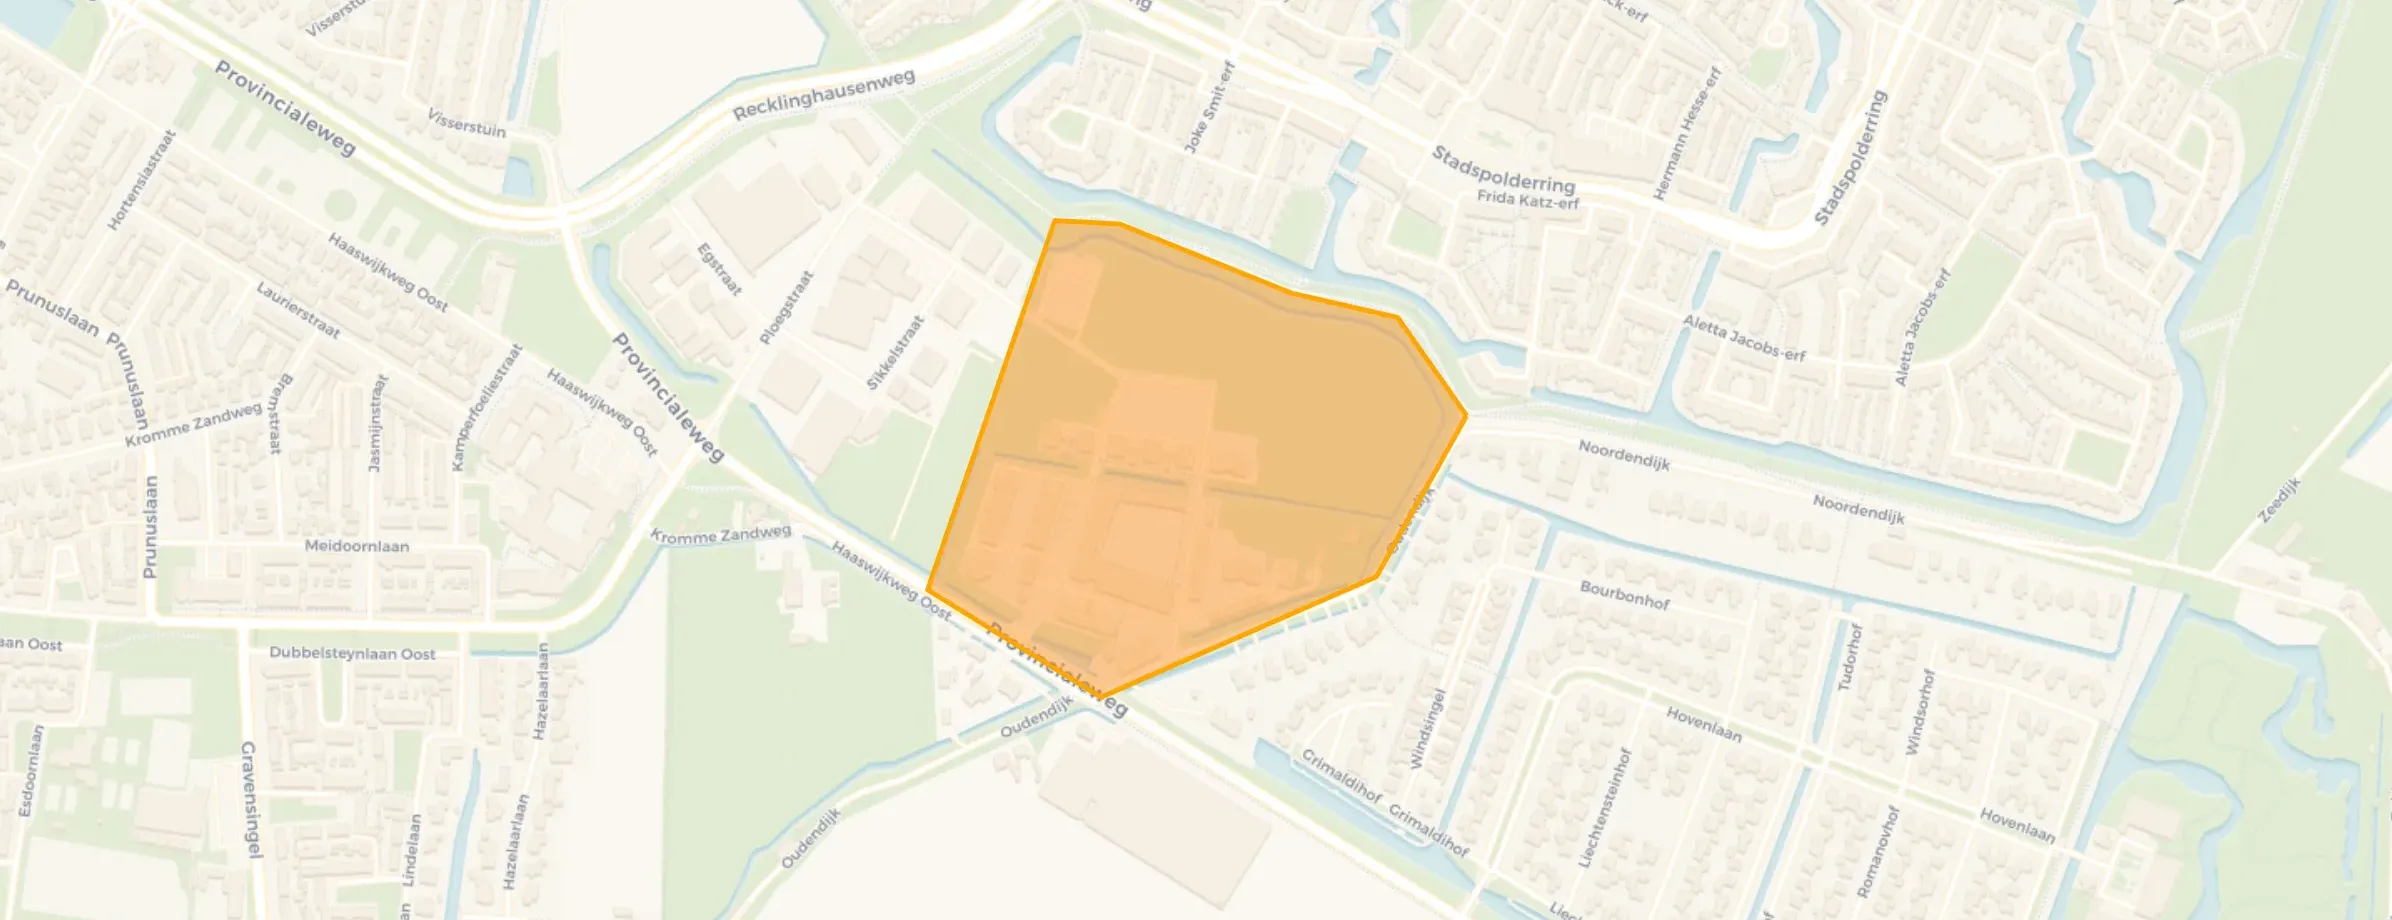
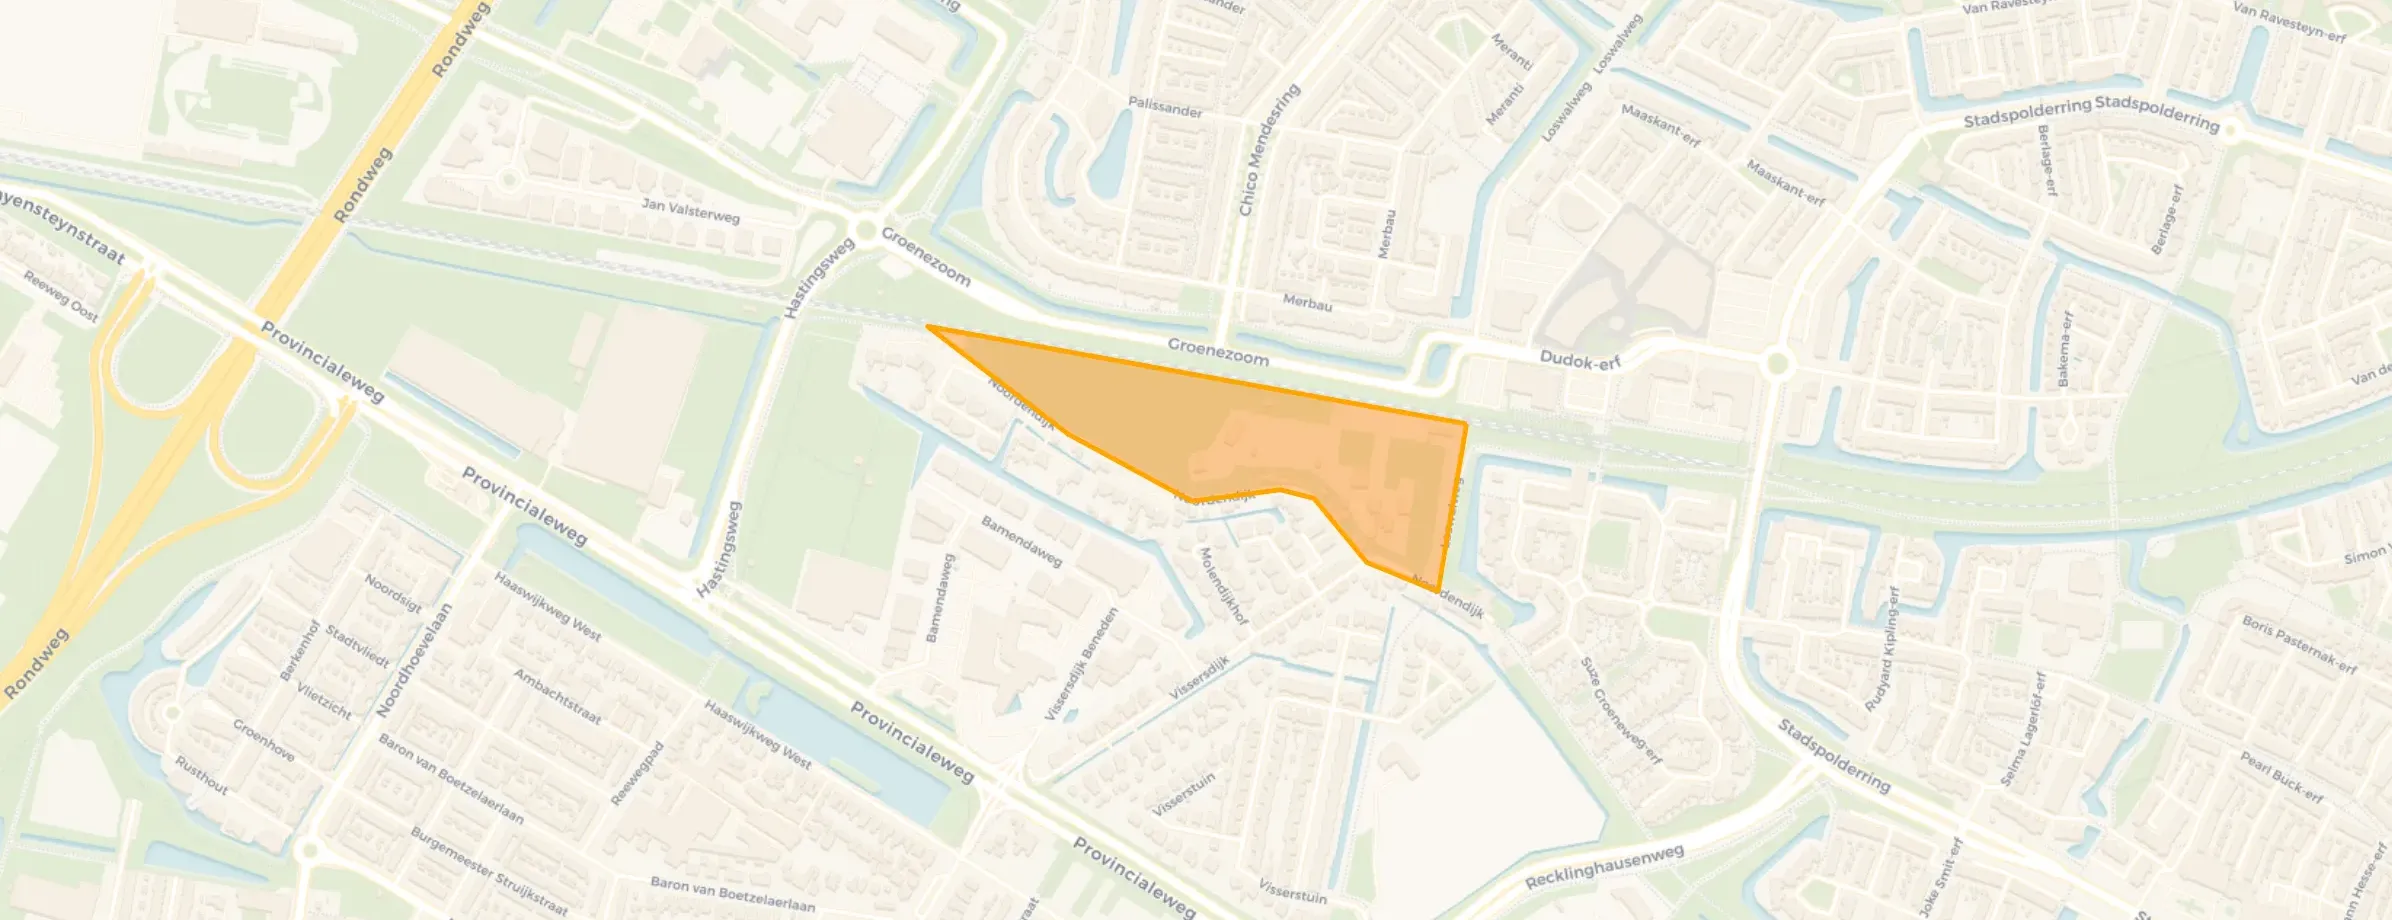
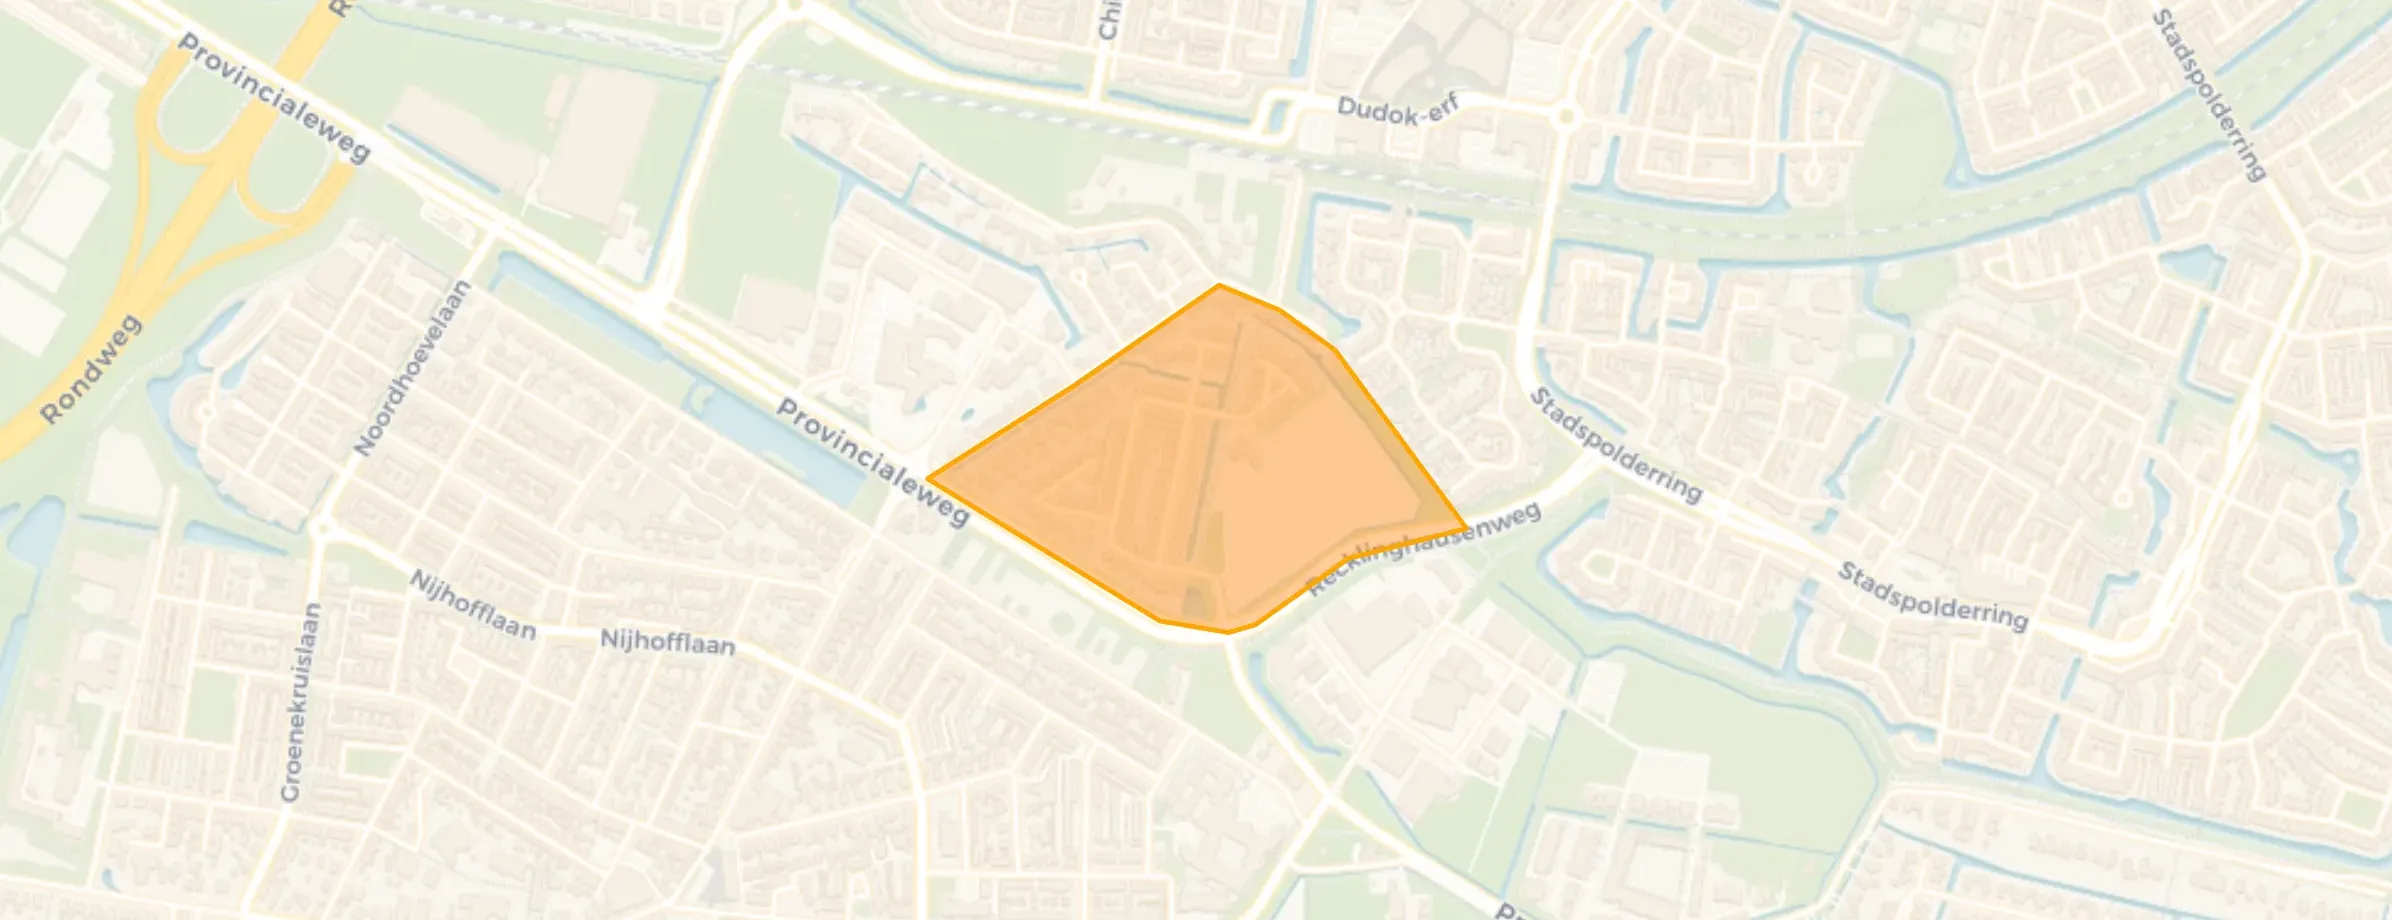
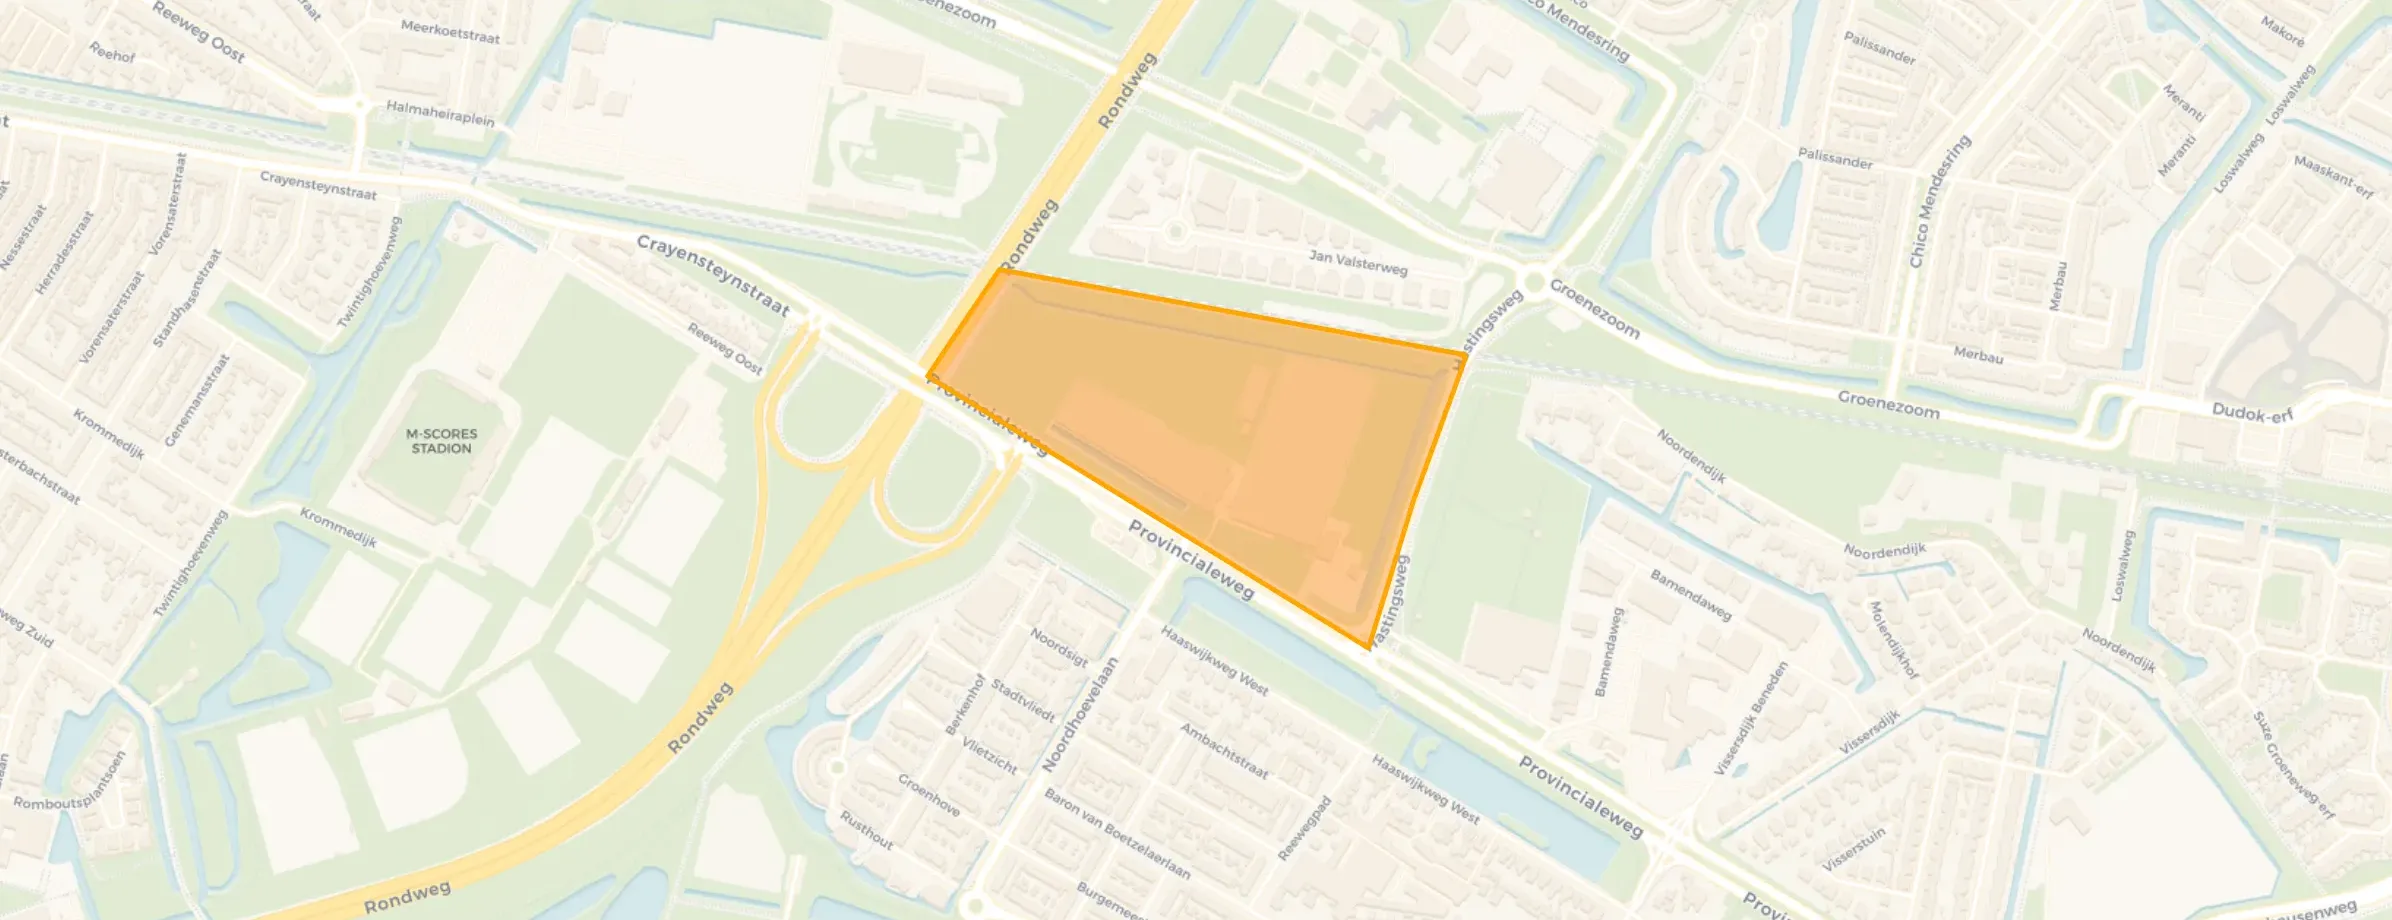
The kids can easily play at one of the 2 playgrounds. I can easily walk the dog through the park that is attached to the neighbourhood and when it freezes you can even skate around (almost) the entire neighbourhood. The access route is also perfect.
Auto-translated to English by AIGood
Auto-translated to English by AIIt doesn't really feel like a neighbourhood but more like a sort of in-between bit between Dubbeldam and Stadspolders. Some parts are scary to cycle in the dark and you have to walk at least 10 minutes to get to a bus stop from my house. A school is easy to reach and a supermarket too. There isn't an extraordinary amount of litter on the streets.
Auto-translated to English by AIEasy to use public transport, lots of bins and a large park nearby. There is also a square with supermarkets and shops. I feel safe during the day and in the evening when I'm back in my neighbourhood.
Auto-translated to English by AIThe housing stock is mainly post-war — 52% was built between 1945 and 1990.
Over the past year a home for sale in Dubbeldam was listed for an average of €645,182 (€4,586 per m²). That is 22% above the Dutch national average. Last quarter prices fell by 15%.
A rental home in Dubbeldam cost an average of €2,808 per month (€18 per m²). That is 30% above the national average.
Residents give Dubbeldam a 8.2 out of 10 based on 4 reviews. Especially safety (8.8) scores well; amenities (7.5) receives the lowest rating.
Wijk Dubbeldam has 12,850 residents. Many families: 38% of the households have children.
The housing supply in Dubbeldam is remarkably efficient: 54% has an A, A+ or B label. The average natural gas consumption per household is 900 m³ per year.
From Dubbeldam you can on average reach a supermarket at 0.9 km, a GP at 0.9 km, a railway station at 2.3 km, a primary school at 0.9 km (as the crow flies, source: CBS).
Right now you will find 39 homes for sale and 1 homes for rent in Dubbeldam.