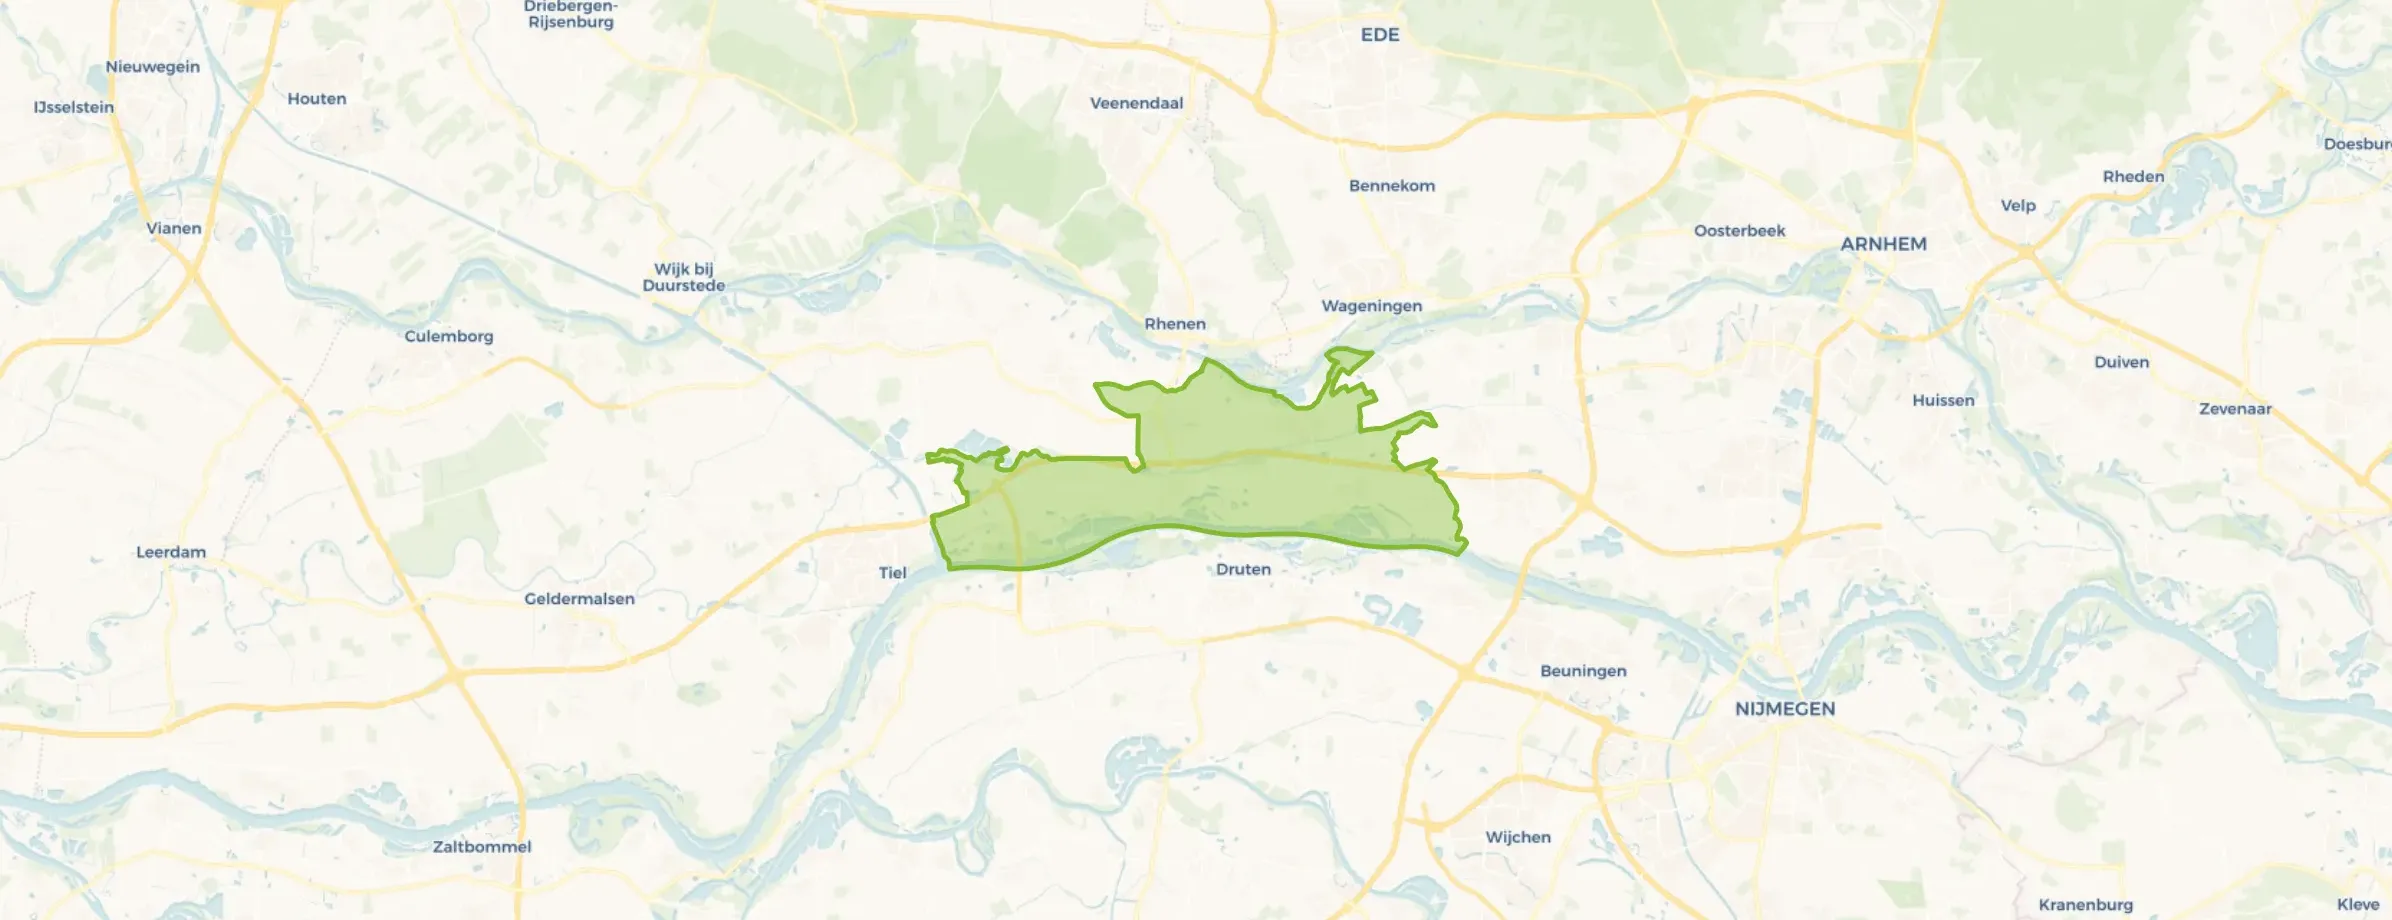
Municipality in Gelderland
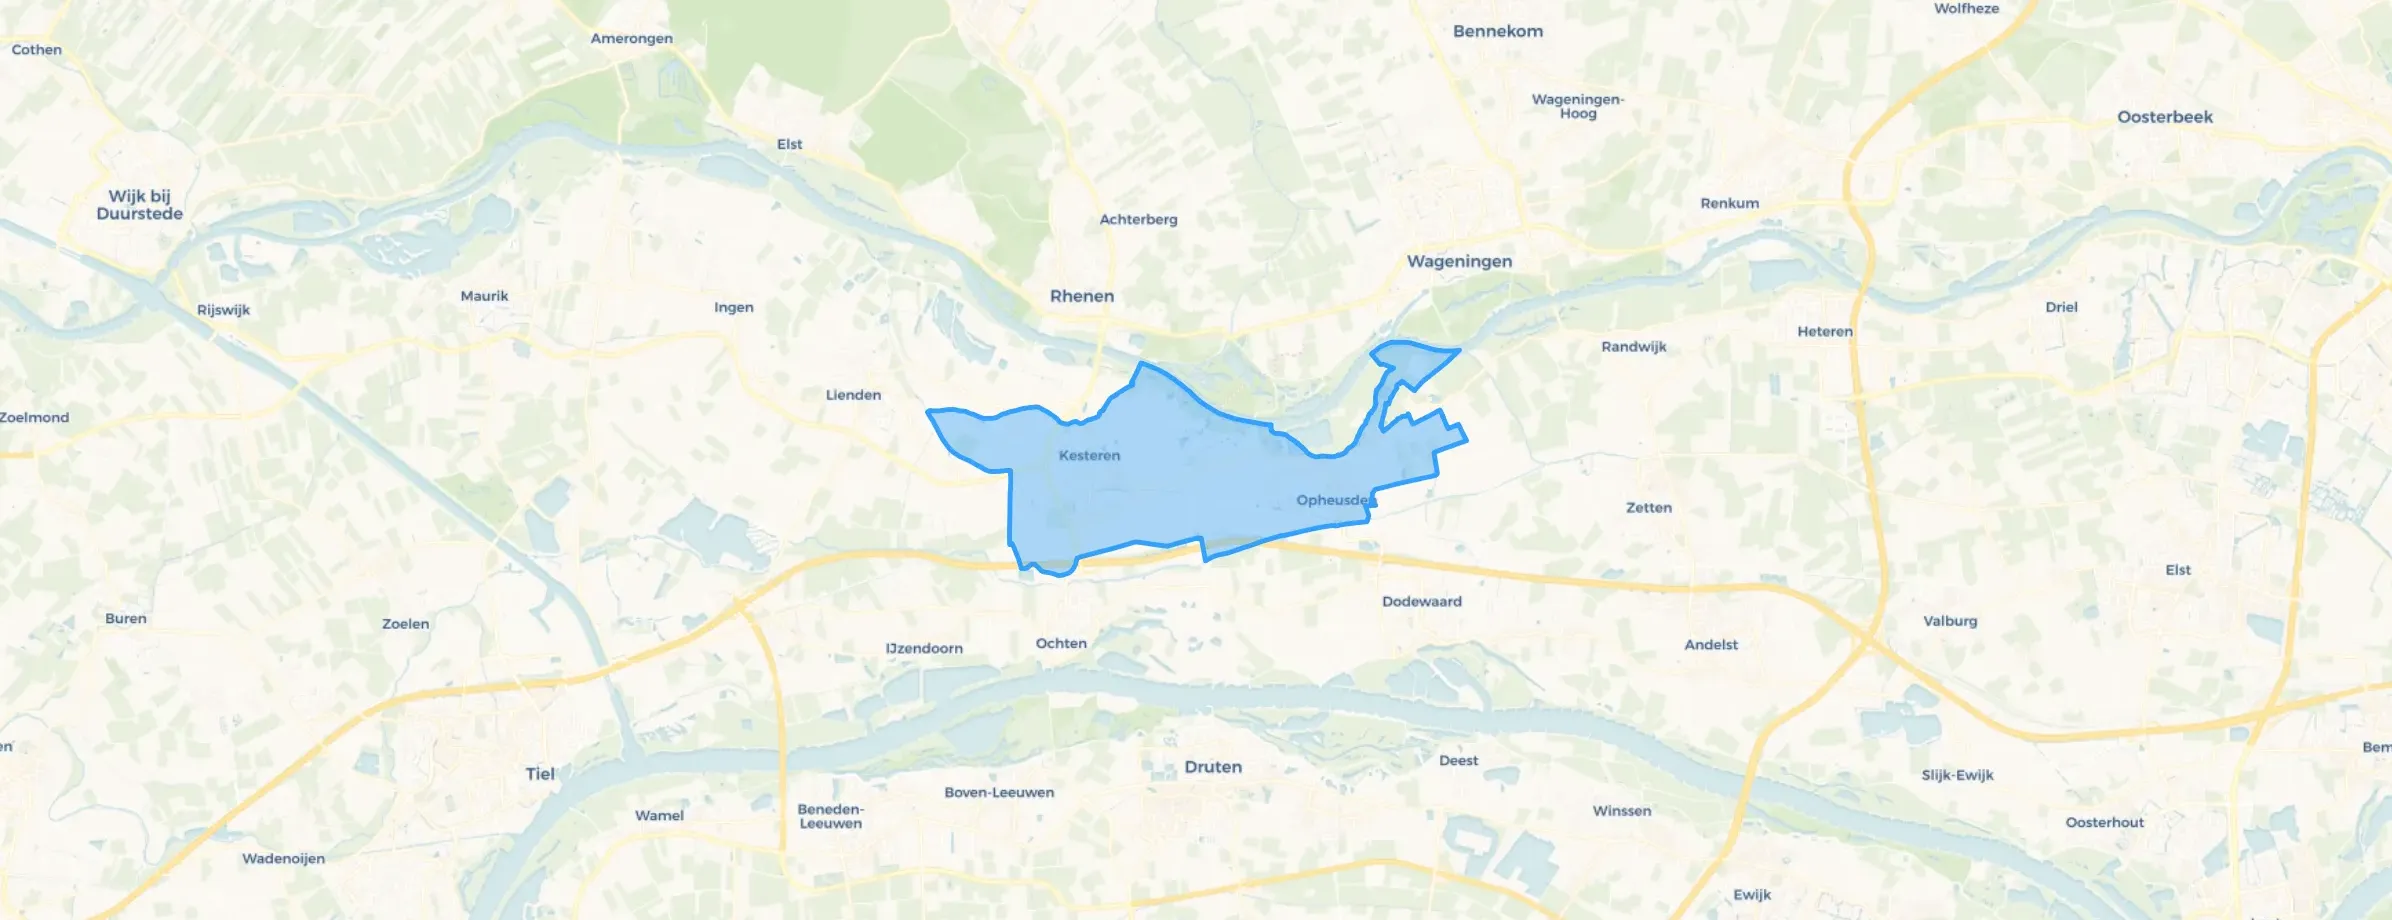
Neder-Betuwe is located in the province of Gelderland The municipality has a total area of 6.746 hectares, of which 5.999 hectares are land and 747 hectares are water. The municipality is coded as GM1740. The postcode area is 4041AA-6669WJ.
Neder-Betuwe has 25.781 residents. Of these, 50,1% are men and 49,9% are women. Most residents are 25 to 45 years (23,9%). The other age groups are 23,8% for '45 to 65 years', 21,0% for '0 to 15 years', 18,0% for '65 years or older' and 13,4% for '15 to 25 years'. Of the residents, 46,1% is unmarried, 44,8% is married, 4,8% is divorced and 4,4% is widowed. 22.992 residents originate from the Netherlands, 1.376 come from Europe and 1.413 come from countries outside Europe.
There are 9.705 households in Neder-Betuwe. 27,5% of these are single-person households, 29,9% households without children and 42,6% households with children. The average household size is 2,6 persons. The national average is 2,1 persons.
In Neder-Betuwe there are 19.700 income recipients. The average income per income recipient is €38.600, which is €3.600 (9%) lower than the national average of €42.200. Per resident, the average income is €30.100, which is €4.800 (14%) lower than the national average of €34.900. Most residents of Neder-Betuwe are educated to an intermediate level. 49,6% have an intermediate education (HAVO, VWO or MBO 2-4), 33,3% have a lower education (VMBO or MBO 1) and 17,1% have a university or higher professional education (HBO/WO).
Of the 25.781 residents, around 77% are in paid employment, which amounts to 19.851 people. This is 5% higher than the national average of 72%. The majority of workers are in salaried employment (79%), while 21% are self-employed. In Neder-Betuwe, 21% of residents receive a benefit. The largest group is those receiving a state pension (AOW). 4.130 people receive this benefit.
In Neder-Betuwe there are 9.356 homes with an average assessed value (WOZ) of €393.000. Of these, around 97% are occupied and 3% unoccupied. Most homes are owner-occupied. This amounts to 34% rental homes and 66% owner-occupied homes. Of the homes, 66% privately owned, 28% owned by housing associations and 6% owned by other landlords. The most common construction periods in Neder-Betuwe are 1950-1970 (22%) and 1970-1980 (17%).
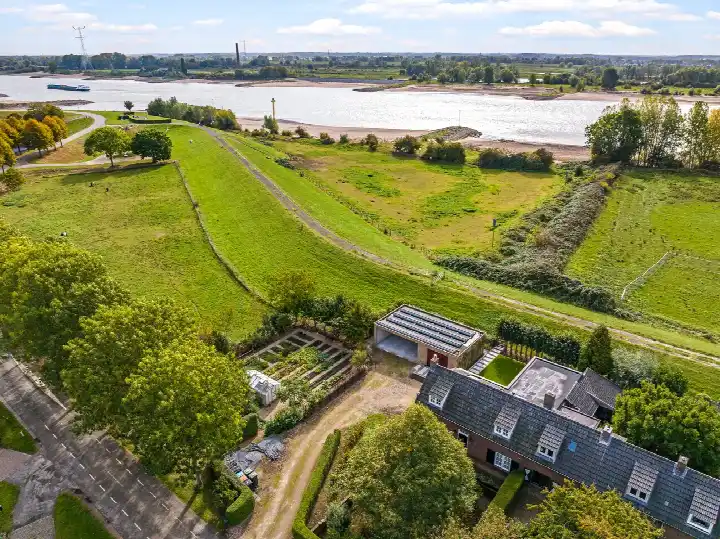
There are currently no homes for sale in Neder-Betuwe. The most recently listed home is Waalbandijk 7 by Remko Stevens Makelaardij BV op Funda. No homes were sold in Neder-Betuwe over the past year.
There are currently no homes for rent in Neder-Betuwe. The most recent home is Hoge Dijkseweg 40-2, offered by Vakantiehuistekoop.nl. No homes were let in Neder-Betuwe over the past year.
No recent rental data available for Neder-Betuwe.
In Neder-Betuwe there are 5.047 addresses with a registered energy label. The most common labels are A (33%), C (20%) and B (14%). On average, an address in Neder-Betuwe uses 3.140 kWh of electricity per year. This is 23% above the national average of 2.550 kWh. Natural gas consumption, at 990 m³ per year, is 24% above the national average of 800 m³.
Quiet neighbourhood with a beautiful orchard and a small football pitch on the street.
Auto-translated to English by AIWhen you run into neighbours, there's a greeting. They would help if needed.
Auto-translated to English by AIEveryone is out for themselves and only trying to save their own skin
Auto-translated to English by AIGood and cosy.
Auto-translated to English by AIIn the neighbourhood there is regular nuisance from people dealing drugs. Certainly not everyone is like that because Dodewaard is generally a pleasant village. Accessibility is poor as you can hardly get there by public transport unless you want to walk half an hour from the station. By car, however, you can get there fine. I myself attended the Hien (school) in Dodewaard. I thought this was a bad school because the children are not properly looked after and nasty comments were made by teachers. So unfortunately dissatisfied with the school.
Auto-translated to English by AII've lived in Malden my whole life and this is perfect, everything you need is here. And everything fun is nearby.
Auto-translated to English by AIA very social neighbourhood, everyone knows each other, many events per year are held in our neighbourhood, it's a good neighbourhood to live in.
Auto-translated to English by AIVery cosy and a nice neighbourhood
Auto-translated to English by AIOver the past year a home for sale in Neder-Betuwe was listed for an average of €579,707 (€4,122 per m²). That is 10% above the Dutch national average. Last quarter prices rose by 27%.
A rental home in Neder-Betuwe cost an average of €1,941 per month (€12 per m²). That is 10% below the national average.
Residents give Neder-Betuwe a 8.0 out of 10 based on 11 reviews. The strongest score is for nature and greenery (8.9), the weakest for amenities (7.6).
Gemeente Neder-Betuwe has 25,781 residents. Many families: 43% of the households have children.
The housing supply in Neder-Betuwe is remarkably efficient: 56% has an A, A+ or B label. The average natural gas consumption per household is 990 m³ per year.
From Neder-Betuwe you can on average reach a supermarket at 1.2 km, a GP at 1.1 km, a railway station at 2.6 km, a primary school at 0.9 km (as the crow flies, source: CBS).
Right now you will find 125 homes for sale and 1 homes for rent in Neder-Betuwe.