Neighbourhood in Veldhoven
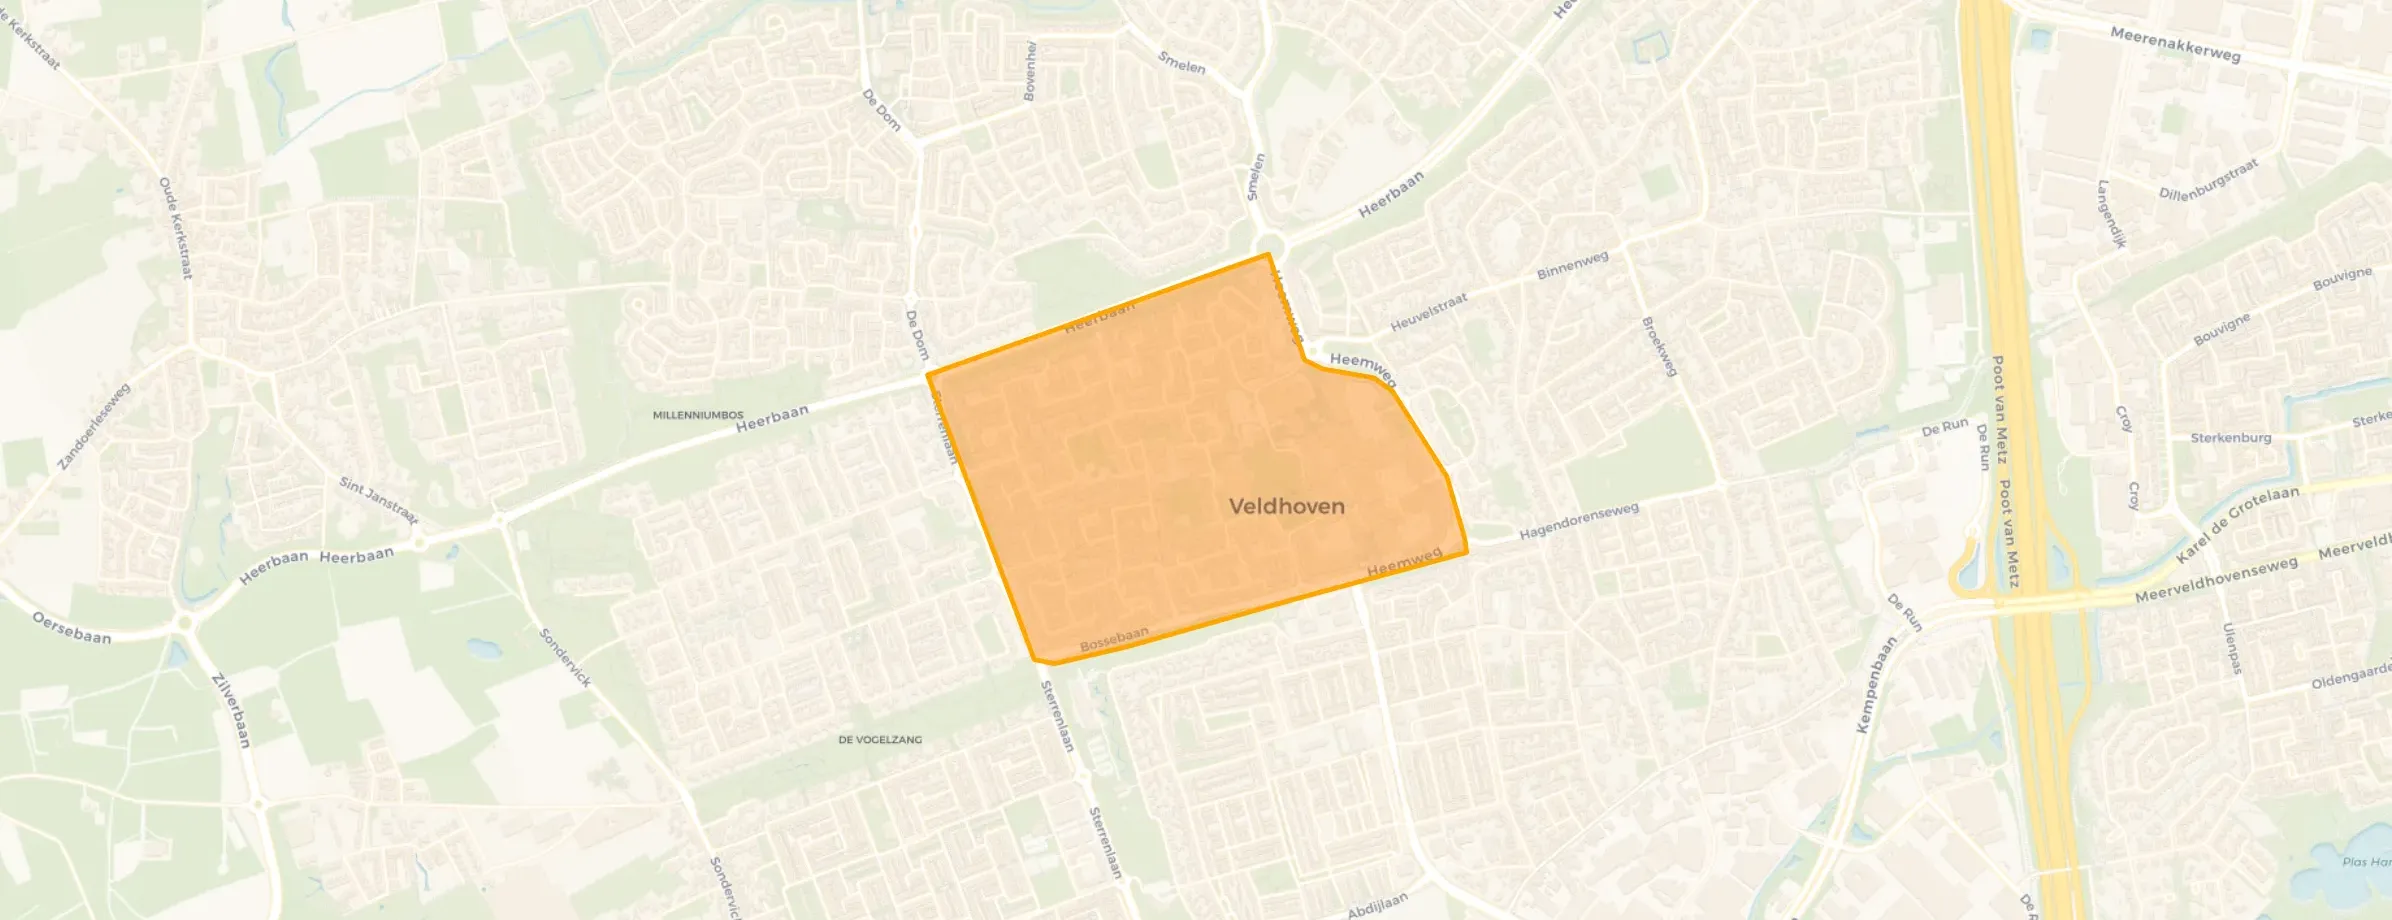
Cobbeek en Centrum is located in the province of Noord-Brabant, in the municipality of Veldhoven, in the district Veldhoven The neighbourhood has a total area of 71 hectares, of which 71 hectares are land and 0 hectares are water. The neighbourhood is coded as BU08610006. The postcode area is 5501AA-5503KB.
Three residents rate the neighbourhood as more than satisfactory with a score of 6.6. They describe it as 'Pleasant living', 'Decent neighbourhood' and 'Terrible neighbourhood'. Aspects such as education, amenities, accessibility are rated well in this neighbourhood, while housing and greenery score less well.
Cobbeek en Centrum has 4.035 residents. Of these, 51,8% are men and 48,1% are women. Most residents are 25 to 45 years (28,7%). The other age groups are 26,4% for '45 to 65 years', 23,8% for '65 years or older', 12,1% for '0 to 15 years' and 8,7% for '15 to 25 years'. Of the residents, 45,2% is unmarried, 39,5% is married, 9,8% is divorced and 5,3% is widowed. 2.670 residents originate from the Netherlands, 475 come from Europe and 885 come from countries outside Europe.
There are 2.170 households in Cobbeek en Centrum. 47,2% of these are single-person households, 29,0% households without children and 23,7% households with children. The average household size is 1,9 persons. The national average is 2,1 persons.
In Cobbeek en Centrum there are 3.400 income recipients. The average income per income recipient is €42.100, which is €100 (0%) lower than the national average of €42.200. Per resident, the average income is €36.000, which is €1.100 (3%) higher than the national average of €34.900. Most residents of Cobbeek en Centrum are educated to an intermediate level. 38,8% have an intermediate education (HAVO, VWO or MBO 2-4), 37,5% have a university or higher professional education (HBO/WO) and 23,6% have a lower education (VMBO or MBO 1).
Of the 4.035 residents, around 71% are in paid employment, which amounts to 2.865 people. This is 1% lower than the national average of 72%. The majority of workers are in salaried employment (90%), while 10% are self-employed. In Cobbeek en Centrum, 29% of residents receive a benefit. The largest group is those receiving a state pension (AOW). 870 people receive this benefit.
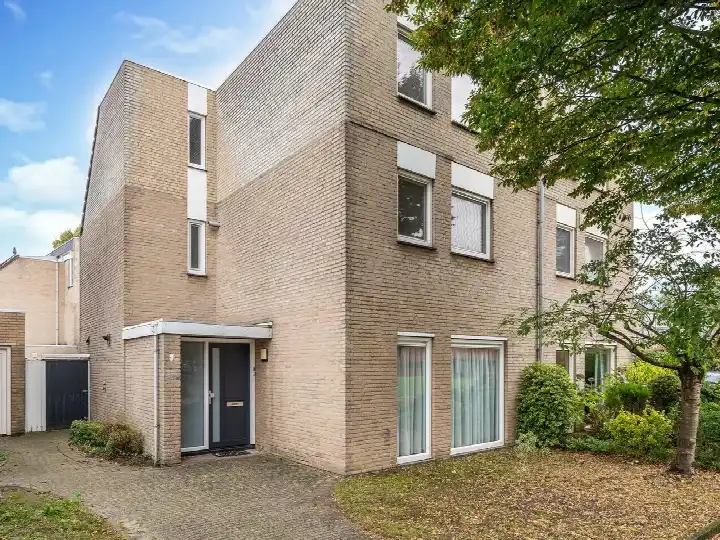
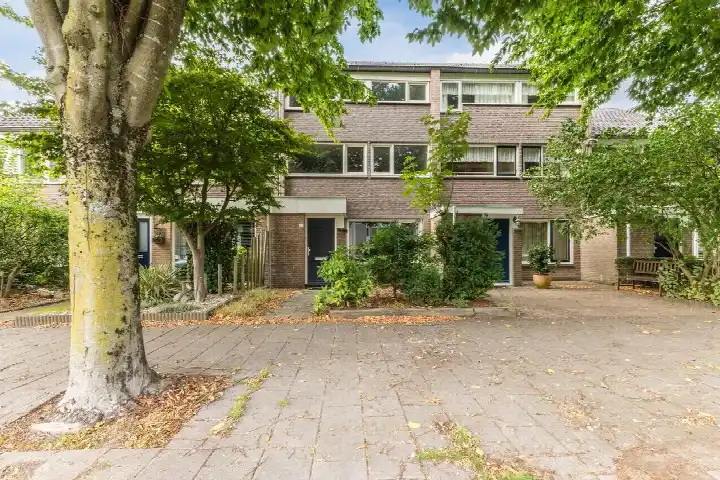
In Cobbeek en Centrum there are 2.128 homes with an average assessed value (WOZ) of €357.000. Of these, around 98% are occupied and 2% unoccupied. Most homes are owner-occupied. This amounts to 43% rental homes and 57% owner-occupied homes. Of the homes, 57% privately owned, 36% owned by housing associations and 7% owned by other landlords. The most common construction periods in Cobbeek en Centrum are 1970-1980 (73%) and 1980-1990 (22%).
There are currently 23 homes for sale in Cobbeek en Centrum. The most recently listed home is De Bussels 35 by Kennis Makelaardij op Funda. Over the past year, 118 homes were sold in Cobbeek en Centrum. On average, a home was sold within 51 days.
The average asking price for a home for sale in Cobbeek en Centrum over the past year was €457.720. This is 28% higher than the average assessed value (WOZ) of €357.000. The average asking price per m² of plot is €3.721.
There are 3 homes for rent in Cobbeek en Centrum. The most recent home is Bree 153, offered by www.wooniezie.nl. Over the past year, 42 homes were let in Cobbeek en Centrum. On average, a listing was let within 31 days.
No recent rental data available for Cobbeek en Centrum.
In Cobbeek en Centrum there are 1.489 addresses with a registered energy label. The most common labels are C (47%), A (27%) and B (18%). On average, an address in Cobbeek en Centrum uses 2.210 kWh of electricity per year. This is 13% below the national average of 2.550 kWh. With an annual consumption of 770 m³ per address, natural gas consumption is 4% below the national average of 800 m³.
It's wonderful living here. Everything is well organised, but the only problem is the cyclists and loitering youths in the centre.
Auto-translated to English by AIFine, really. Everyone is nice and friendly. Just sometimes a few strange things.
Auto-translated to English by AIHaving a mentally disturbed person living below me, I don't enjoy living here. I am constantly harassed over every little thing and she keeps ringing my doorbell. The housing association, police, and municipality know about her but do nothing. First there have to be victims before they intervene. I am already working on a house swap; I will jump for joy when I am out of here.
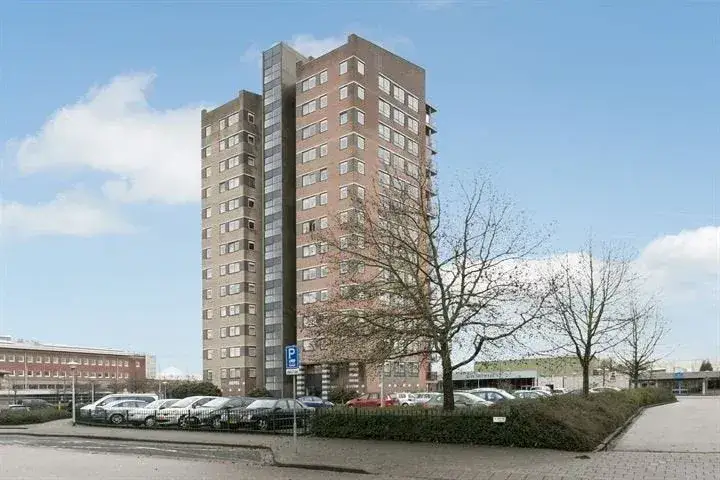
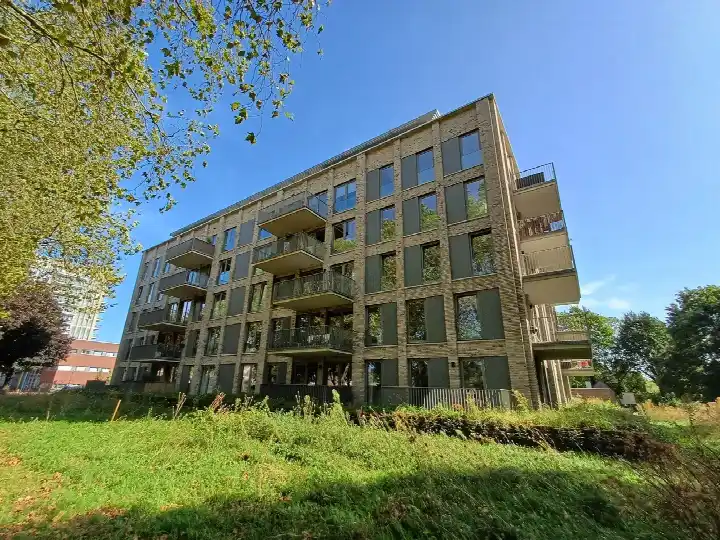
Auto-translated to English by AIThe housing stock is mainly post-war — 98% was built between 1945 and 1990. In addition, the most common type is flats (46%).
Over the past year a home for sale in Cobbeek en Centrum was listed for an average of €452,004 (€4,130 per m²). That is 14% below the Dutch national average. Last quarter prices rose by 8%.
Residents give Cobbeek en Centrum a 6.6 out of 10 based on 3 reviews. Amenities stands out with a 8.0; nature and greenery lags behind with a 5.0.
From Cobbeek en Centrum you can on average reach a supermarket at 0.7 km, a GP at 1.2 km, a railway station at 6.3 km, a primary school at 0.9 km (as the crow flies, source: CBS).
Right now you will find 22 homes for sale and 10 homes for rent in Cobbeek en Centrum.