Neighbourhood in Dordrecht
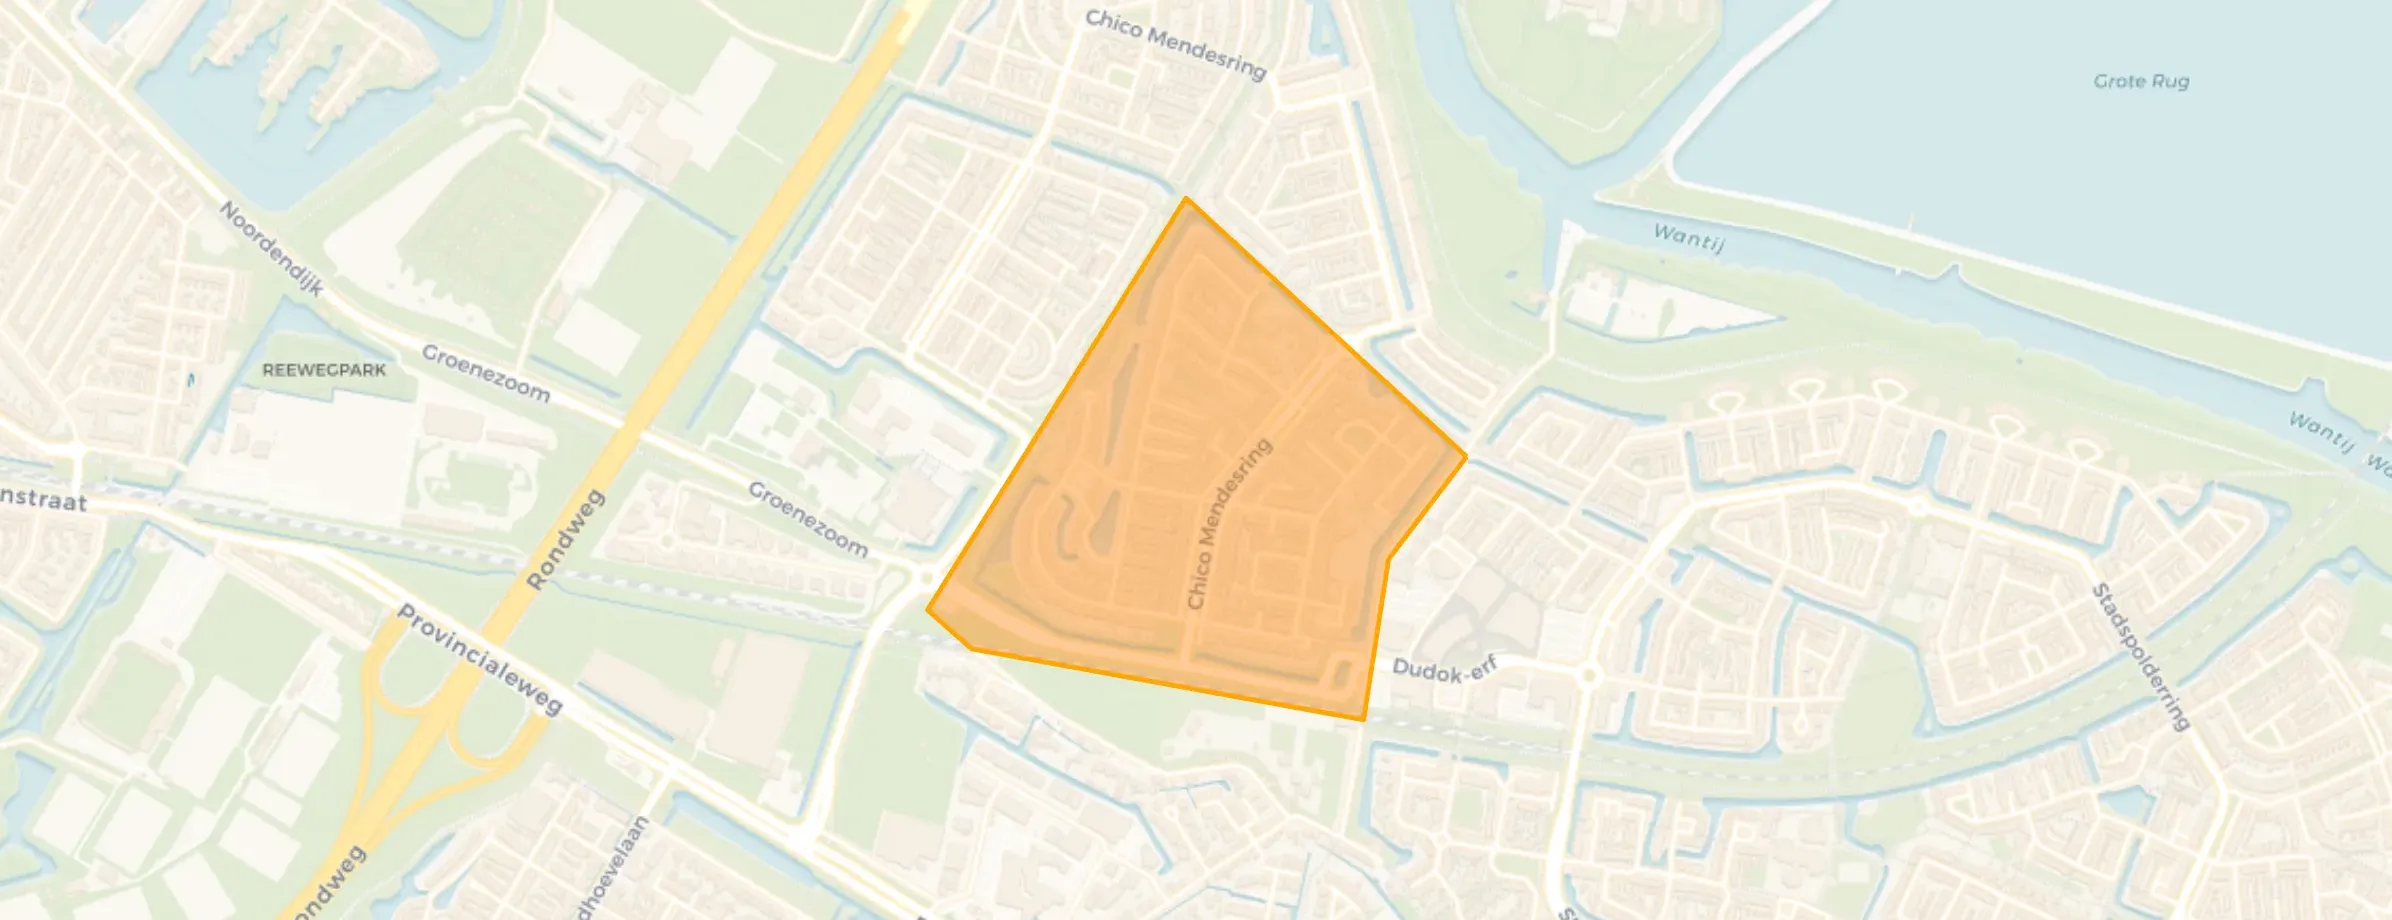
Palissander en omgeving is located in the province of Zuid-Holland, in the municipality of Dordrecht, in the district Stadspolders The neighbourhood has a total area of 30 hectares, of which 30 hectares are land and 0 hectares are water. The neighbourhood is coded as BU05051101. The postcode area is 3315MA-3315TW.
One resident rates the neighbourhood as very good with a score of 8.4. The resident describes this neighbourhood as 'Decent neighbourhood with some points to note'. Based on a limited number of reviews, no clear trends are visible yet in this neighbourhood.
Palissander en omgeving has 2.240 residents. Of these, 50,9% are men and 49,3% are women. Most residents are 45 to 65 years (34,2%). The other age groups are 22,8% for '25 to 45 years', 15,2% for '0 to 15 years', 14,1% for '15 to 25 years' and 13,8% for '65 years or older'. Of the residents, 45,1% is unmarried, 46,4% is married, 5,4% is divorced and 3,3% is widowed. 1.465 residents originate from the Netherlands, 155 come from Europe and 620 come from countries outside Europe.
There are 865 households in Palissander en omgeving. 23,1% of these are single-person households, 30,6% households without children and 46,2% households with children. The average household size is 2,6 persons. The national average is 2,1 persons.
In Palissander en omgeving there are 1.800 income recipients. The average income per income recipient is €42.100, which is €100 (0%) lower than the national average of €42.200. Per resident, the average income is €34.400, which is €500 (1%) lower than the national average of €34.900. Most residents of Palissander en omgeving are educated to an intermediate level. 44,1% have an intermediate education (HAVO, VWO or MBO 2-4), 29,6% have a lower education (VMBO or MBO 1) and 26,3% have a university or higher professional education (HBO/WO).
Of the 2.240 residents, around 77% are in paid employment, which amounts to 1.725 people. This is 5% higher than the national average of 72%. The majority of workers are in salaried employment (85%), while 15% are self-employed. In Palissander en omgeving, 20% of residents receive a benefit. The largest group is those receiving a state pension (AOW). 270 people receive this benefit.
In Palissander en omgeving there are 859 homes with an average assessed value (WOZ) of €393.000. Of these, around 99% are occupied and 1% unoccupied. Most homes are owner-occupied. This amounts to 17% rental homes and 83% owner-occupied homes. Of the homes, 82% privately owned, 13% owned by housing associations and 5% owned by other landlords. The most common construction periods in Palissander en omgeving are 1990-2000 (97%) and 2010-2020 (3%).
There are currently 4 homes for sale in Palissander en omgeving. The most recently listed home is Meranti 161 by Waltmann Makelaars Zwijndrecht. Over the past year, 57 homes were sold in Palissander en omgeving. On average, a home was sold within 45 days.
The average asking price for a home for sale in Palissander en omgeving over the past year was €515.921. This is 31% higher than the average assessed value (WOZ) of €393.000. The average asking price per m² of plot is €2.882.
There are currently no homes for rent in Palissander en omgeving. The most recent home is Mahonie 261, offered by VV Real Estate B.V. op Funda. Over the past year, 3 homes were let in Palissander en omgeving. On average, a listing was let within 31 days.
No recent rental data available for Palissander en omgeving.
In Palissander en omgeving there are 447 addresses with a registered energy label. The most common labels are B (45%), A (43%) and A+ (7%). On average, an address in Palissander en omgeving uses 2.920 kWh of electricity per year. This is 15% above the national average of 2.550 kWh. With an annual consumption of 730 m³ per address, natural gas consumption is 9% below the national average of 800 m³.
Pleasant living environment with a shopping centre within walking distance. Lots of playgrounds and plenty of greenery. With the wantij around the corner and the adjacent green strip and wantijdijk, the surroundings are beautiful. The area is easily accessible, although parking for visitors is always a bit more challenging. Charging the electric car is also hopeless, especially because many neighbours still park their petrol cars at charging points. An additional drawback in terms of accessibility is the limited number of access roads, which can make it difficult to get off the estate when there is occasional freight traffic. Moreover, the access roads into the area are extremely busy during rush hour. There is often litter in the playgrounds and fields, mainly due to loitering youths. In addition, many scooters drive very fast on the cycle paths and the loswalweg. On that latter road, cars also regularly drive very fast with loud music. Most houses would benefit from a fresh coat of paint or a pressure wash of the facade. They are not the greatest architectural masterpieces anyway, but the street scene is deteriorating further because of this. Neighbours are generally friendly, although you really only have contact with the neighbours in your immediate vicinity.
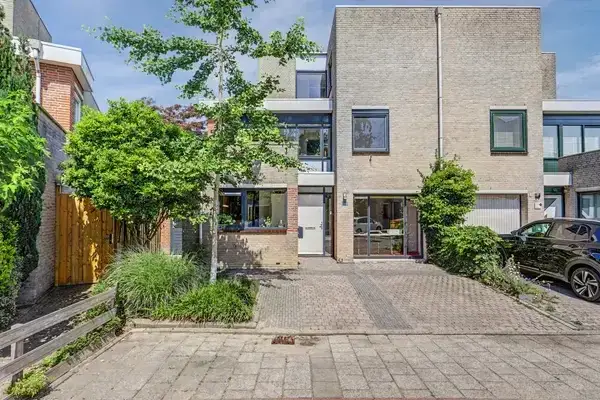
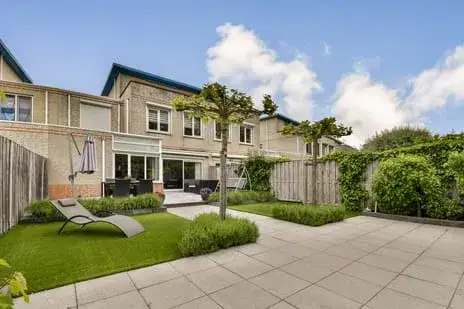
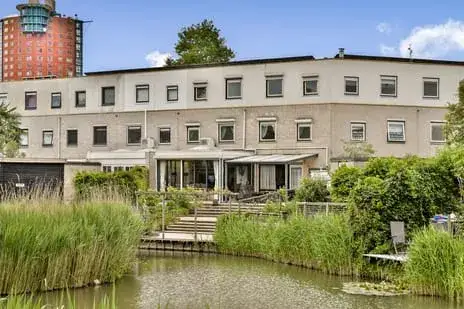
Auto-translated to English by AIThe housing stock is relatively young — 100% dates from after 1990. In addition, the most common type is terraced houses (65%).
Over the past year a home for sale in Palissander en omgeving was listed for an average of €511,840 (€3,816 per m²).
Buurt Palissander en omgeving has 2,240 residents. The largest age group is 45 to 65 years (34%). Many families: 46% of the households have children.
The housing supply in Palissander en omgeving is remarkably efficient: 94% has an A, A+ or B label. The average natural gas consumption per household is 730 m³ per year.
From Palissander en omgeving you can on average reach a supermarket at 0.8 km, a GP at 0.9 km, a railway station at 0.9 km, a primary school at 0.4 km (as the crow flies, source: CBS).