Give feedback Report a problem
Neighbourhood in Son en BreugelSon
8.4
Residents give Son a very good ratingThis score is based on 3 responses
View
Son has 5,400 residentsMost are 65 years or older old
There are 2,617 homes in SonCurrently there are 31 for sale and 0 for rent
Energy label A is the most common in SonBased on registered homes

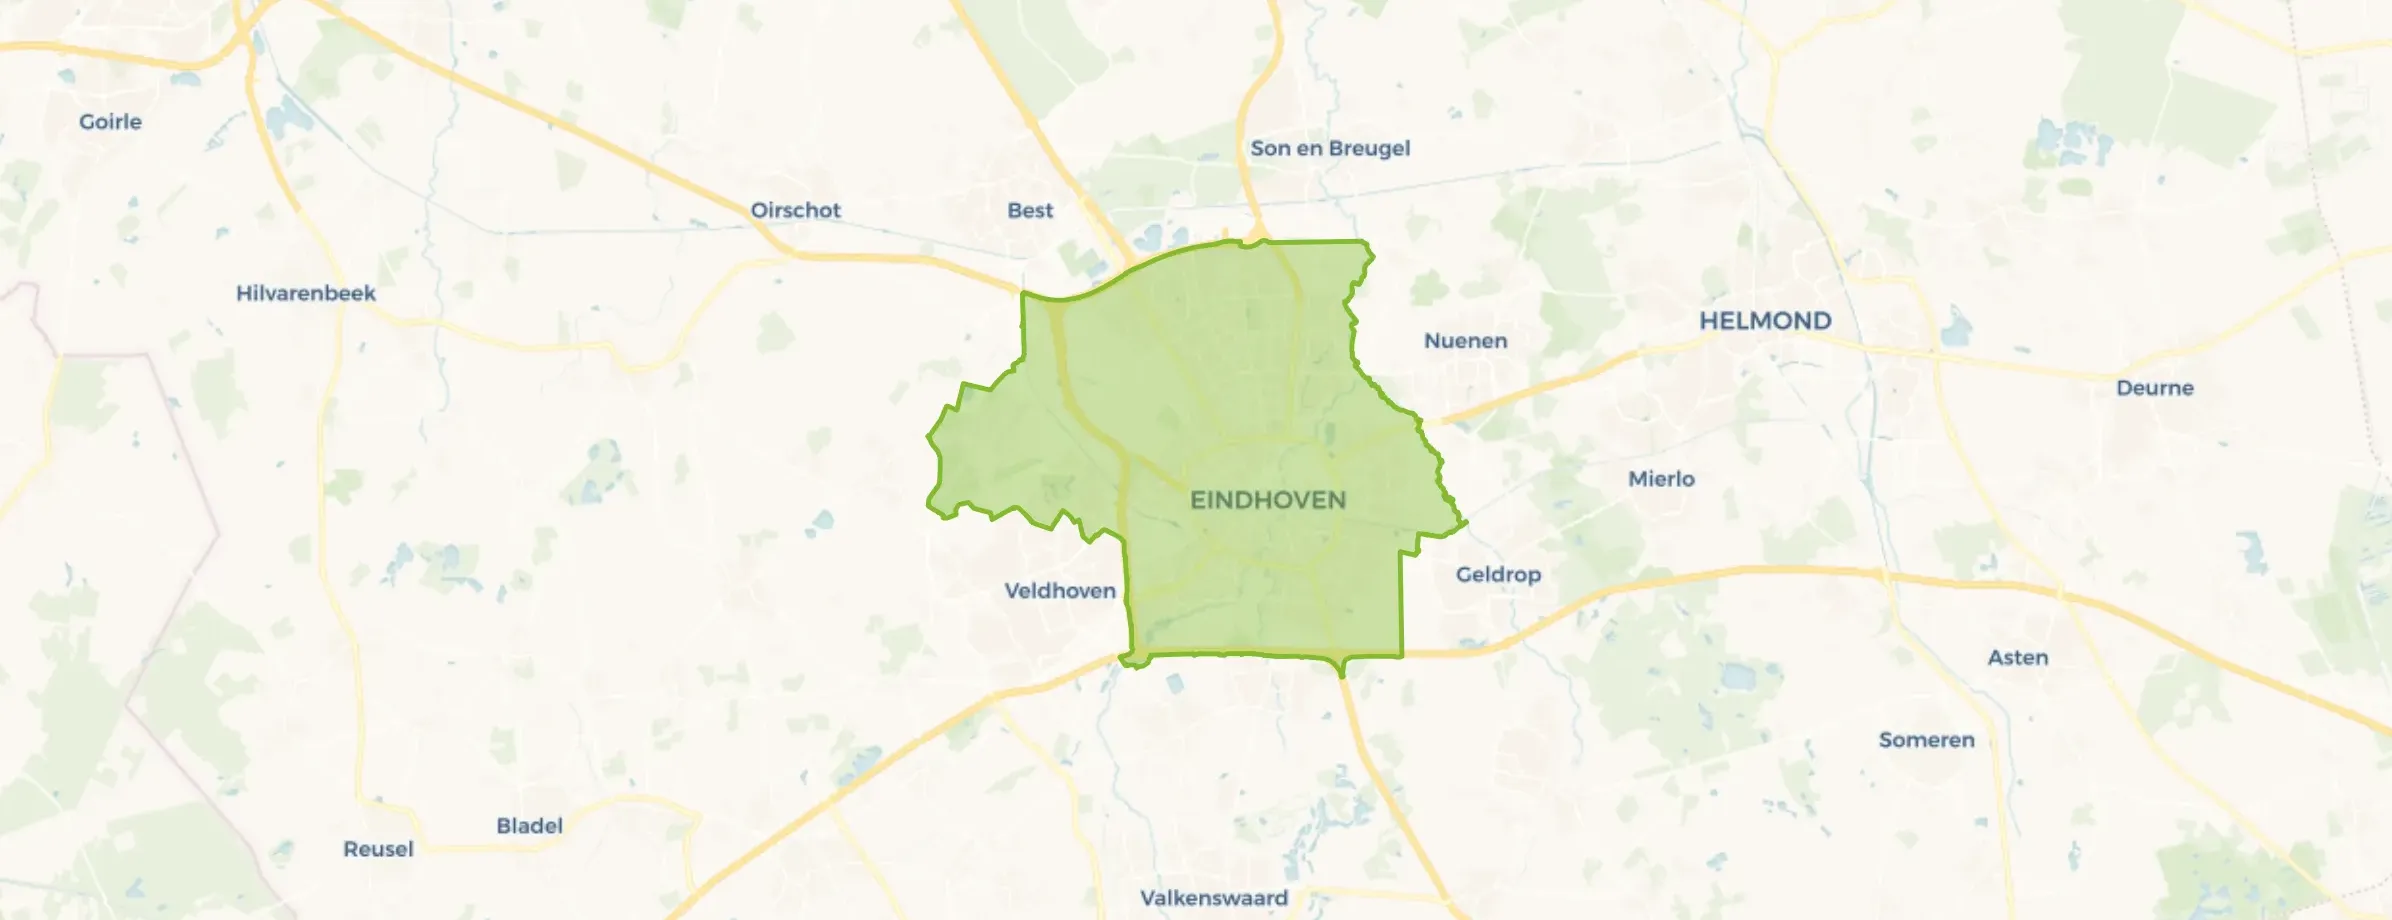
Son is located in the province of Noord-Brabant, in the municipality of Son en Breugel, in the district Son. The neighbourhood has a total area of 277 hectares, of which 271 hectares are land and 6 hectares are water. The neighbourhood is coded as BU08480000. The postcode area is 5691AA-5691ZC.

Three residents rate the neighbourhood as very good with a score of 8.4. They describe it as 'Nice neighbourhood to live in', 'A naturally friendly neighbourhood' and 'Lively little village'. Residents are positive about the neighbourhood: nearly all aspects score well. In particular, greenery, cleanliness, accessibility are seen as strong points.

Residents

Son has 5.400 residents. Of these, 49,0% are men and 51,1% are women. Most residents are 65 years or older (34,3%). The other age groups are 27,4% for '45 to 65 years', 17,8% for '25 to 45 years', 10,6% for '0 to 15 years' and 10,1% for '15 to 25 years'. Of the residents, 40,6% is unmarried, 41,5% is married, 7,9% is divorced and 10,2% is widowed. 4.375 residents originate from the Netherlands, 495 come from Europe and 535 come from countries outside Europe.

There are 2.555 households in Son. 39,7% of these are single-person households, 34,2% households without children and 26,0% households with children. The average household size is 2,0 persons. The national average is 2,1 persons.

In Son there are 4.400 income recipients. The average income per income recipient is €46.300, which is €4.100 (10%) higher than the national average of €42.200. Per resident, the average income is €40.500, which is €5.600 (16%) higher than the national average of €34.900. Most residents of Son are educated to an intermediate level. 39,9% have an intermediate education (HAVO, VWO or MBO 2-4), 38,3% have a university or higher professional education (HBO/WO) and 21,7% have a lower education (VMBO or MBO 1).

Of the 5.400 residents, around 73% are in paid employment, which amounts to 3.942 people. This is 1% higher than the national average of 72%. The majority of workers are in salaried employment (80%), while 20% are self-employed. In Son, 39% of residents receive a benefit. The largest group is those receiving a state pension (AOW). 1.710 people receive this benefit.

Housing

In Son there are 2.617 homes with an average assessed value (WOZ) of €532.000. Of these, around 96% are occupied and 4% unoccupied. Most homes are owner-occupied. This amounts to 37% rental homes and 63% owner-occupied homes. Of the homes, 62% privately owned, 22% owned by housing associations and 16% owned by other landlords. The most common construction periods in Son are 1950-1970 (50%) and 2010-2020 (11%).

Homes for sale in Son

There are currently 31 homes for sale in Son. The most recently listed home is Hermelijnlaan 5 by Sol Makelaardij op Funda. Over the past year, 56 homes were sold in Son. On average, a home was sold within 38 days.

The average asking price for a home for sale in Son over the past year was €843.732. This is 59% higher than the average assessed value (WOZ) of €532.000. The average asking price per m² of floor area is €4.793.

Rental homes in Son

There are currently no homes for rent in Son. The most recent home is Lupinelaan 45, offered by www.wooniezie.nl. Over the past year, 2 homes were let in Son. On average, a listing was let within 7 days.

The average rent for a rental home in Son over the past year was €1.113 per month. Per m² of floor area that is €9 per month.

Energy

In Son there are 1.737 addresses with a registered energy label. The most common labels are A (33%), B (19%) and C (17%). On average, an address in Son uses 2.860 kWh of electricity per year. This is 12% above the national average of 2.550 kWh. Natural gas consumption, at 1.020 m³ per year, is 28% above the national average of 800 m³.

Street names

  • Dresdenlaan
  • Gentiaanlaan
  • Gorterstraat
  • Hendrik Veenemanstraat
  • Zweerslaan
  • Ranonkelstraat
  • Raadhuisplein
  • Vondelstraat
  • Anemoonstraat
  • Breeakkerstraat
  • Kanaaldijk Zuid
  • Potgieterstraat
  • Elandlaan
  • Marijkestraat
  • Nieuwstraat
  • Reelaan
  • Daslaan
  • Wezellaan
  • Leeuweriklaan
  • Koekoeklaan
  • Europalaan
  • Kanaalstraat
  • Azaleastraat
  • Meeslaan
  • Witsenstraat
  • Eindhovenseweg
  • Vermeerstraat
  • Esdoornstraat
  • Tollensstraat
  • Stokroosstraat
  • Wim Stasplein
  • Winterkoninglaan
  • van Schendelstraat
  • Cameliastraat
  • Röntgenlaan
  • Hermelijnlaan
  • Tijgerlaan
  • Nachtegaallaan
  • Larikslaan
  • Eekhoornlaan
  • Geuzenberg
  • Schietbaan
  • Beekstraat
  • van Looijstraat
  • Taylorstraat
  • Narcisstraat
  • Rubensstraat
  • Meldelaan
  • Obrechtlaan
  • Ekkersrijt
  • Lavendelstraat
  • Antoon van de Venstraat
  • Jacob Marisstraat
  • Dommelpas
  • Merellaan
  • Hoogenberg
  • Buntlaan
  • Edelweissstraat
  • Vinklaan
  • Fonteinberg
  • Ruysdaelstraat
  • Emmastraat
  • Kloosterstraat
  • Varenlaan
  • Parklaan
  • Lijsterlaan
  • Staringstraat
  • de Bazelstraat
  • Zwaluwlaan
  • Lupinelaan
  • Potjesberg
  • Zonhove Brink
  • Rembrandtstraat
  • Asterstraat
  • Molenstraat
  • Diepenbrocklaan
  • Burgemeester Steinweghof
  • Breitnerstraat
  • Paulus Potterstraat
  • Wilhelminalaan
  • Crocusstraat
  • Dopperlaan
  • Prunuslaan
  • Wagenaarlaan
  • Muizenberg
  • Dahliastraat
  • van Goghstraat
  • Lamalaan
  • Doctor Berlagelaan
  • Korenbloemlaan
  • Kerkepad
  • Poemalaan
  • de Klerkstraat
  • Schoolstraat
  • Krophollerstraat
  • Markt
  • Lindenstraat
  • Klaprooslaan
  • Mesdagstraat
  • Pijperlaan
  • Van Anrooylaan
  • Bisonlaan
  • Boslaan
  • Otterlaan
  • Bremlaan
  • Dudokstraat
  • Sijslaan
  • Trekkersveld
  • Weidelaan
  • Plesmanlaan
  • Leeuwenbeklaan
  • Kloosstraat
  • Driehoek
  • Oranjestraat
  • de Bontstraat
  • Vijverlaan
  • Duinlaan
  • Sweelincklaan
  • Margrietstraat
  • Nassaustraat
  • Kanaaldijk Noord
  • Spireastraat
  • Frans Halsstraat
  • Beverlaan
  • Begoniastraat
  • van Lennepstraat
  • Torenstraat
  • Kerkplein
  • Panterlaan
  • Marterlaan
  • Bestseweg
  • Bernhardstraat
  • Hertlaan
  • Kerkstraat
  • Beatrixstraat
  • Perkstraat
  • Wielewaallaan
  • Willemstraat
  • van Goyenstraat
  • Brederodestraat
  • Hoefbladlaan
  • Couperusstraat
  • Berkenlaan
  • Heijermansstraat
  • Karekietlaan
  • Hulstlaan
  • Bilderdijkstraat
  • Rietlaan
  • Tooropstraat
  • Putterlaan
  • Heistraat
  • Ganzebloemlaan
  • Buitenbrink
  • Hoplaan
  • Airbornestraat
  • Zandstraat
  • Tulpstraat
  • Heriklaan
  • Sparrenlaan
  • van Eedenstraat
  • Jasmijnstraat
  • Julianastraat
  • Dommelstraat
  • Huygensstraat
  • 17 Septemberplein
  • Irenestraat
  • Veerstraat
  • Beetsstraat

Amenities

GP
0,7 km
Pharmacy
0,8 km
Hospital
7,0 km
Supermarket
0,5 km
Railway station
8,1 km
Day nursery
0,7 km
Primary school
0,7 km
Secondary school
4,0 km
Rate Son

Share your opinion and help improve the neighbourhood.

  • Takes less than 2 minutes
  • Help home seekers
  • Improve your neighbourhood
Write a review
8.4
Residents give Son a very good rating
This score is based on 3 responses
Join the conversation
Safety
Housing
Cleanliness
Amenities
Education
Community
Greenery
Accessibility

Experiences of Son

Join the conversation
9.8
A. Gerrits
Family · Terraced house
10-09-2025
Nice neighbourhood to live in

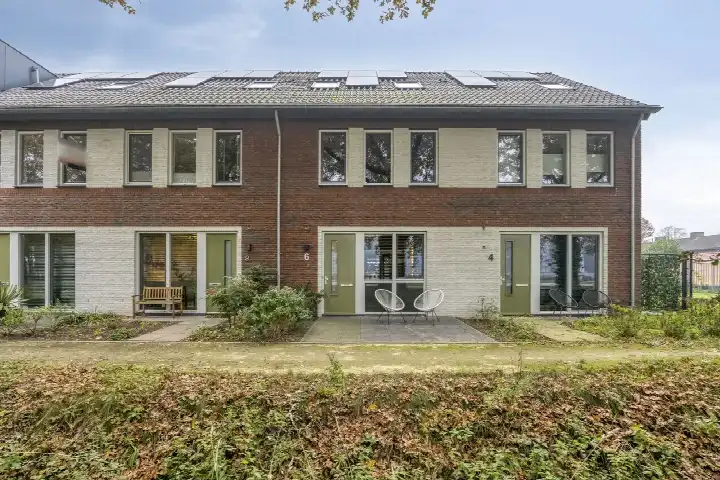
Close to the deer park and a nice piece of forest. Ideal for dog owners because it's an off-leash area. Several schools and shops in the area, bus connection nearby.

Auto-translated to English by AI
7.5
PvD
Family · Terraced house
05-04-2025
A naturally friendly neighbourhood

I have a very nice neighbourhood with a cosy family, the people around me in the neighbourhood are also nice. There is good education, just no secondary school, because it is a village.

Auto-translated to English by AI
8.0
F. Hendriks
Family · Semi-detached
02-06-2024
Lively little village

I've lived in this little village my whole life. There's plenty to do: petting zoos, restaurants, breweries, sports and hobby spaces, and many events are organized. Also, almost everyone knows each other within the village.

Auto-translated to English by AI

Statistics about the residents

Ages

Residents per age category

Household composition

Households per category
1,015Single-person households
875Households without children
665Households with children

Gender

Residents by gender
Men
Women

Marital status

Residents by marital status
Married
Unmarried
Divorced
Widowed

Origin

Residents per category of origin
Netherlands
Europe
Outside Europe

Work & income

Labour participation and average income
€40,500 P.A.average per resident16% above the national average
€46,300 P.A.average per income recipient10% above the national average
80%of the employed are in paid employment
20%of the employed are self-employed
73%
of the residents are employed
72%
is the national average

Education level

Residents per education level
VMBO, MBO 1
HAVO/VWO, MBO 2-4
HBO/WO

Wealth

Median wealth per household
Son
Netherlands

Benefits

Residents per benefit type
Social assistance
Disability
Unemployment

Housing market in Son

Sale price · Q4 2026
€1.133.409
average▲ 23,1%
€628.500
median▲ 4,3%
11 sales · vs. Q3 2026
€/m² for sale · Q4 2026
€5.200
average▲ 9,2%
€5.078
median▲ 12,4%
+62% vs. national average

Sales market

Market speed and dynamics, last 12 months
38 days ▼ 54,6%
average time listed · vs. last year
56
sales in the past year
178 m²
average living area
+62%
more expensive than the national average

Year built

Age of the housing stock

Energy labels

Sustainability of the housing stock

Living area

Distribution of home sizes

Statistics about the homes

Home types

Addresses per home type

Construction periods

Addresses per construction period

Labels

Addresses per energy label

Energy consumption

Average per address, compared with the Netherlands
Natural gas (m³)
Son
1.020
Netherlands
800
Electricity (kWh)
Son
2.860
Netherlands
2.550

Frequently asked questions about Son

What kind of houses make up Son?

The housing stock is mainly post-war — 60% was built between 1945 and 1990.

What is the average asking price in Son?

Over the past year a home for sale in Son was listed for an average of €843,732 (€4,793 per m²). That is 62% above the Dutch national average. Last quarter prices rose by 23%.

How does Son score on liveability?

Residents give Son a 8.4 out of 10 based on 3 reviews. Especially cleanliness (9.3) scores well; amenities (7.3) receives the lowest rating.

Who lives in Son?

Buurt Son has 5,400 residents. The largest age group is 65+ years (34%).

How sustainable is the housing supply in Son?

The housing supply in Son is remarkably efficient: 61% has an A, A+ or B label. The average natural gas consumption per household is 1,020 m³ per year.

Which amenities are close to Son?

From Son you can on average reach a supermarket at 0.5 km, a GP at 0.7 km, a railway station at 8.1 km, a primary school at 0.7 km (as the crow flies, source: CBS).

What is the current housing supply in Son?

Right now you will find 31 homes for sale in Son.

Homes Rate your neighbourhood
Buurtje.nl
Buurtje.nl in the appSearch faster and respond first
Open