Neighbourhood in Utrecht
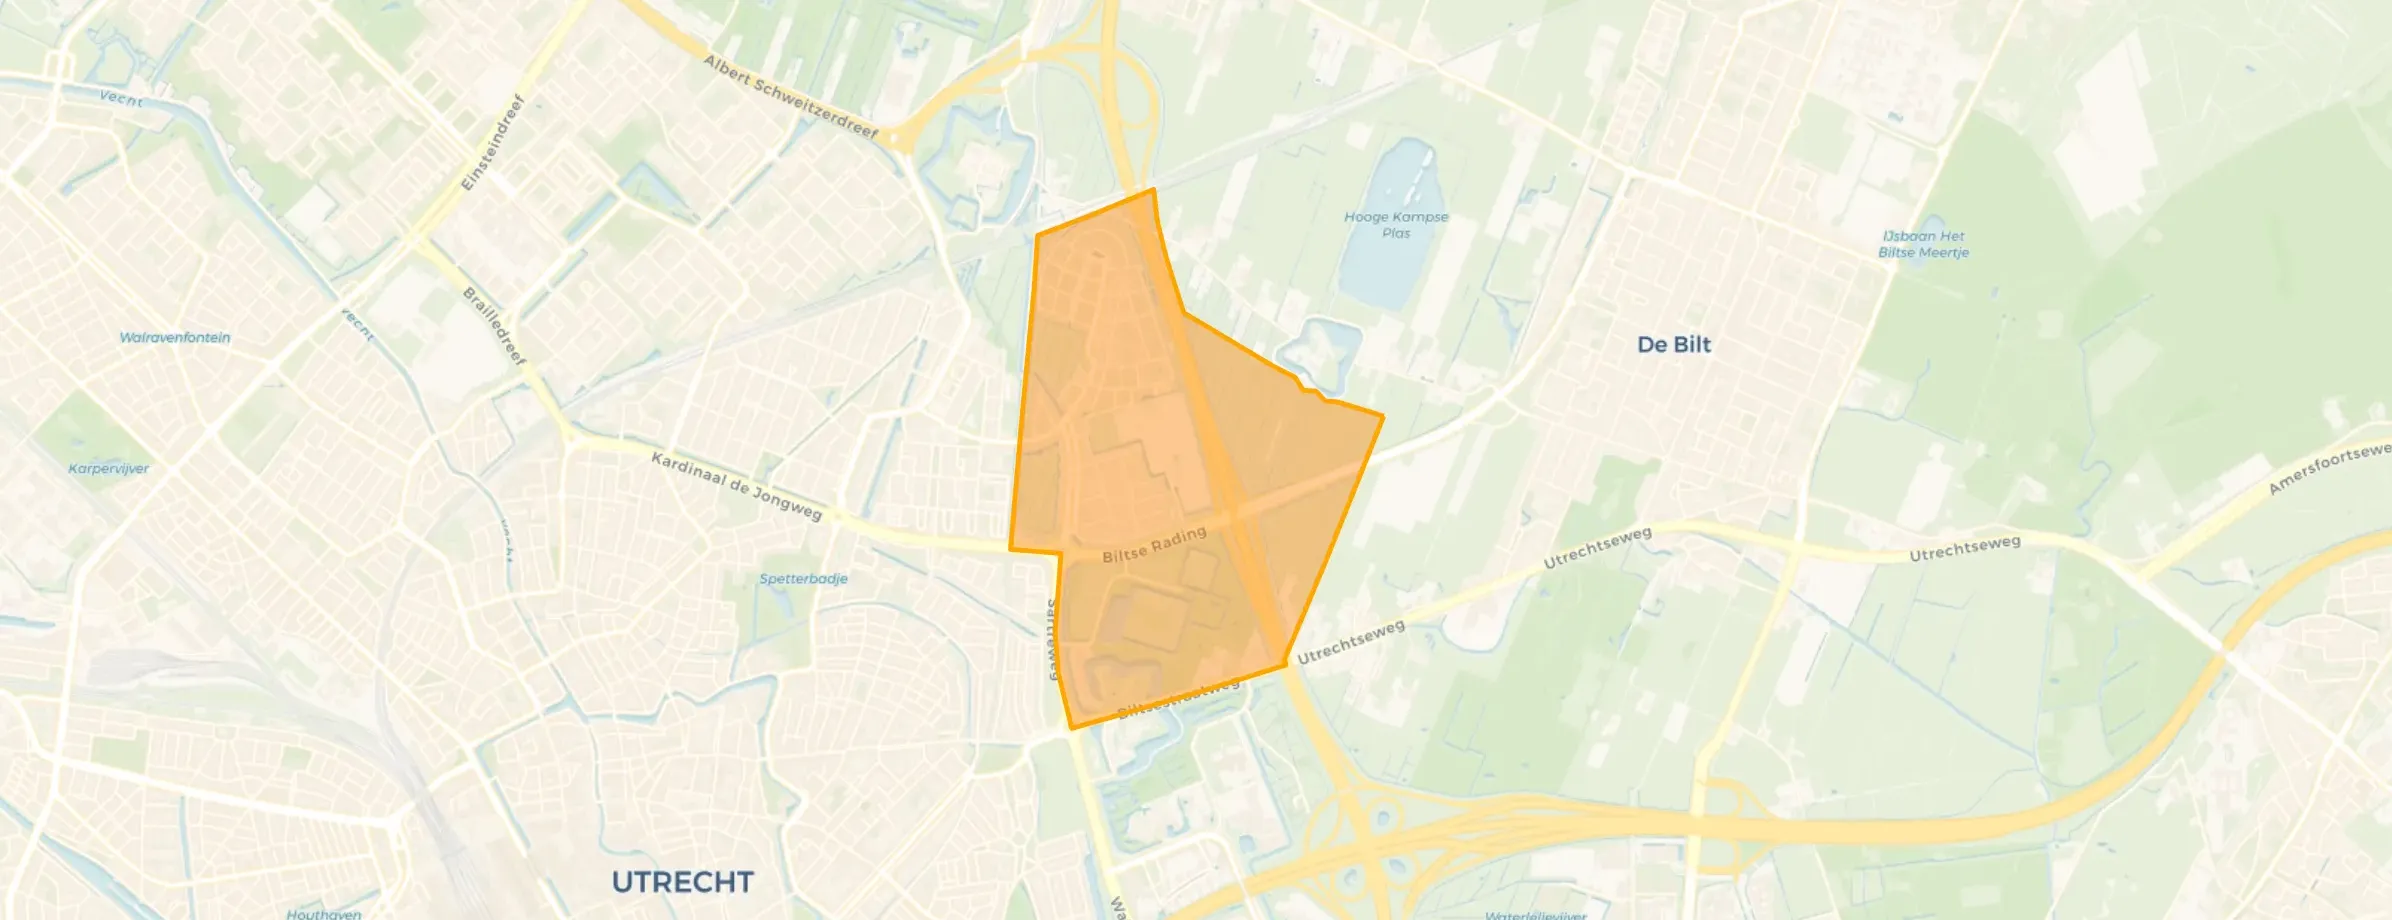
Voordorp en Voorveldsepolder is located in the province of Utrecht, in the municipality of Utrecht, in the district Noordoost The neighbourhood has a total area of 187 hectares, of which 180 hectares are land and 7 hectares are water. The neighbourhood is coded as BU03440423. The postcode area is 3566MN-3573ZK.
One resident rates the neighbourhood as good with a score of 7.6. The resident describes this neighbourhood as 'Village in the City'. Based on a limited number of reviews, no clear trends are visible yet in this neighbourhood.
Voordorp en Voorveldsepolder has 5.195 residents. Of these, 47,8% are men and 52,3% are women. Most residents are 25 to 45 years (29,0%). The other age groups are 25,1% for '45 to 65 years', 18,7% for '0 to 15 years', 16,6% for '65 years or older' and 10,8% for '15 to 25 years'. Of the residents, 59,9% is unmarried, 31,4% is married, 6,1% is divorced and 2,8% is widowed. 3.660 residents originate from the Netherlands, 465 come from Europe and 1.065 come from countries outside Europe.
There are 2.325 households in Voordorp en Voorveldsepolder. 41,1% of these are single-person households, 27,5% households without children and 31,4% households with children. The average household size is 2,1 persons. The national average is 2,1 persons.
In Voordorp en Voorveldsepolder there are 3.900 income recipients. The average income per income recipient is €56.200, which is €14.000 (33%) higher than the national average of €42.200. Per resident, the average income is €44.300, which is €9.400 (27%) higher than the national average of €34.900. Most residents of Voordorp en Voorveldsepolder are highly educated. 66,7% have a university or higher professional education (HBO/WO), 23,4% have an intermediate education (HAVO, VWO or MBO 2-4) and 9,9% have a lower education (VMBO or MBO 1).
Of the 5.195 residents, around 77% are in paid employment, which amounts to 4.000 people. This is 5% higher than the national average of 72%. The majority of workers are in salaried employment (82%), while 18% are self-employed. In Voordorp en Voorveldsepolder, 19% of residents receive a benefit. The largest group is those receiving a state pension (AOW). 750 people receive this benefit.
In Voordorp en Voorveldsepolder there are 2.158 homes with an average assessed value (WOZ) of €581.000. Of these, around 98% are occupied and 2% unoccupied. Most homes are owner-occupied. This amounts to 33% rental homes and 67% owner-occupied homes. Of the homes, 67% privately owned, 12% owned by housing associations and 21% owned by other landlords. The most common construction periods in Voordorp en Voorveldsepolder are 1990-2000 (66%) and 2010-2020 (30%).
There are currently 9 homes for sale in Voordorp en Voorveldsepolder. The most recently listed home is Aartsbisschop Romerostraat 263 by Interhouse makelaars Utrecht op Funda. Over the past year, 90 homes were sold in Voordorp en Voorveldsepolder. On average, a home was sold within 42 days.
The average asking price for a home for sale in Voordorp en Voorveldsepolder over the past year was €614.000. This is 6% higher than the average assessed value (WOZ) of €581.000. The average asking price per m² of plot is €6.020.
There are 3 homes for rent in Voordorp en Voorveldsepolder. The most recent home is Pal Maleterstraat 18, offered by LIV Residential. Over the past year, 123 homes were let in Voordorp en Voorveldsepolder. On average, a listing was let within 36 days.
The average rent for a rental home in Voordorp en Voorveldsepolder over the past year was €1.917 per month. Per m² of plot area that is €22 per month.
In Voordorp en Voorveldsepolder there are 1.324 addresses with a registered energy label. The most common labels are A (50%), B (25%) and C (12%). On average, an address in Voordorp en Voorveldsepolder uses 2.250 kWh of electricity per year. This is 12% below the national average of 2.550 kWh. With an annual consumption of 610 m³ per address, natural gas consumption is 24% below the national average of 800 m³.
When I come to Voordorp, it really feels like a village. People look at you, say hello, children play in the street, and there's a lot of greenery. It's also car-free, which makes it nice and quiet on the street! Once there was a fight between a bunch of street youths, but I don't think they were from the neighbourhood. Because I hardly ever see people hanging around on the street, which I also like. My room is practically on the pavement and I never have any trouble with anyone. I also come from a village and was a bit afraid of the city's hustle and bustle, but it's not like that at all, so that's really great.
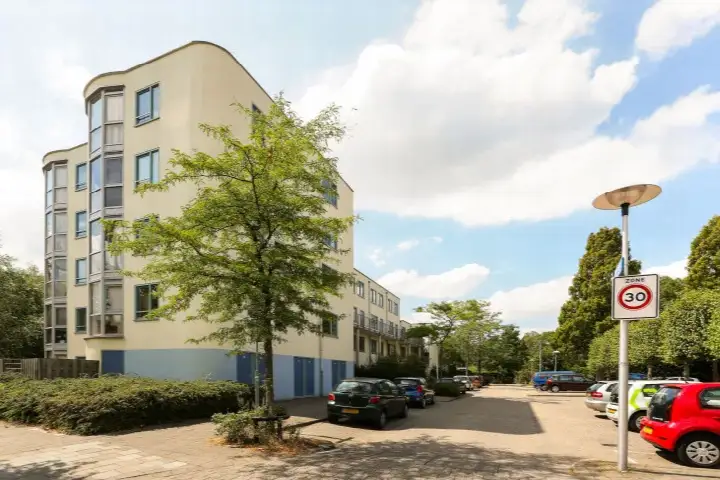
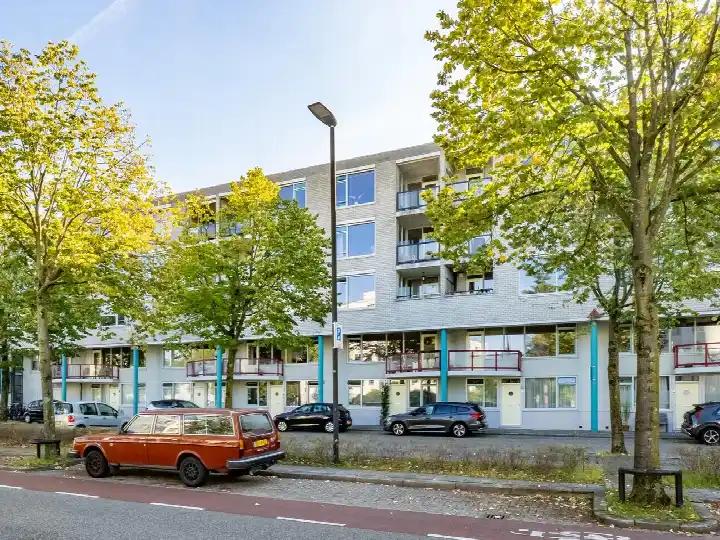
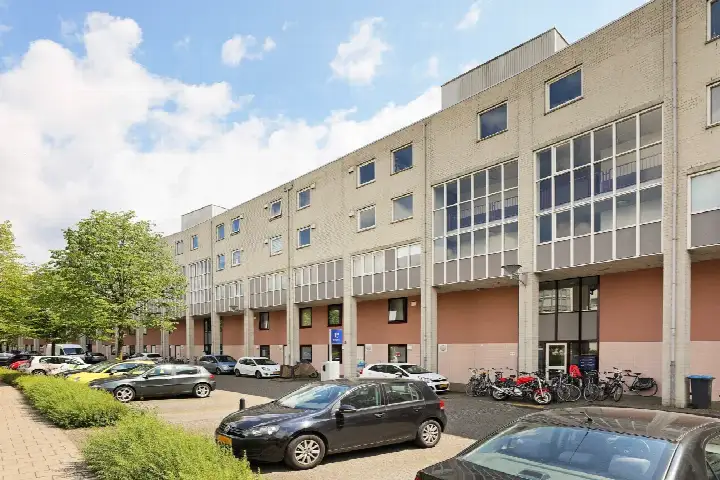
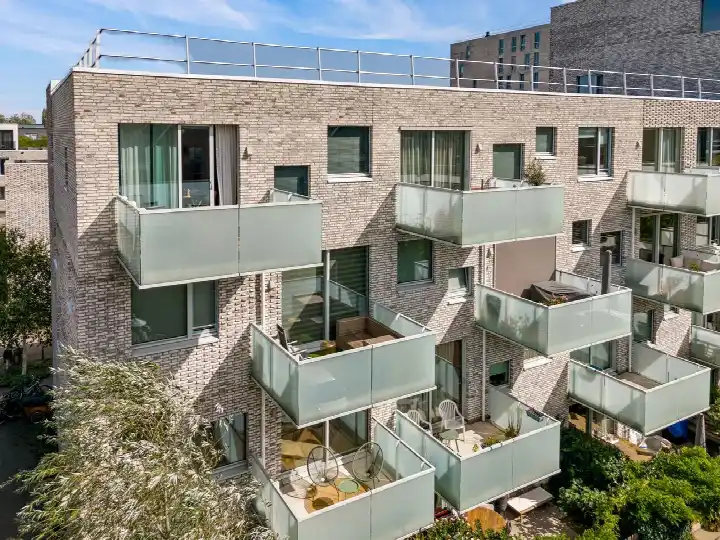
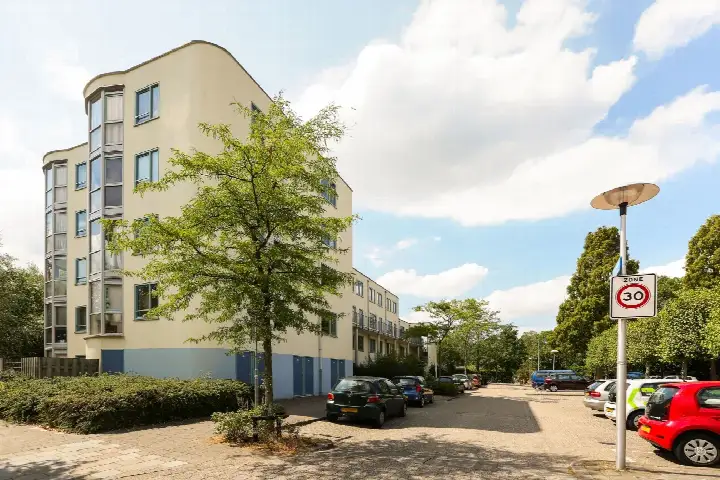
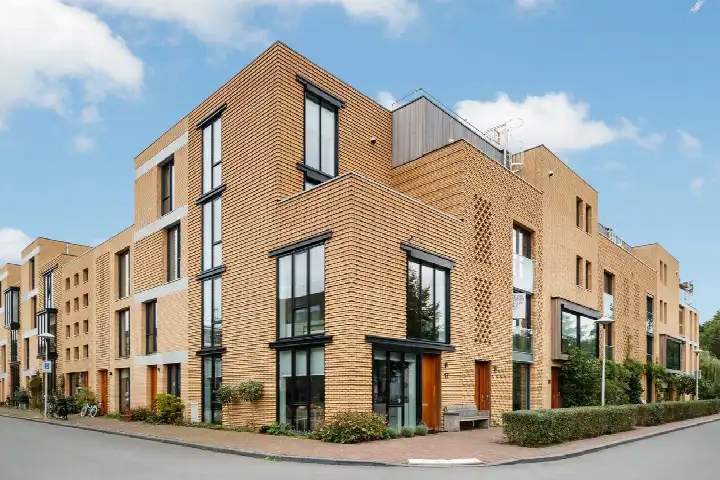
Auto-translated to English by AIThe housing stock is relatively young — 98% dates from after 1990. In addition, the most common type is flats (45%).
Over the past year a home for sale in Voordorp en Voorveldsepolder was listed for an average of €612,907 (€6,031 per m²). That is 16% above the Dutch national average.
A rental home in Voordorp en Voorveldsepolder cost an average of €1,876 per month (€22 per m²). That is 13% below the national average.
The housing supply in Voordorp en Voorveldsepolder is remarkably efficient: 91% has an A, A+ or B label. The average natural gas consumption per household is 610 m³ per year.
From Voordorp en Voorveldsepolder you can on average reach a supermarket at 1.1 km, a GP at 0.6 km, a railway station at 2.1 km, a primary school at 0.7 km (as the crow flies, source: CBS).
Right now you will find 9 homes for sale and 3 homes for rent in Voordorp en Voorveldsepolder.