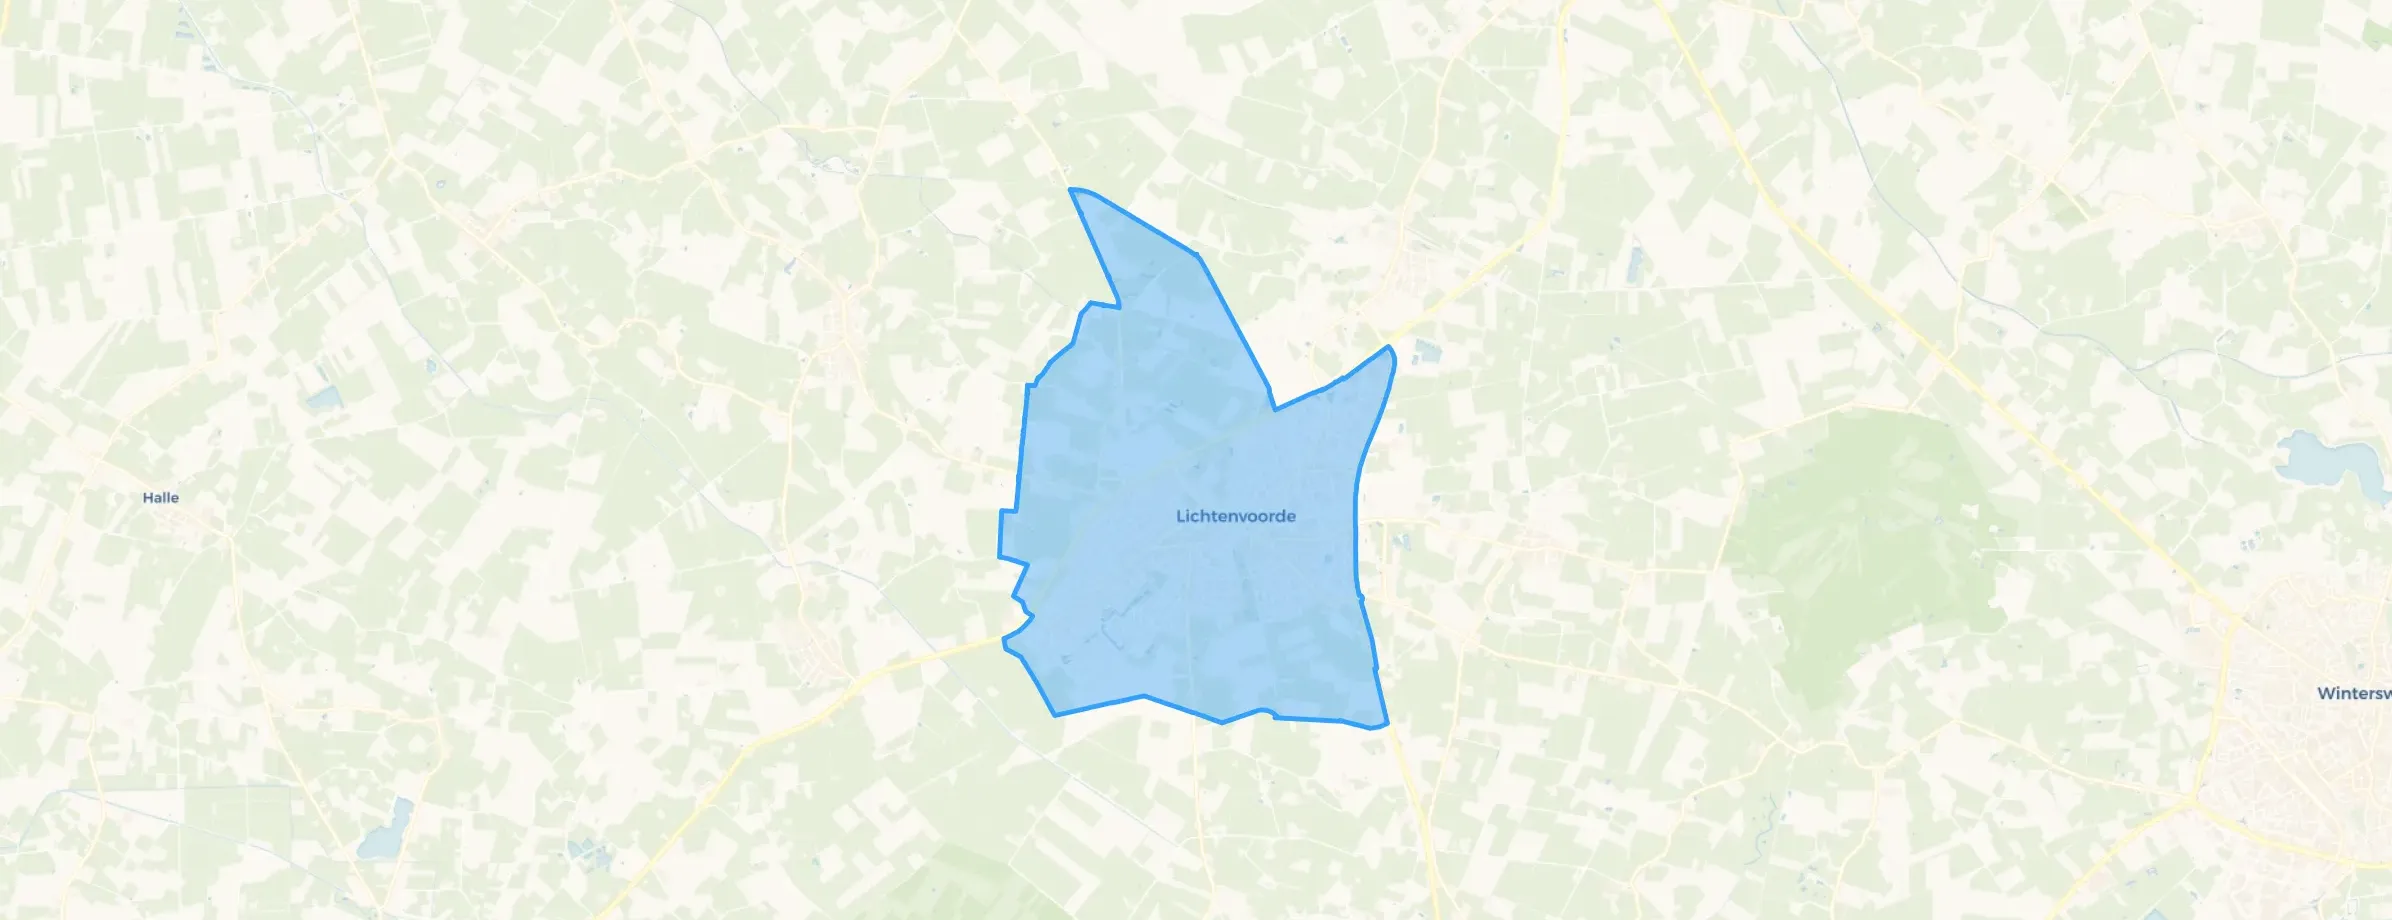
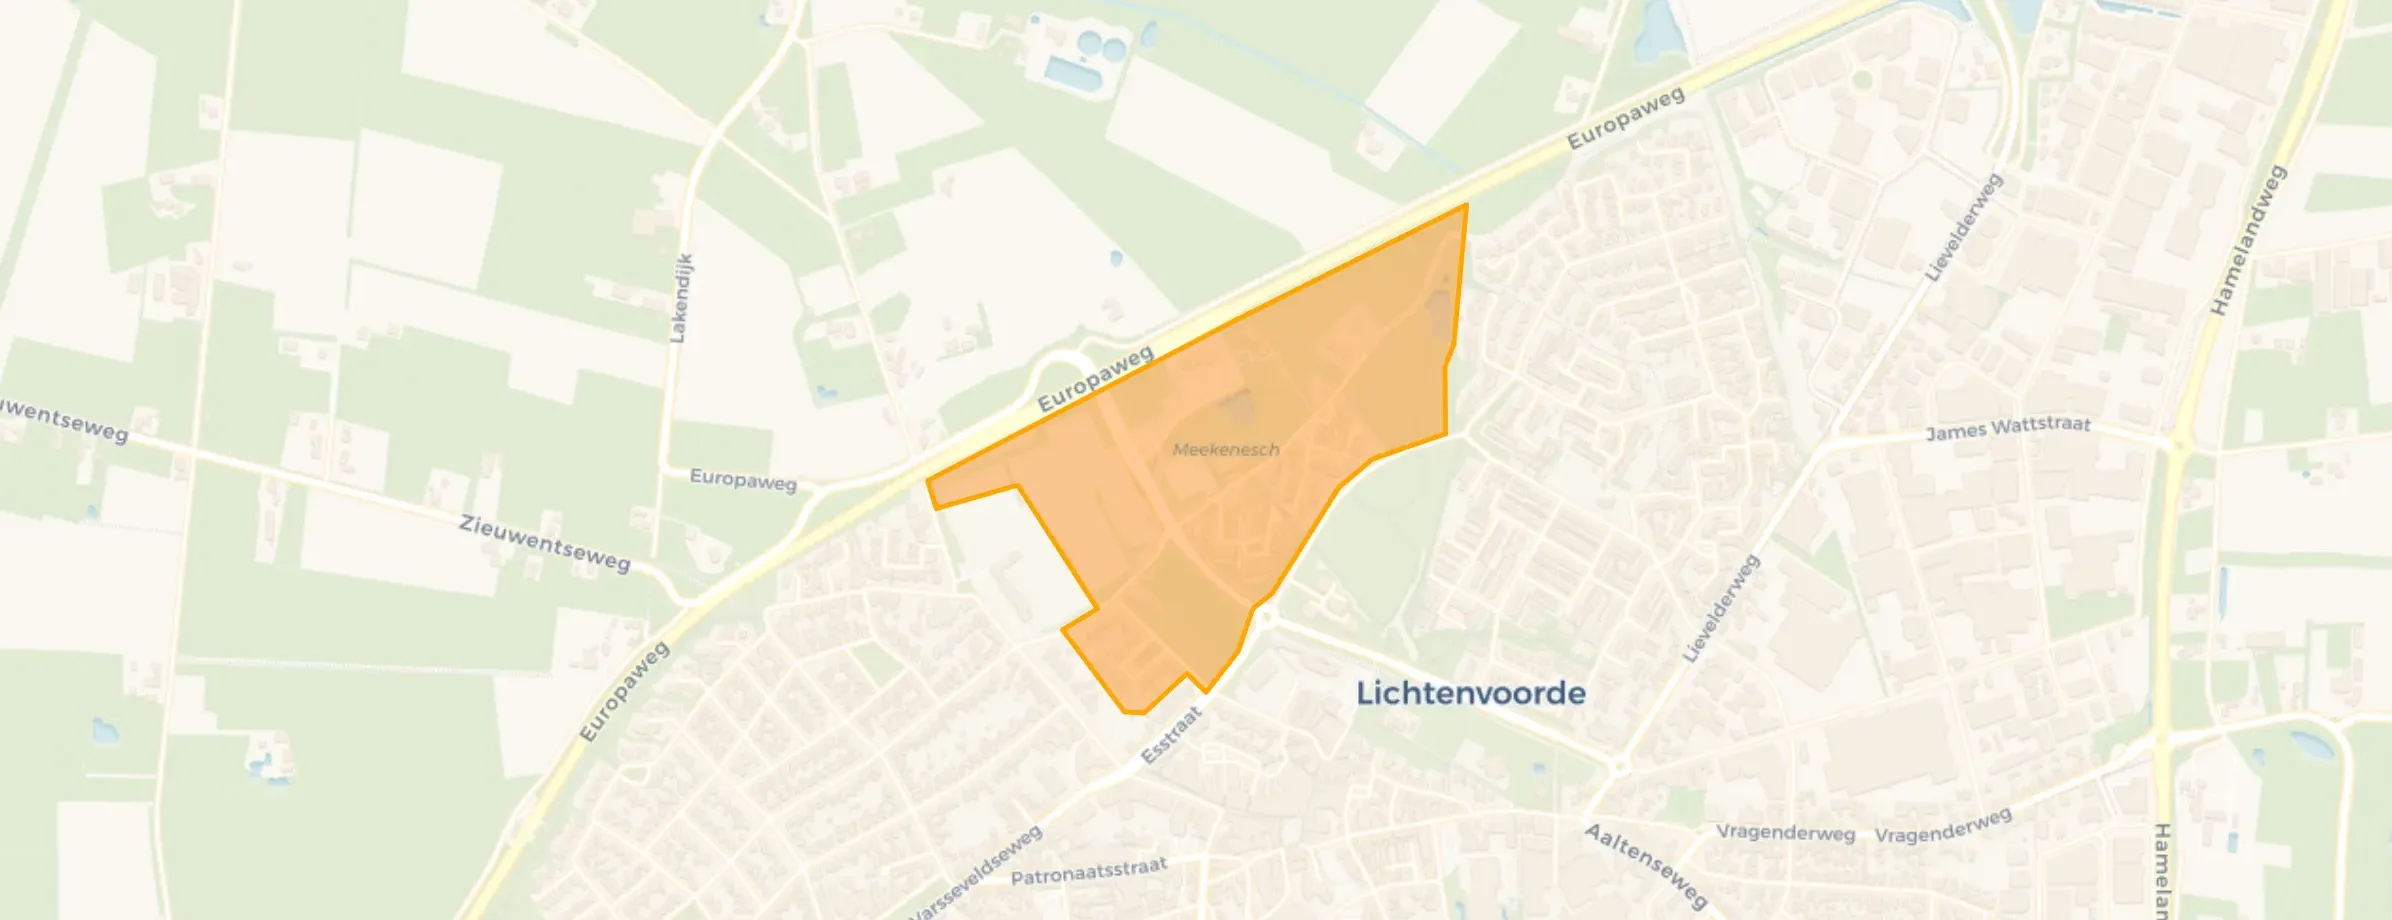
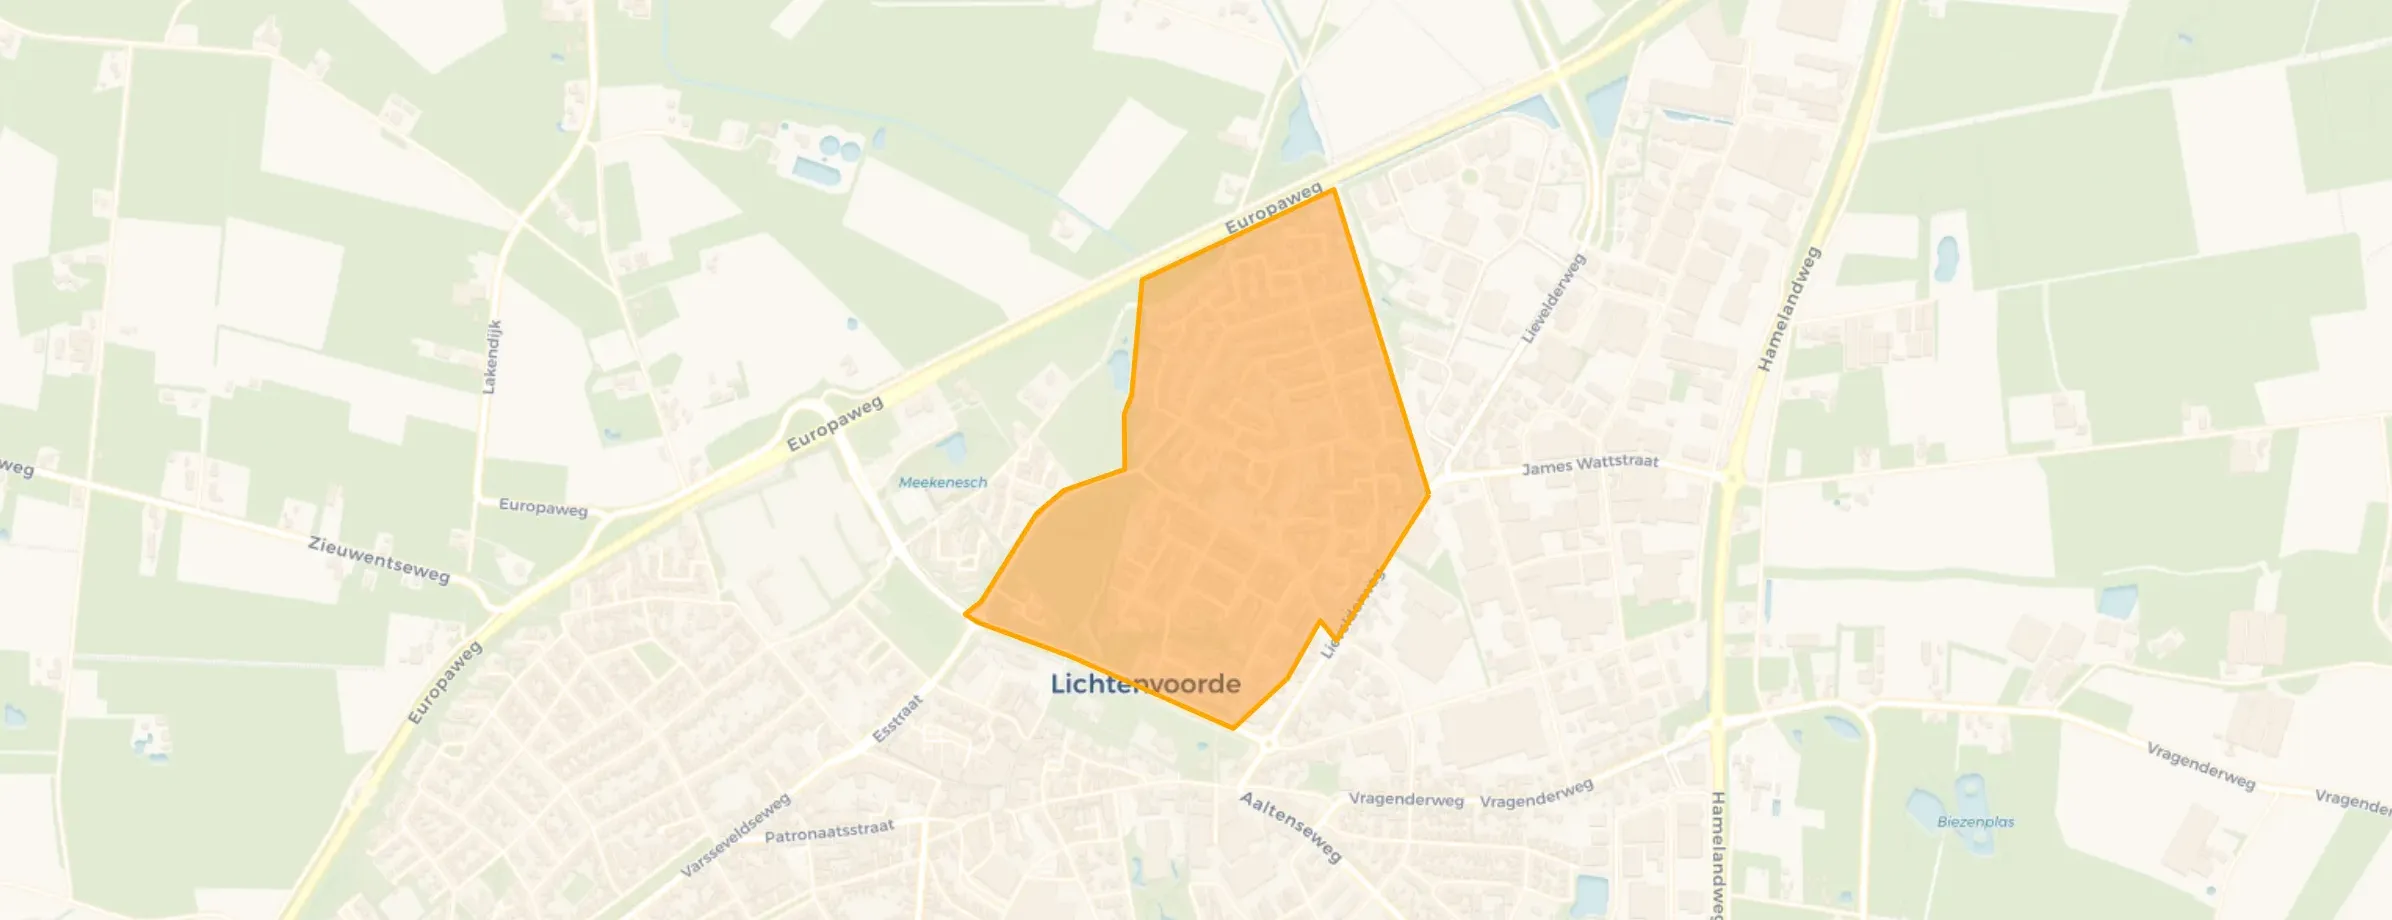
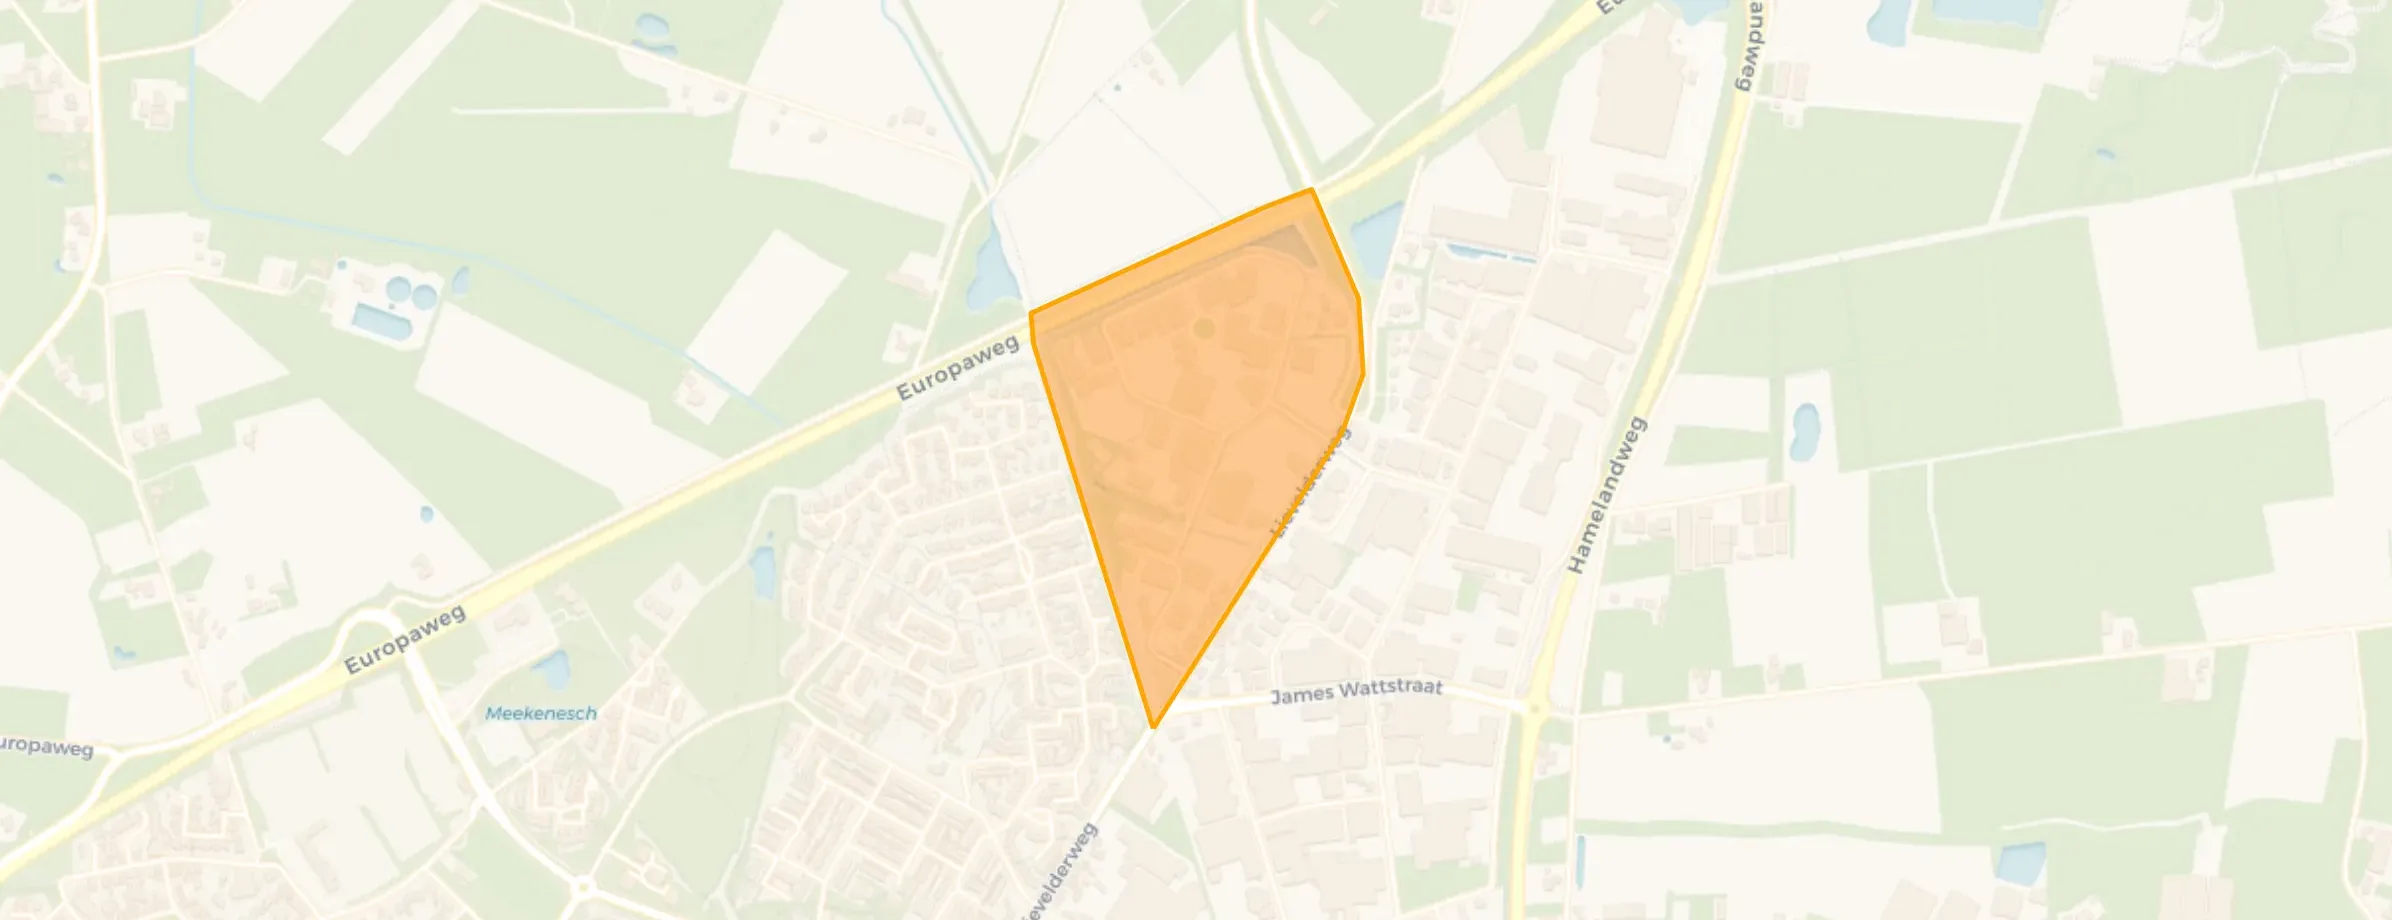
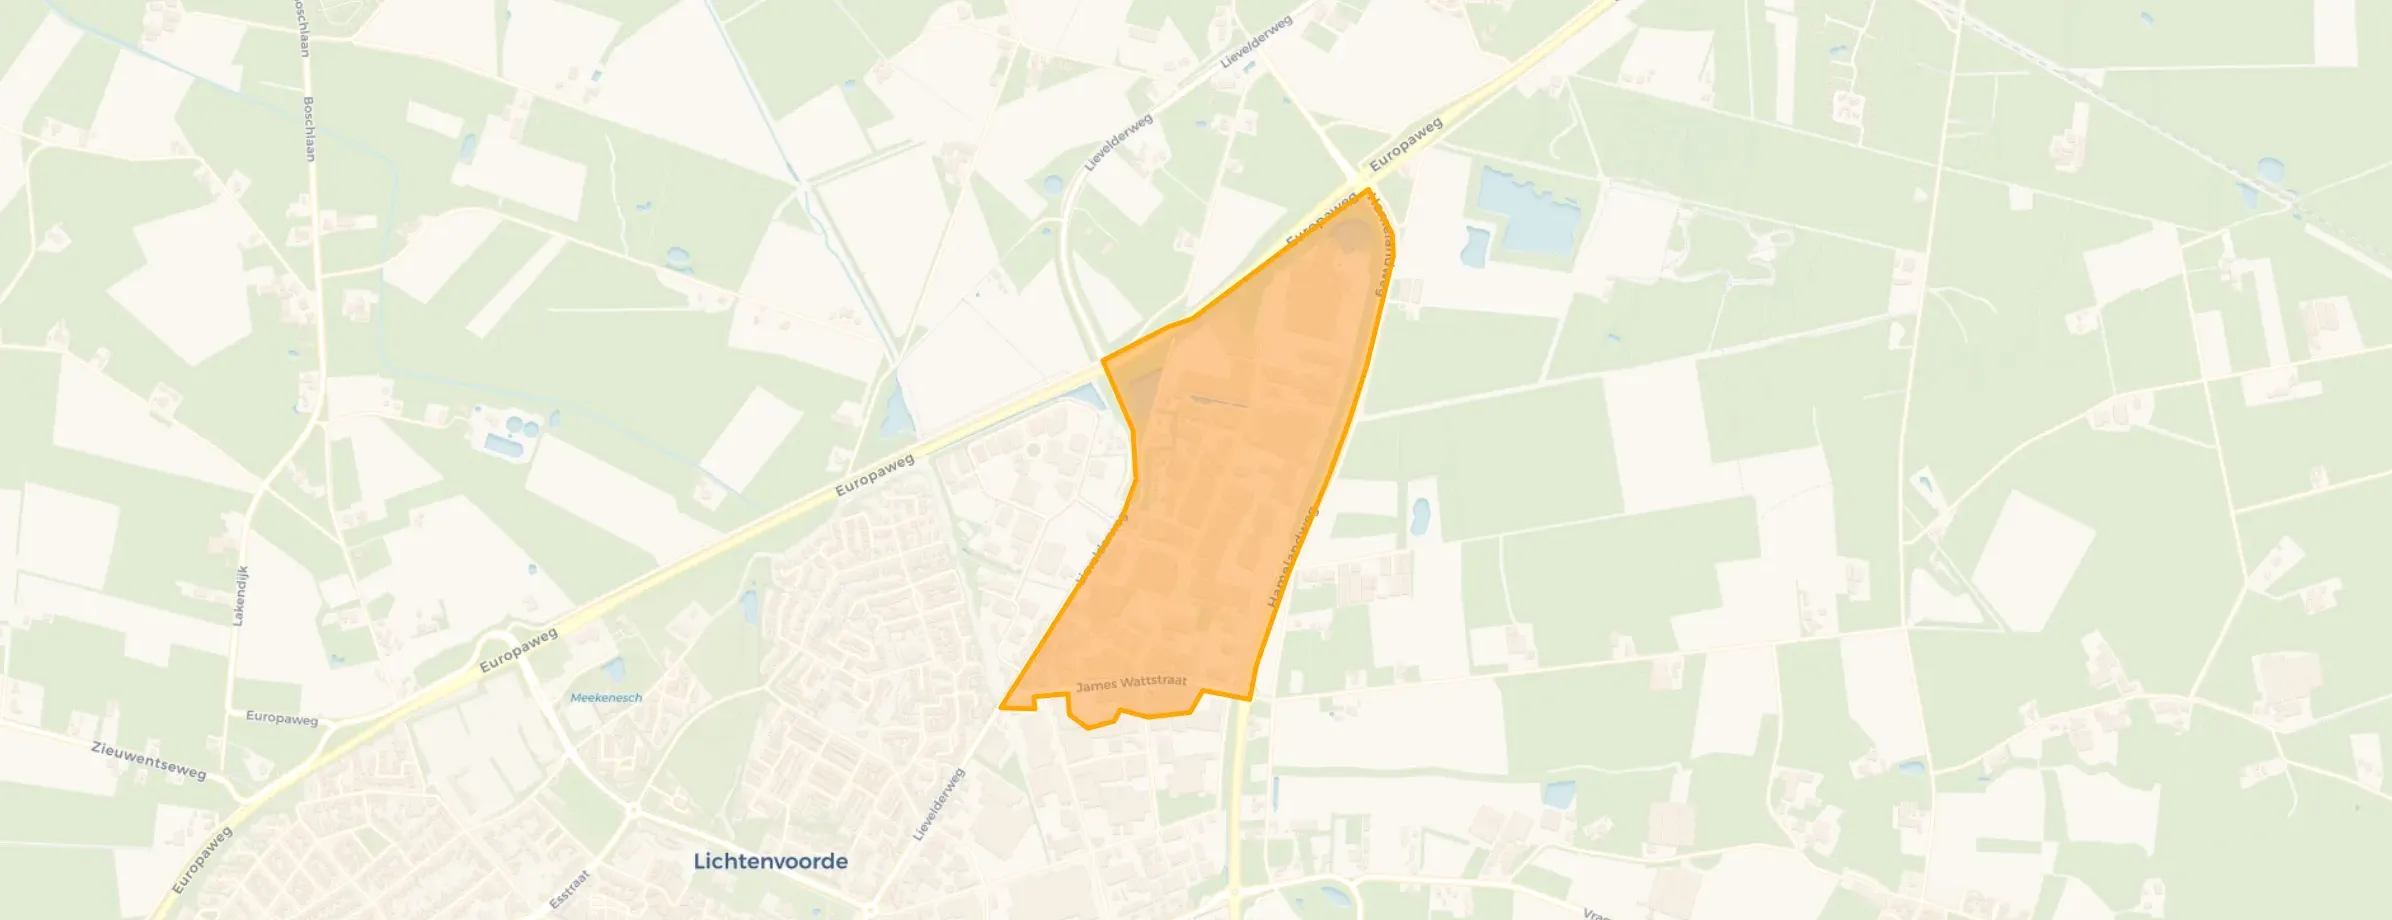
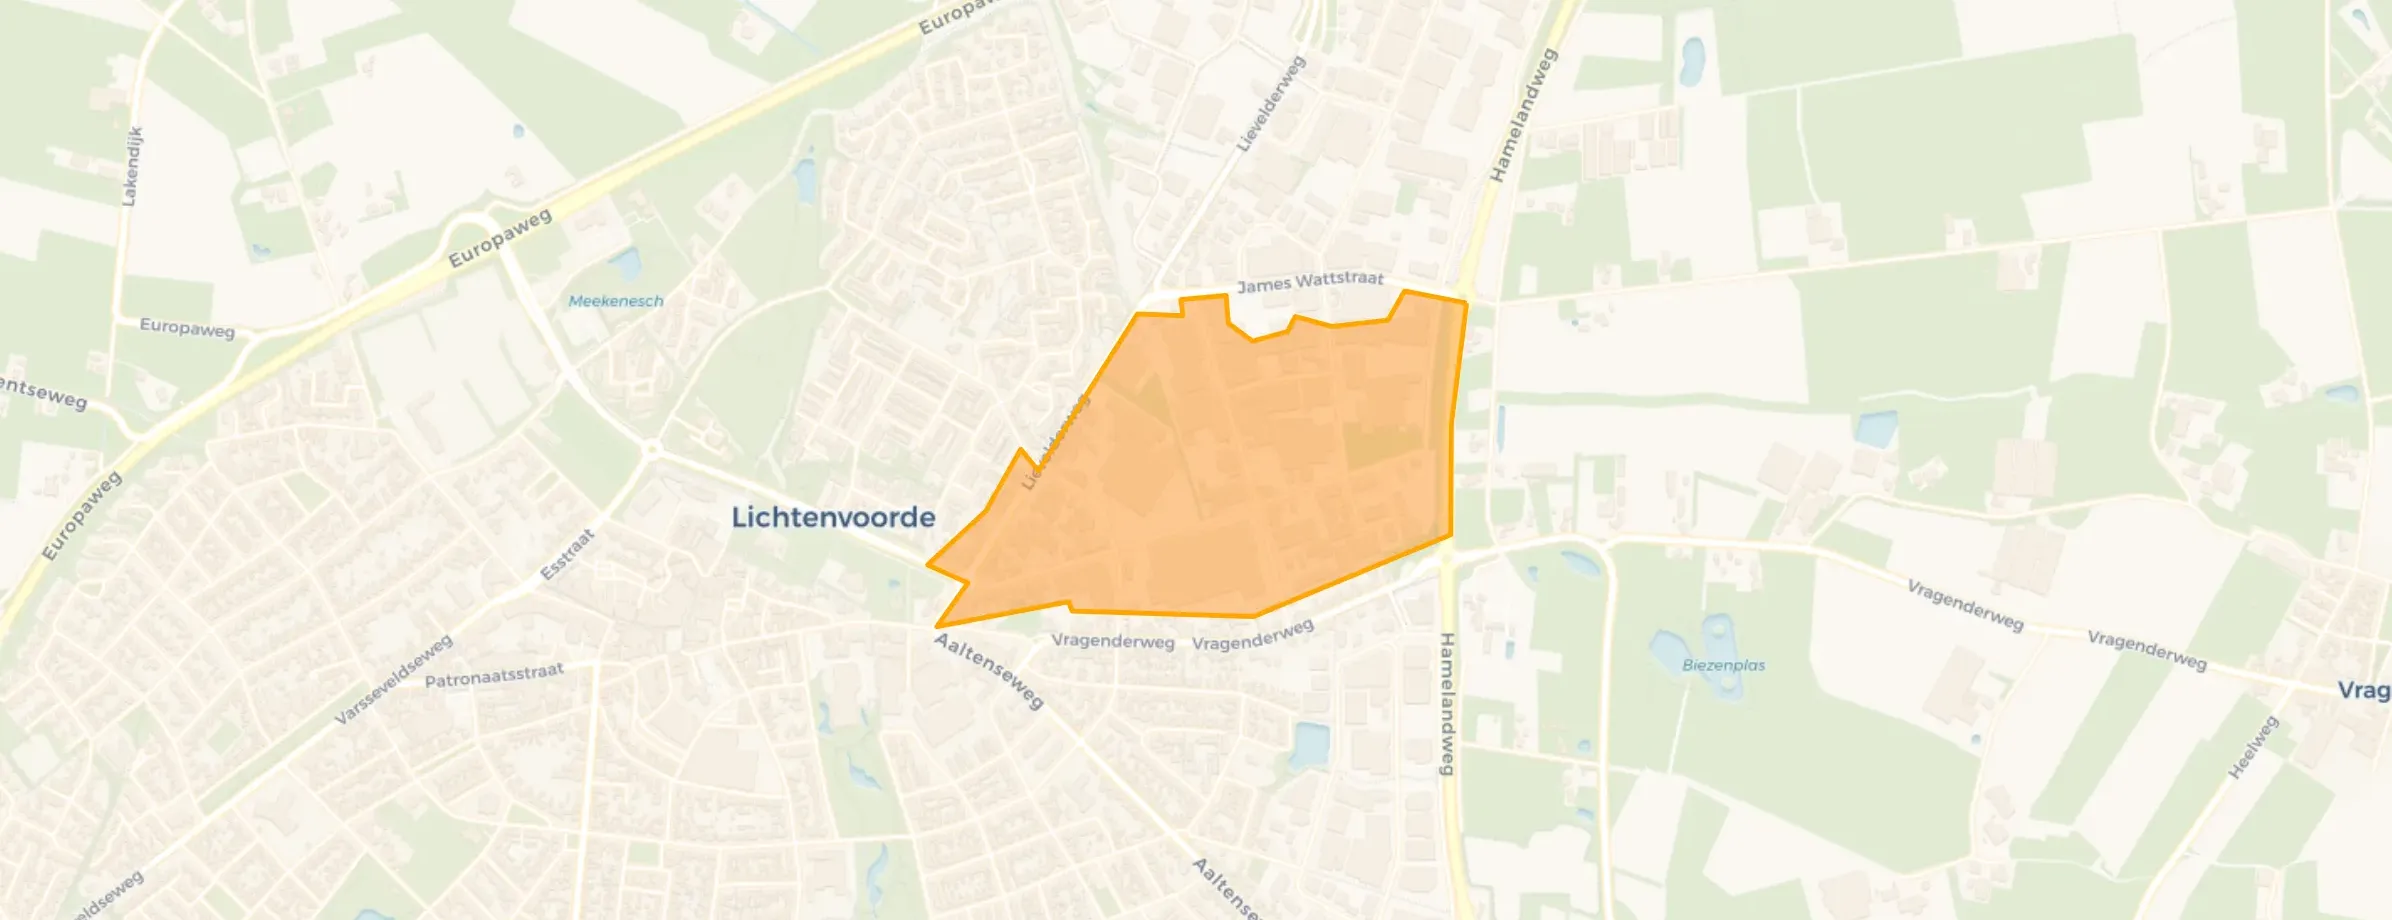
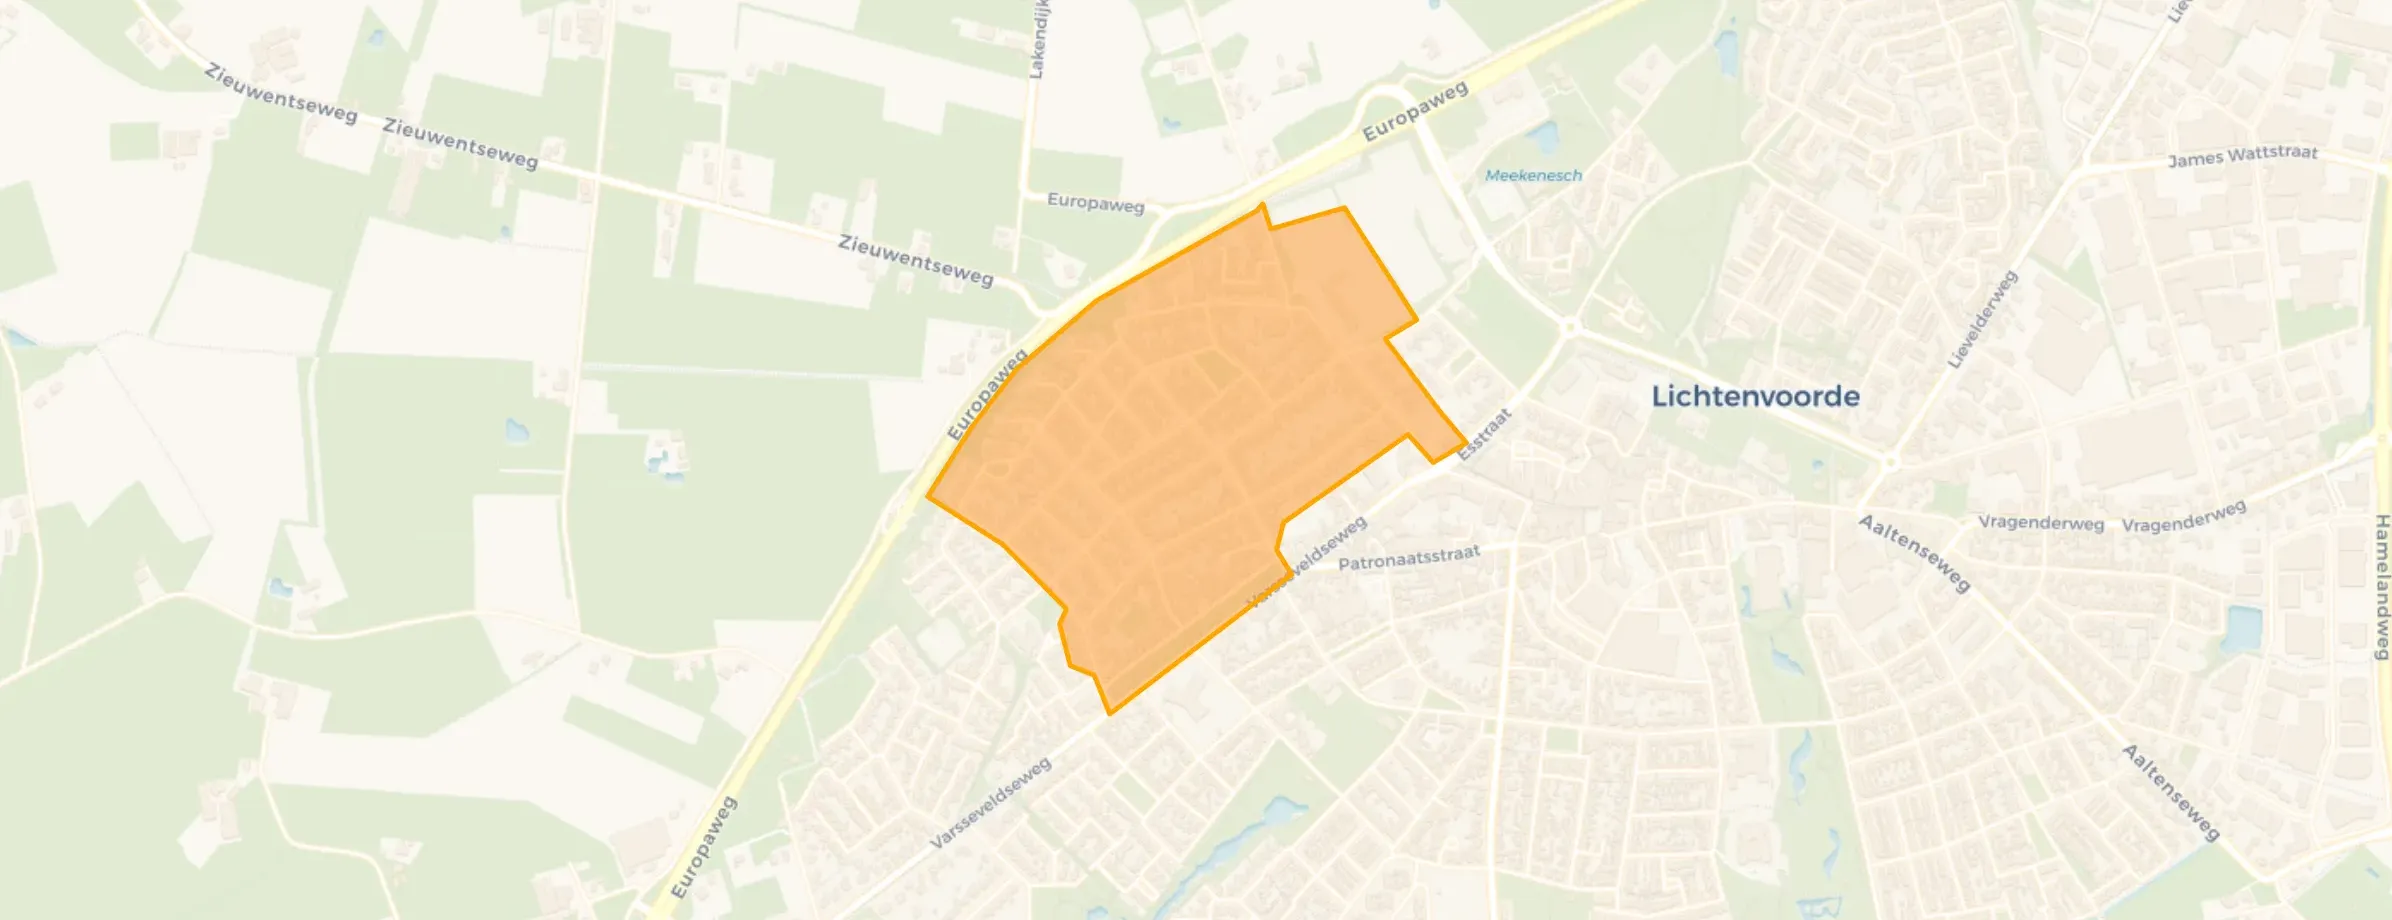
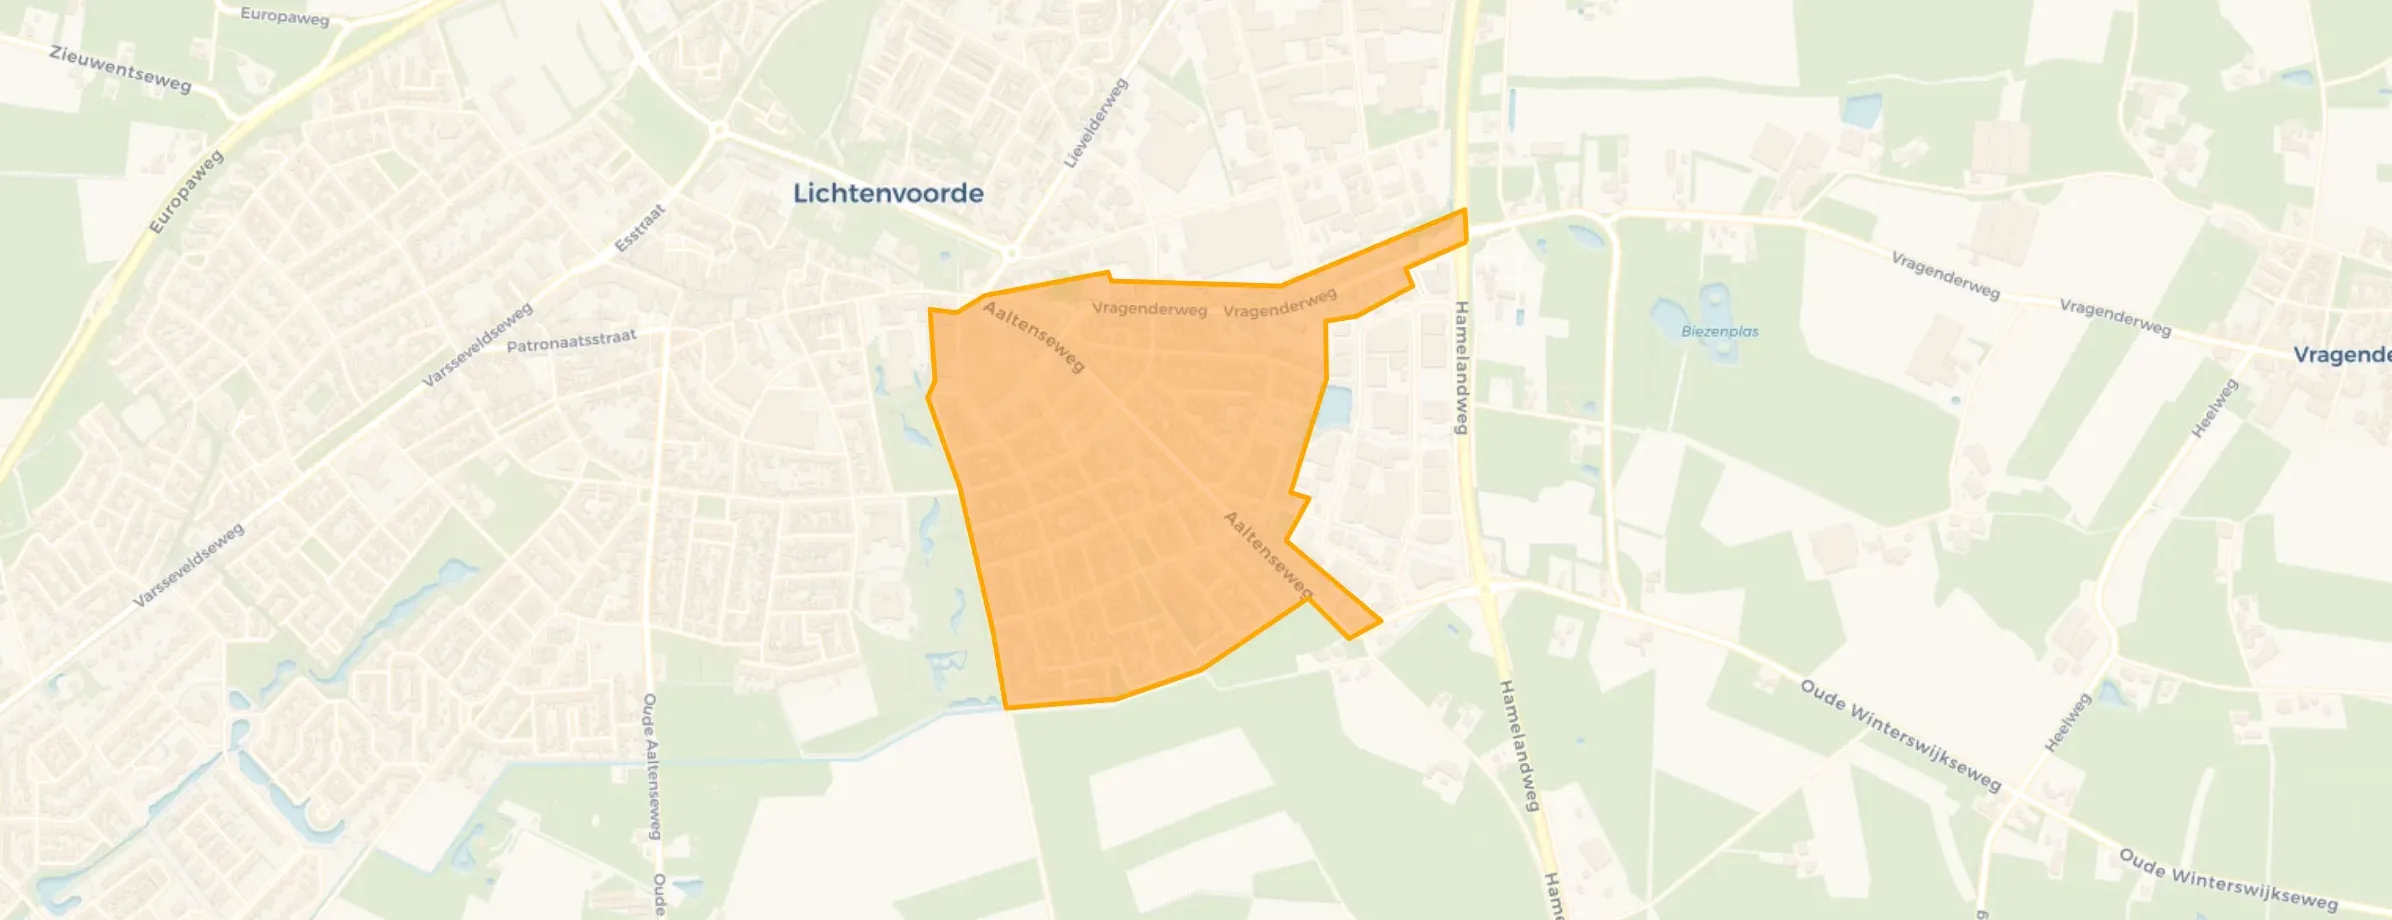
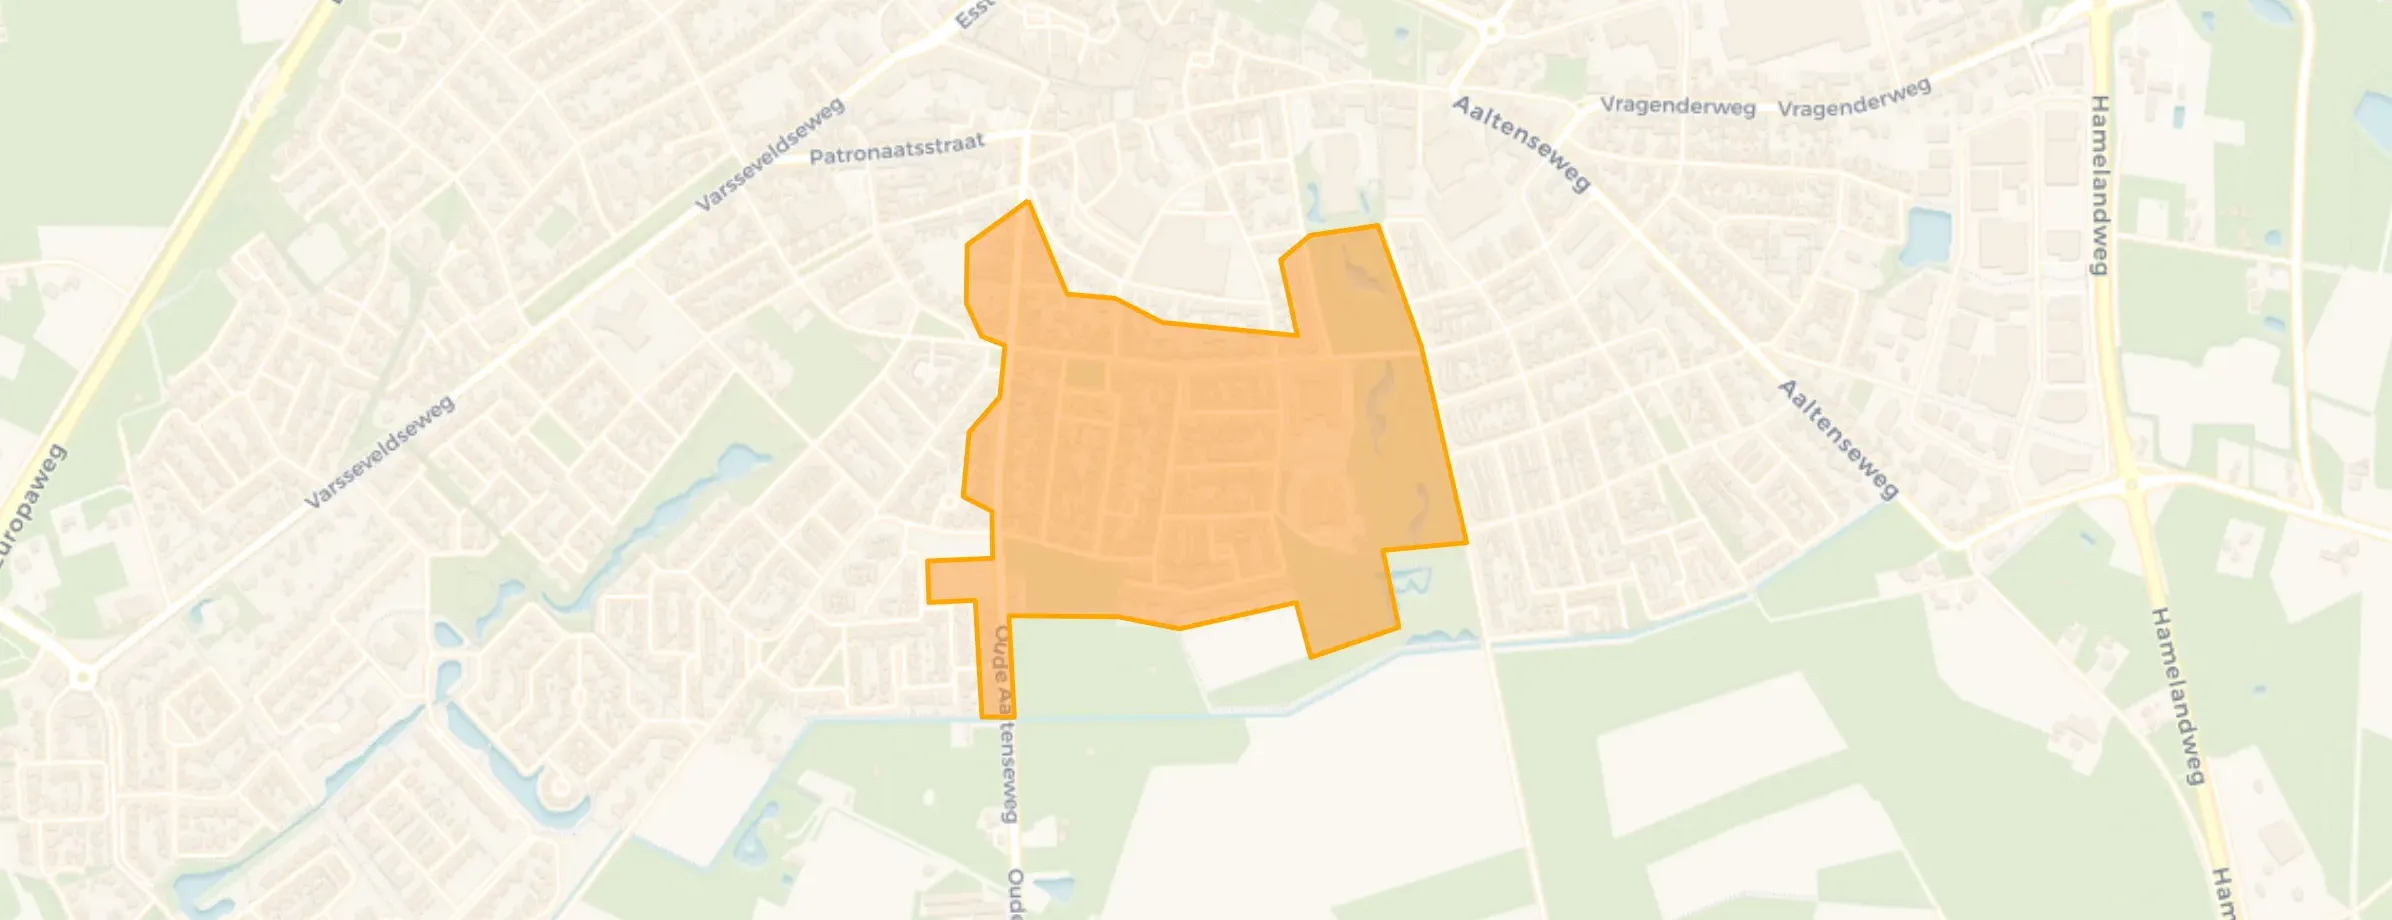
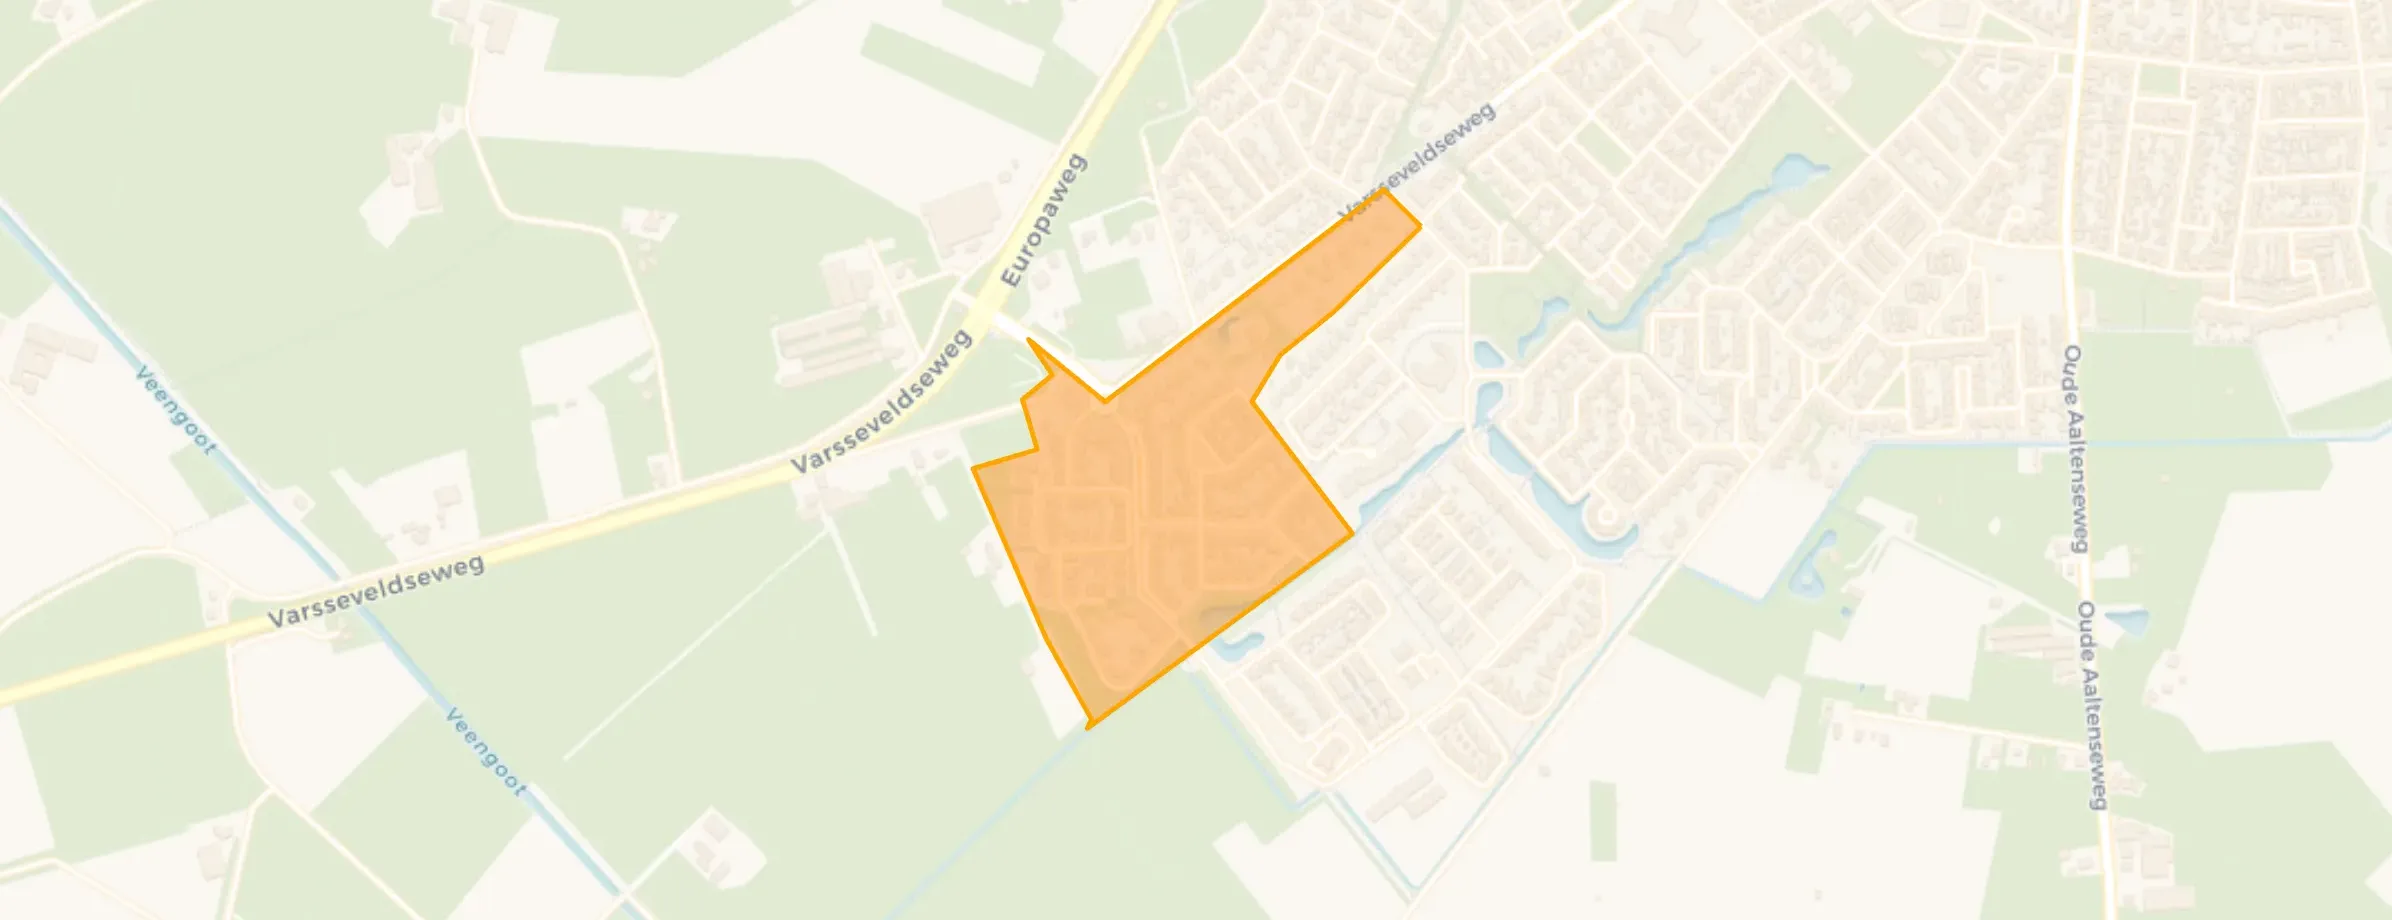
Lichtenvoorde is located in the province of Gelderland, in the municipality of Oost Gelre. The district has a total area of 1.149 hectares, of which 1.149 hectares are land and 0 hectares are water. The district is coded as WK158601. The postcode area is 7131AA-7132EV.
Lichtenvoorde has 13.135 residents. Of these, 49,8% are men and 50,2% are women. Most residents are 65 years or older (26,7%). The other age groups are 25,6% for '45 to 65 years', 22,3% for '25 to 45 years', 14,8% for '0 to 15 years' and 10,7% for '15 to 25 years'. Of the residents, 46,3% is unmarried, 40,9% is married, 5,9% is divorced and 6,9% is widowed. 11.945 residents originate from the Netherlands, 520 come from Europe and 675 come from countries outside Europe.
There are 5.625 households in Lichtenvoorde. 31,3% of these are single-person households, 35,7% households without children and 33,0% households with children. The average household size is 2,3 persons. The national average is 2,1 persons.
In Lichtenvoorde there are 10.700 income recipients. The average income per income recipient is €38.400, which is €3.800 (9%) lower than the national average of €42.200. Per resident, the average income is €32.400, which is €2.500 (7%) lower than the national average of €34.900. Most residents of Lichtenvoorde are educated to an intermediate level. 47,5% have an intermediate education (HAVO, VWO or MBO 2-4), 28,0% have a university or higher professional education (HBO/WO) and 24,5% have a lower education (VMBO or MBO 1).
Of the 13.135 residents, around 76% are in paid employment, which amounts to 9.983 people. This is 4% higher than the national average of 72%. The majority of workers are in salaried employment (87%), while 13% are self-employed. In Lichtenvoorde, 30% of residents receive a benefit. The largest group is those receiving a state pension (AOW). 3.110 people receive this benefit.
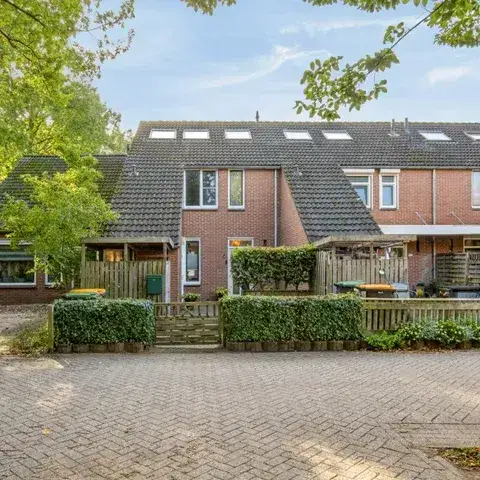
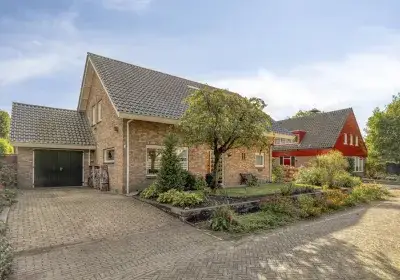
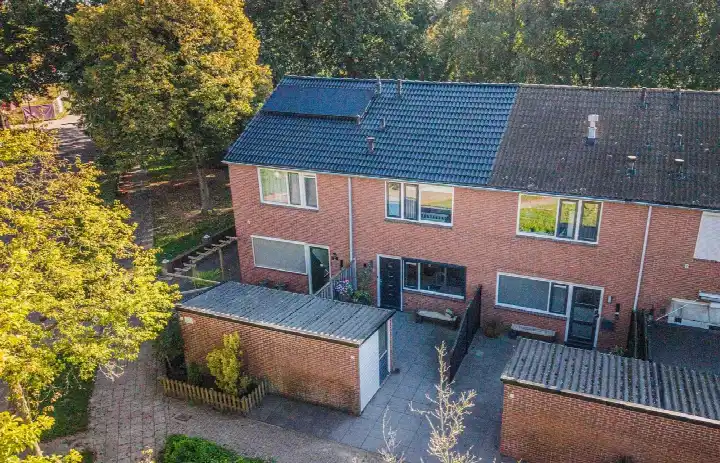
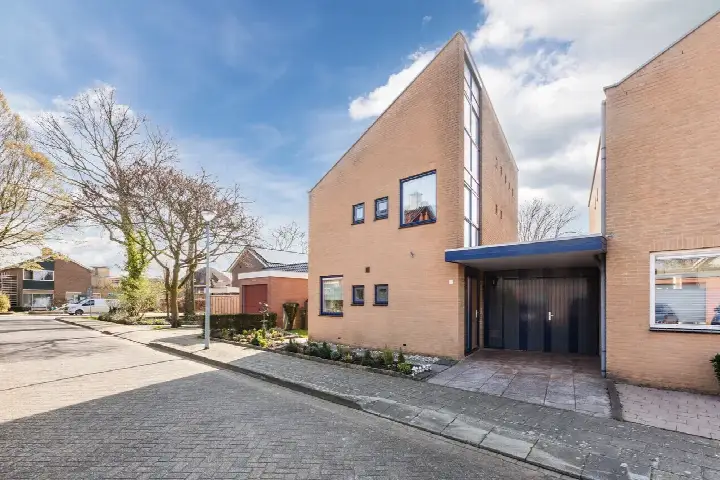
In Lichtenvoorde there are 5.906 homes with an average assessed value (WOZ) of €334.000. Of these, around 98% are occupied and 2% unoccupied. Most homes are owner-occupied. This amounts to 29% rental homes and 71% owner-occupied homes. Of the homes, 71% privately owned, 20% owned by housing associations and 9% owned by other landlords. The most common construction periods in Lichtenvoorde are 1970-1980 (24%) and 1950-1970 (18%).
There are currently 78 homes for sale in Lichtenvoorde. The most recently listed home is Saturnus 14 by Lichtenvoorde. Over the past year, 157 homes were sold in Lichtenvoorde. On average, a home was sold within 48 days.
The average asking price for a home for sale in Lichtenvoorde over the past year was €412.916. This is 24% higher than the average assessed value (WOZ) of €334.000. The average asking price per m² of floor area is €3.377.
There are 2 homes for rent in Lichtenvoorde. The most recent home is Heckinckstraat 65, offered by www.thuisindeachterhoek.nl. Over the past year, 1 homes were let in Lichtenvoorde. On average, a listing was let within 1 days.
The average rent for a rental home in Lichtenvoorde over the past year was €2.100 per month. Per m² of floor area that is €15 per month.
In Lichtenvoorde there are 3.847 addresses with a registered energy label. The most common labels are A (34%), C (29%) and B (15%). On average, an address in Lichtenvoorde uses 2.760 kWh of electricity per year. This is 8% above the national average of 2.550 kWh. Natural gas consumption, at 890 m³ per year, is 11% above the national average of 800 m³.
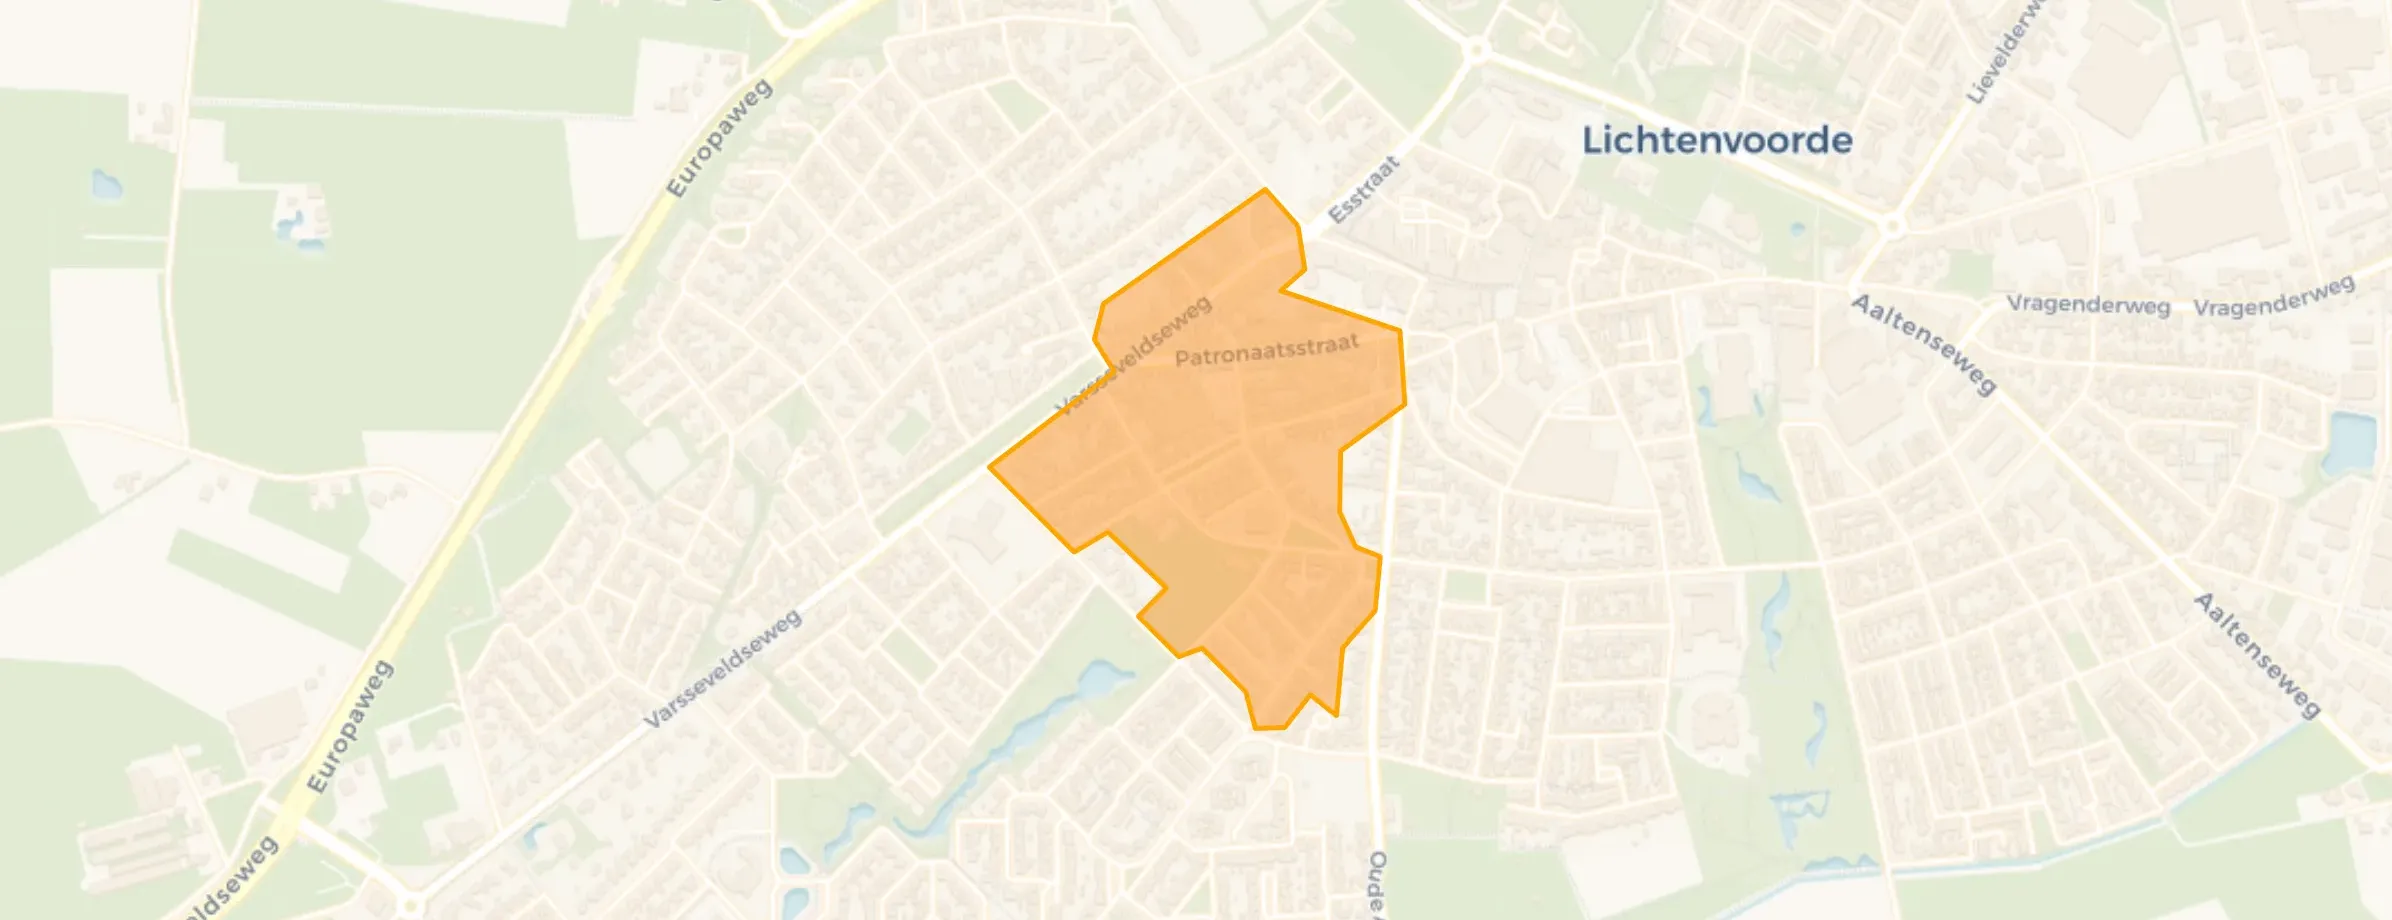
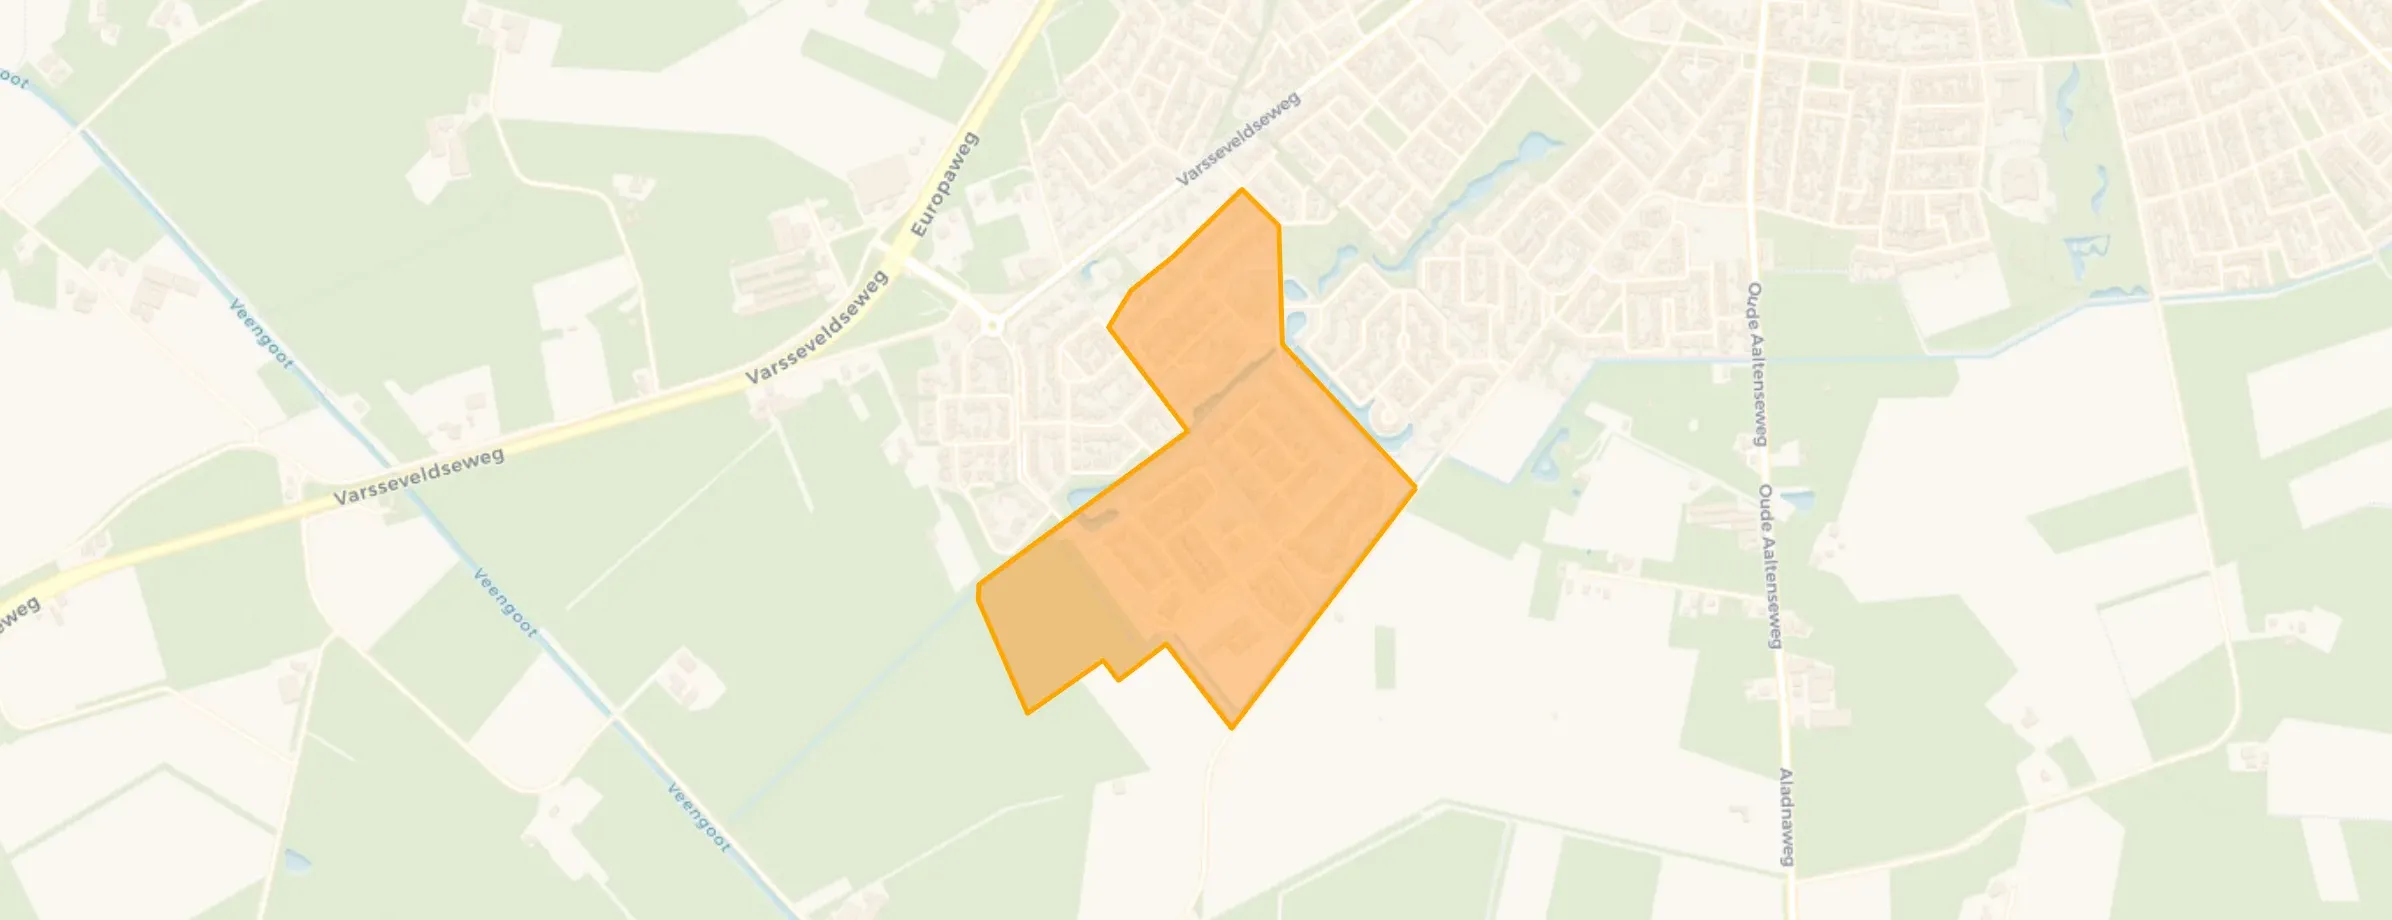
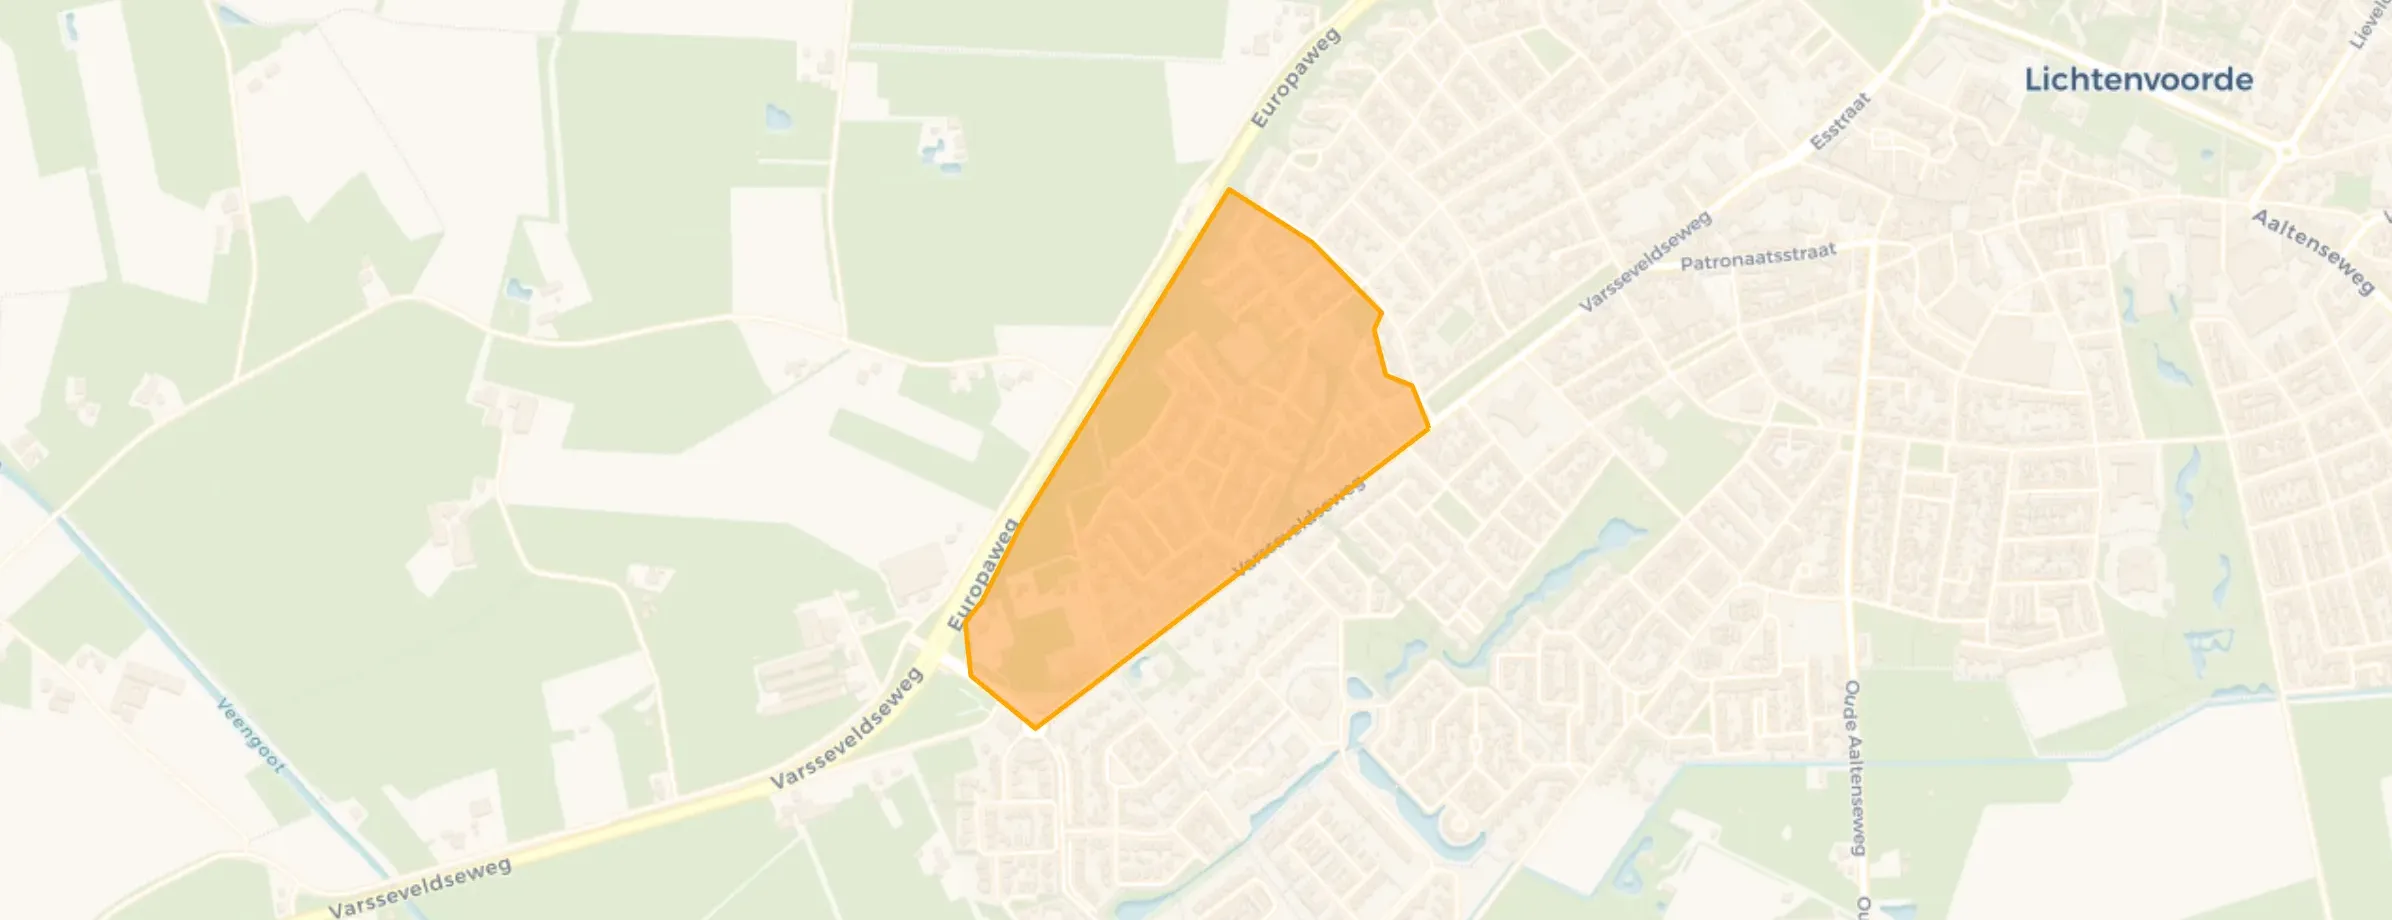
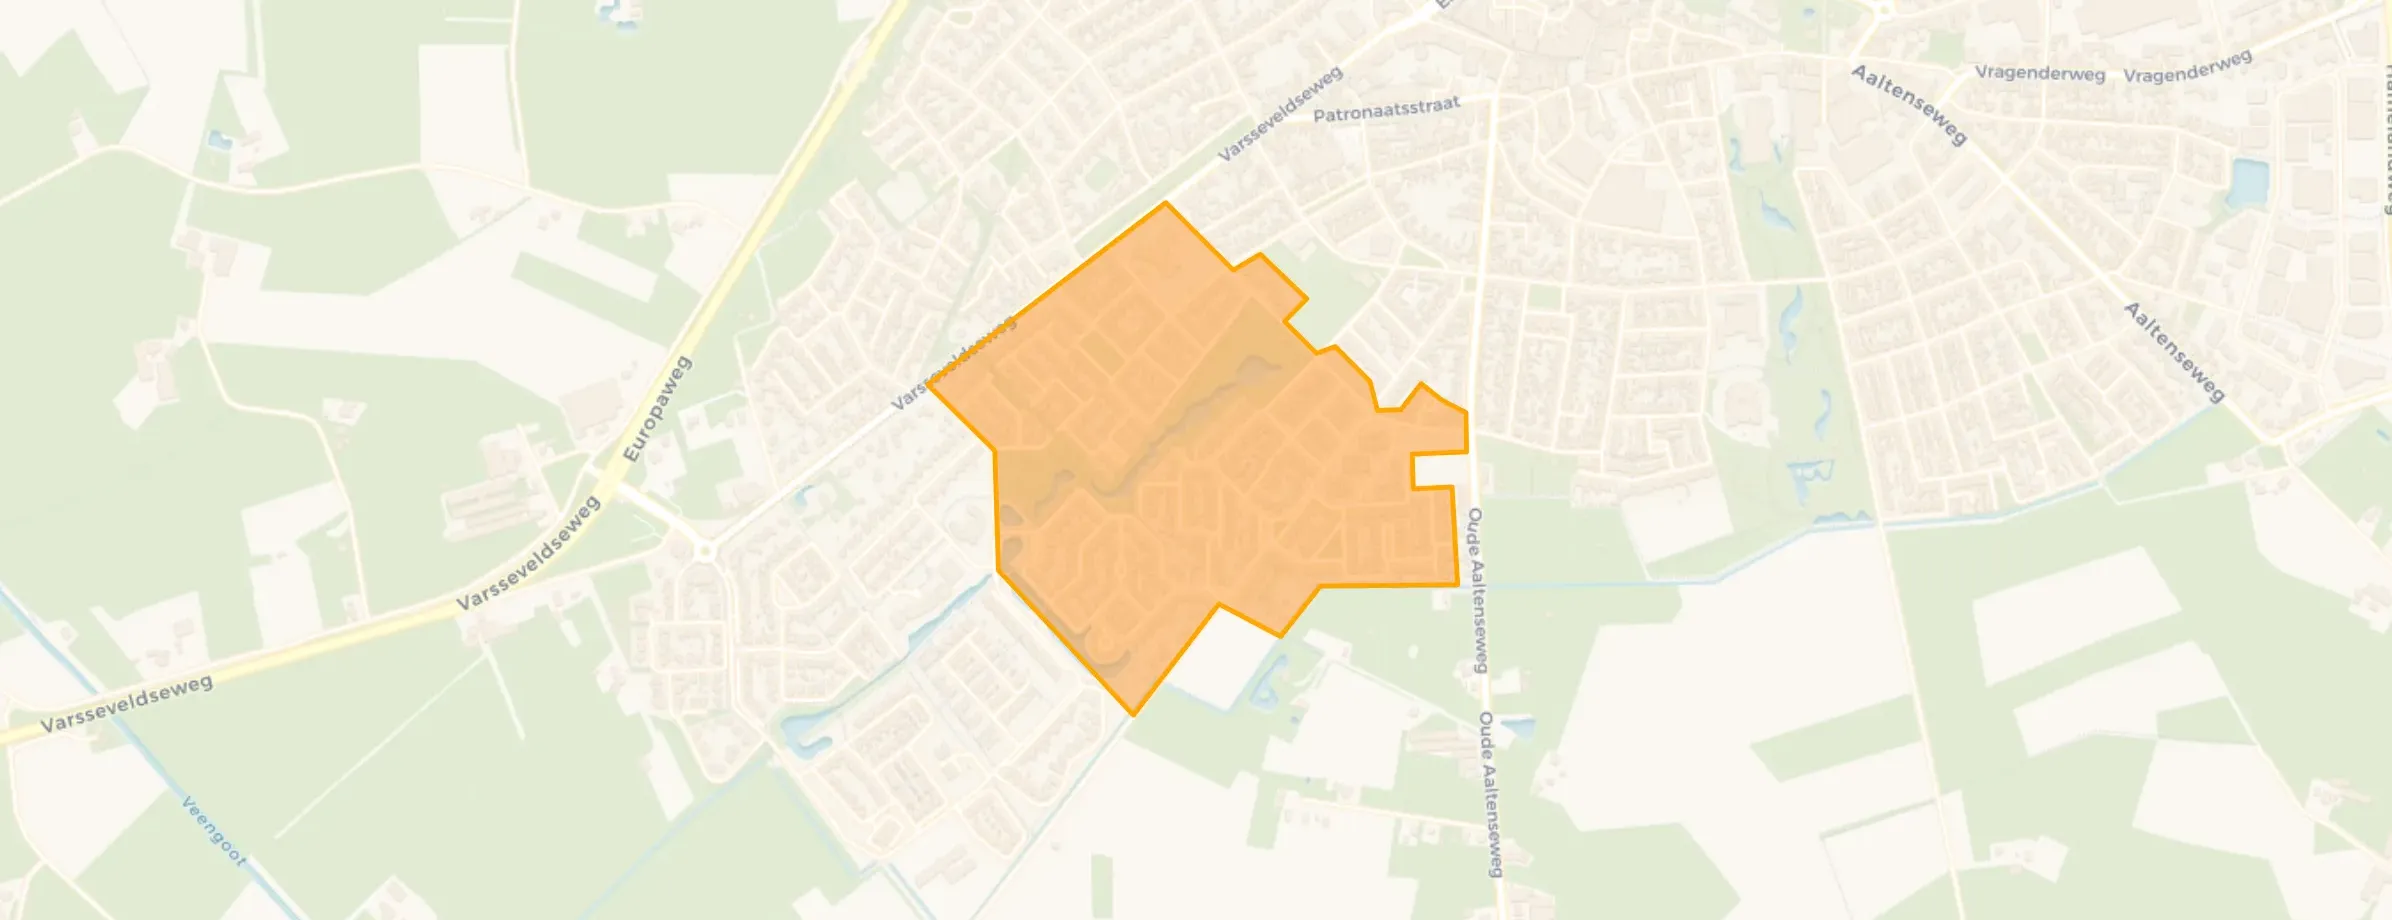
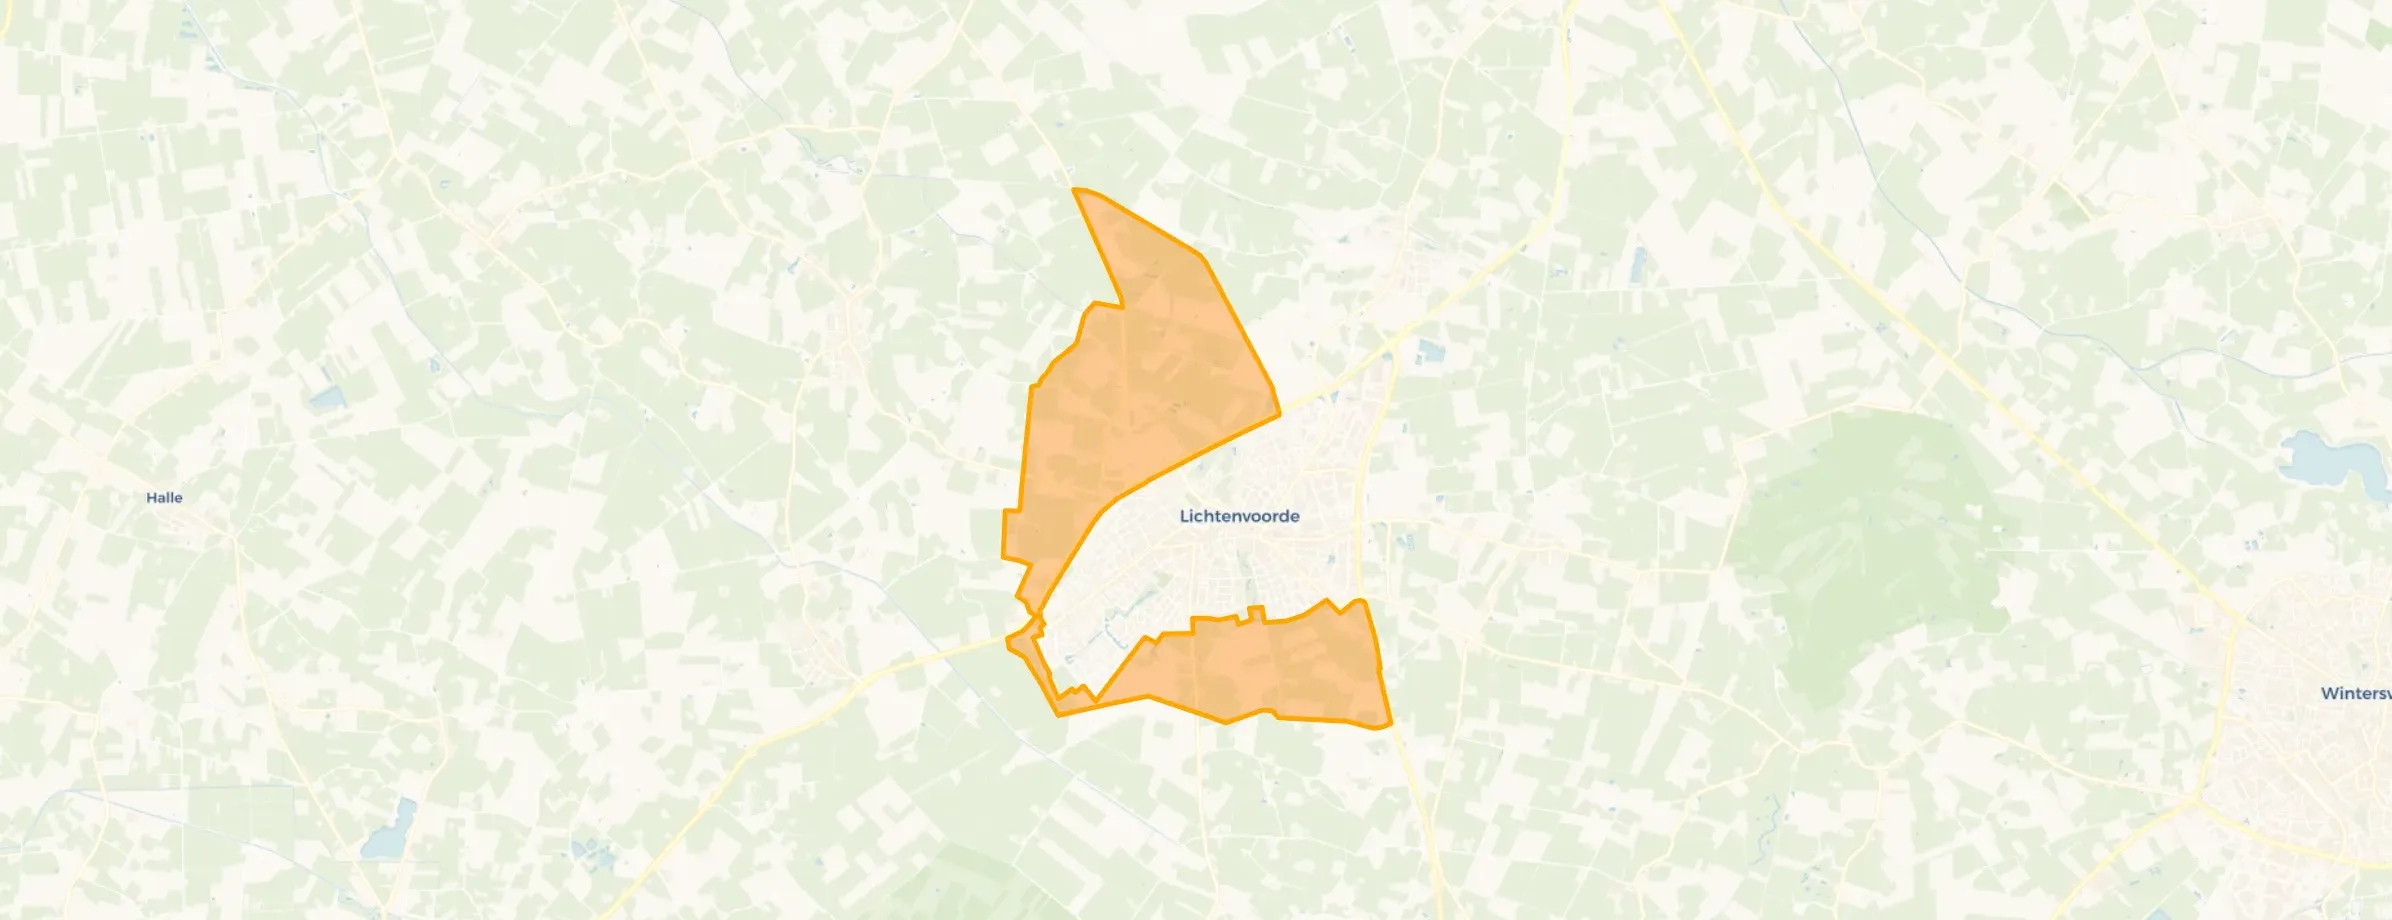
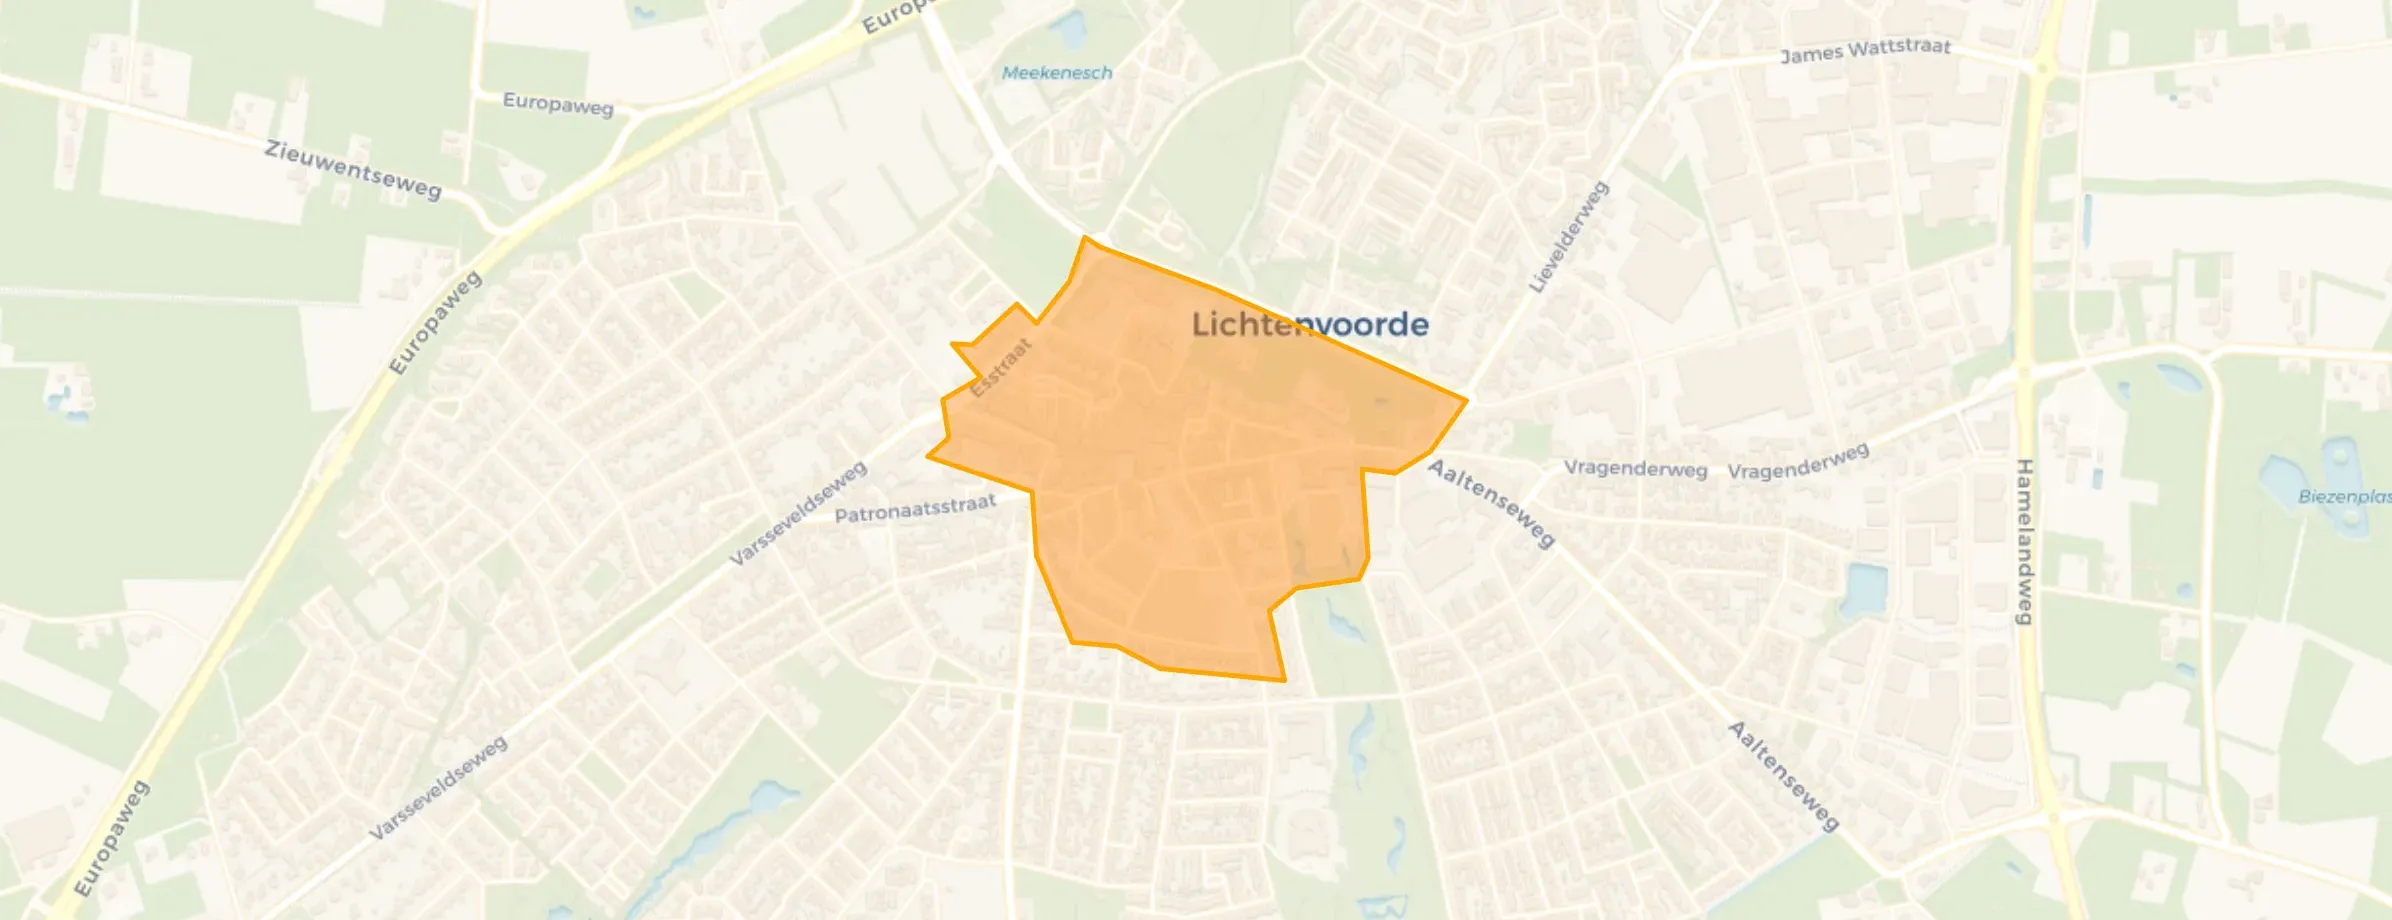
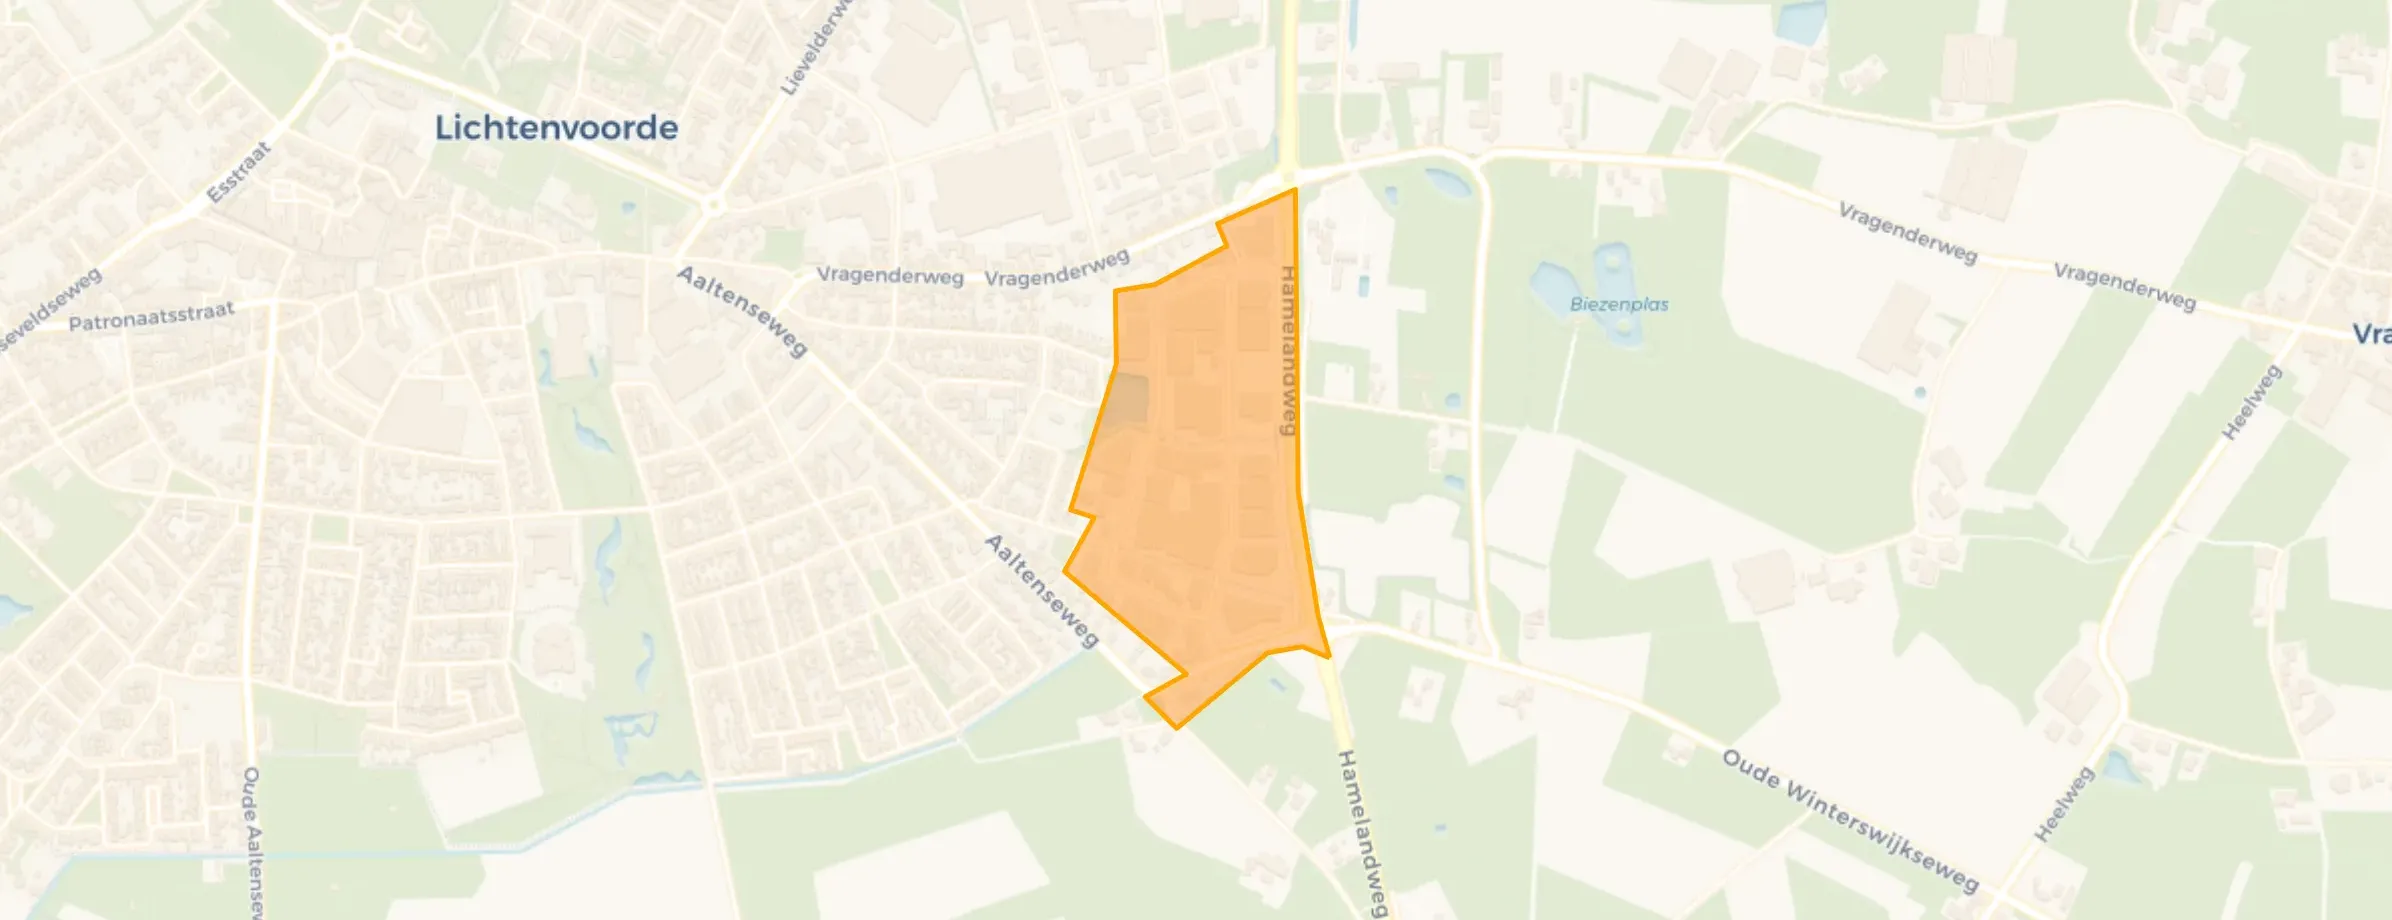
Of course! Lichtenvoorde in the province of Gelderland is truly a special place. It is a charming town with a rich history and a strong sense of community. The annual Zwarte Cross is one of the biggest events and attracts visitors from far and wide, always creating a vibrant atmosphere. The surroundings also offer beautiful nature, ideal for walking and cycling trips. It is truly a place where you can find peace, but also enjoy lively activities. A truly cosmic place to live!
Auto-translated to English by AIA pleasant and safe neighbourhood! Every time we've been on holiday, we look forward to coming back to our little neighbourhood! We're never leaving here! The only point for improvement is the schools in the area; primary schools are fine, but secondary school quality is mediocre... Family coming from further away can easily get here via easy roads and it's very easy to find! It's lovely to walk or run here through the beautiful nature and walking routes.
Auto-translated to English by AISometimes a bit rough but otherwise okay
Auto-translated to English by AII've lived here for 18 years and never really had any nuisance
Auto-translated to English by AIThe housing stock is mainly post-war — 61% was built between 1945 and 1990.
Over the past year a home for sale in Lichtenvoorde was listed for an average of €412,916 (€3,377 per m²). That is 20% below the Dutch national average. Last quarter prices fell by 7%.
Residents give Lichtenvoorde a 6.9 out of 10 based on 4 reviews. The strongest score is for nature and greenery (8.0), the weakest for education (5.3).
The housing supply in Lichtenvoorde is remarkably efficient: 50% has an A, A+ or B label. The average natural gas consumption per household is 890 m³ per year.
From Lichtenvoorde you can on average reach a supermarket at 0.9 km, a GP at 1.1 km, a railway station at 4.5 km, a primary school at 0.7 km (as the crow flies, source: CBS).
Right now you will find 78 homes for sale and 2 homes for rent in Lichtenvoorde.