Municipality in Noord-Holland
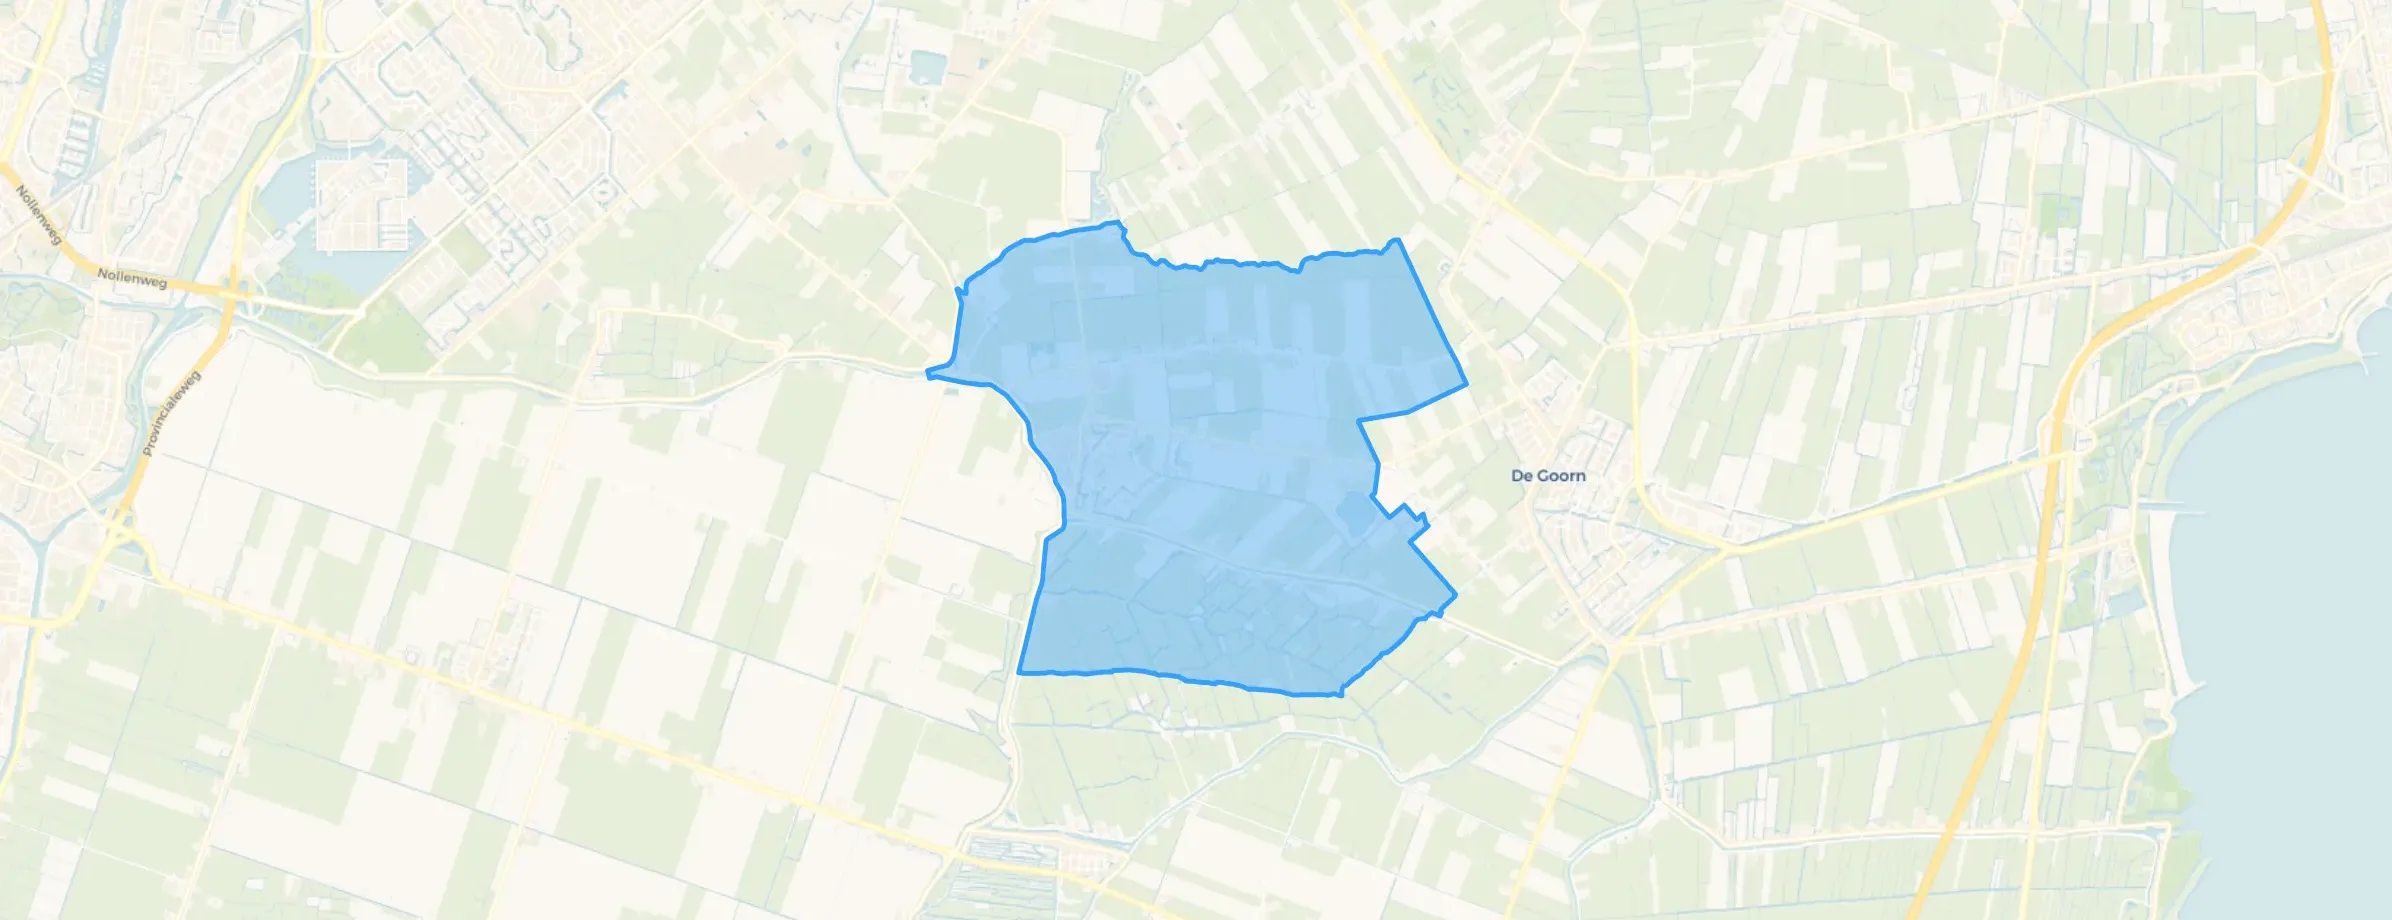
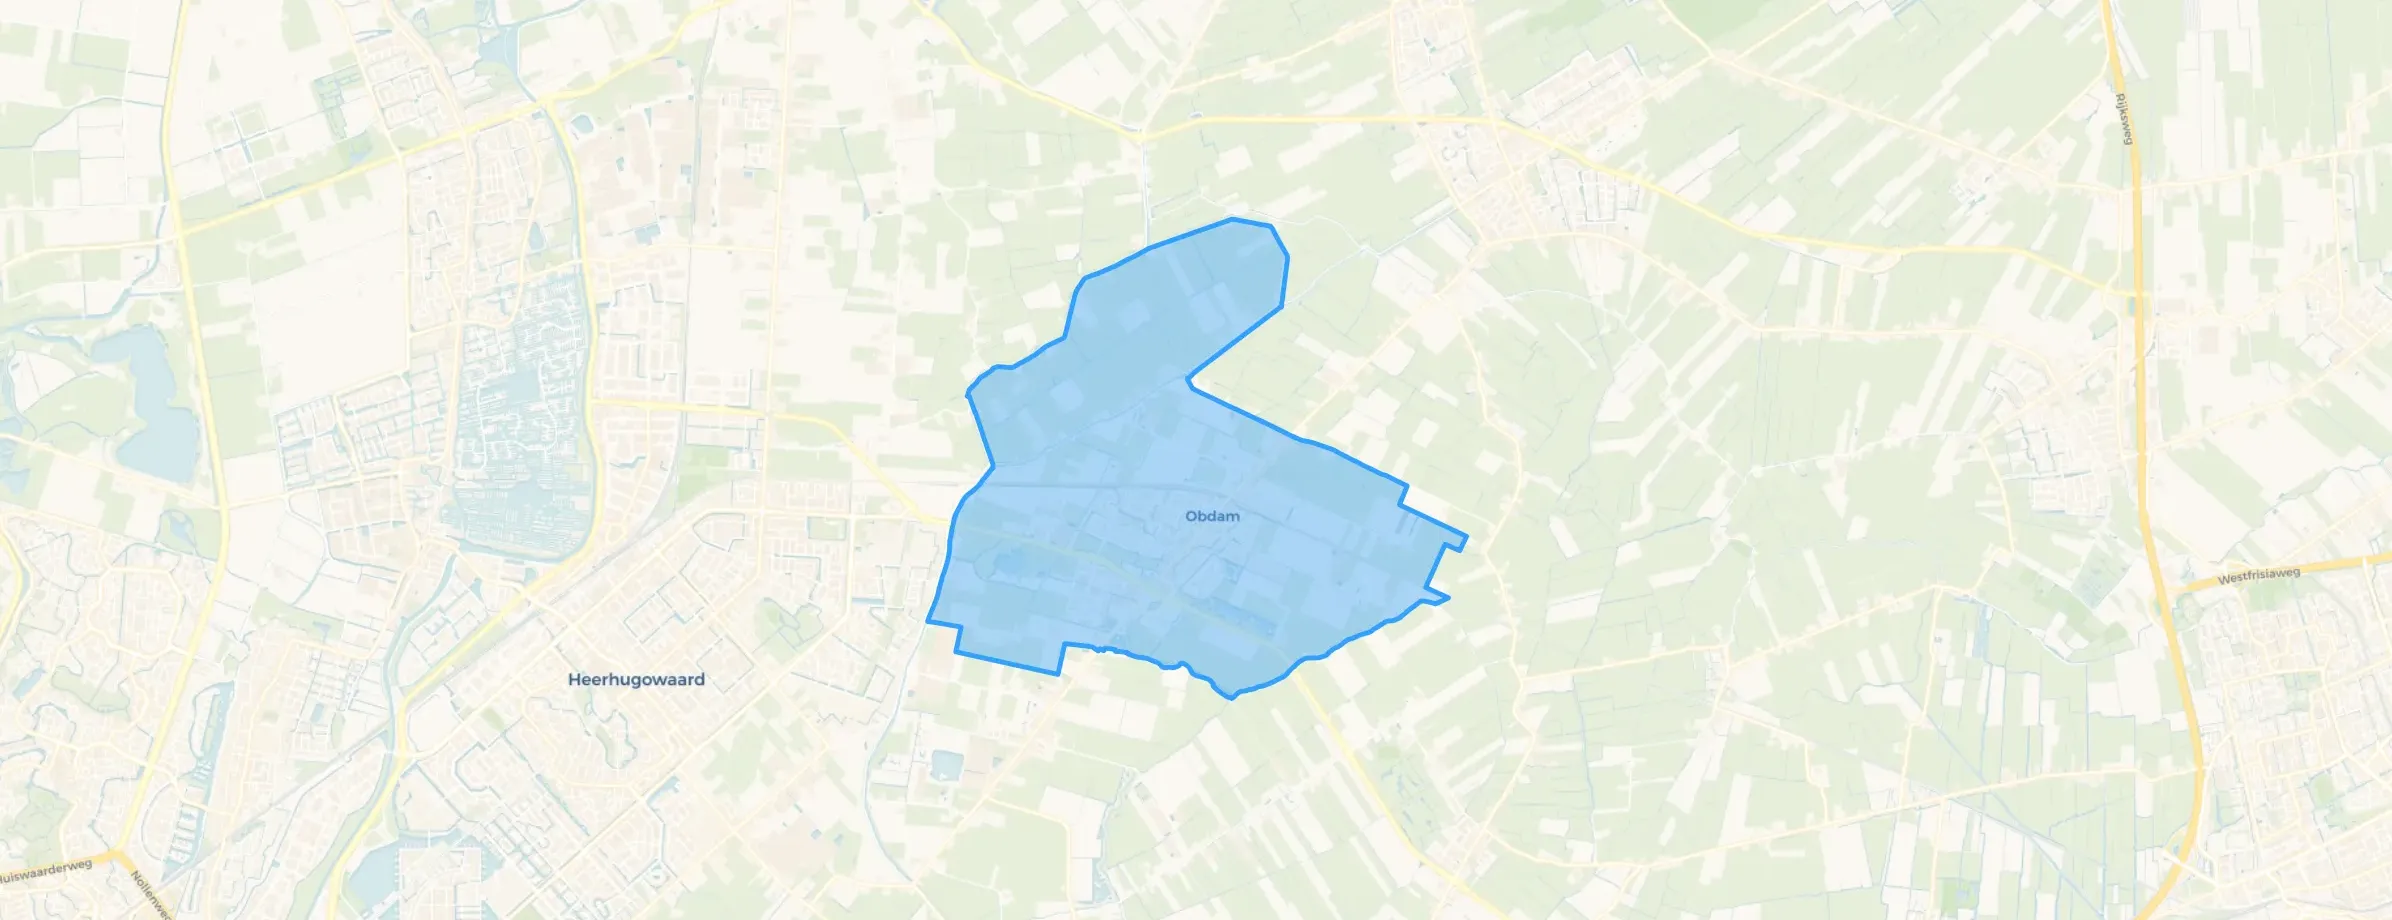
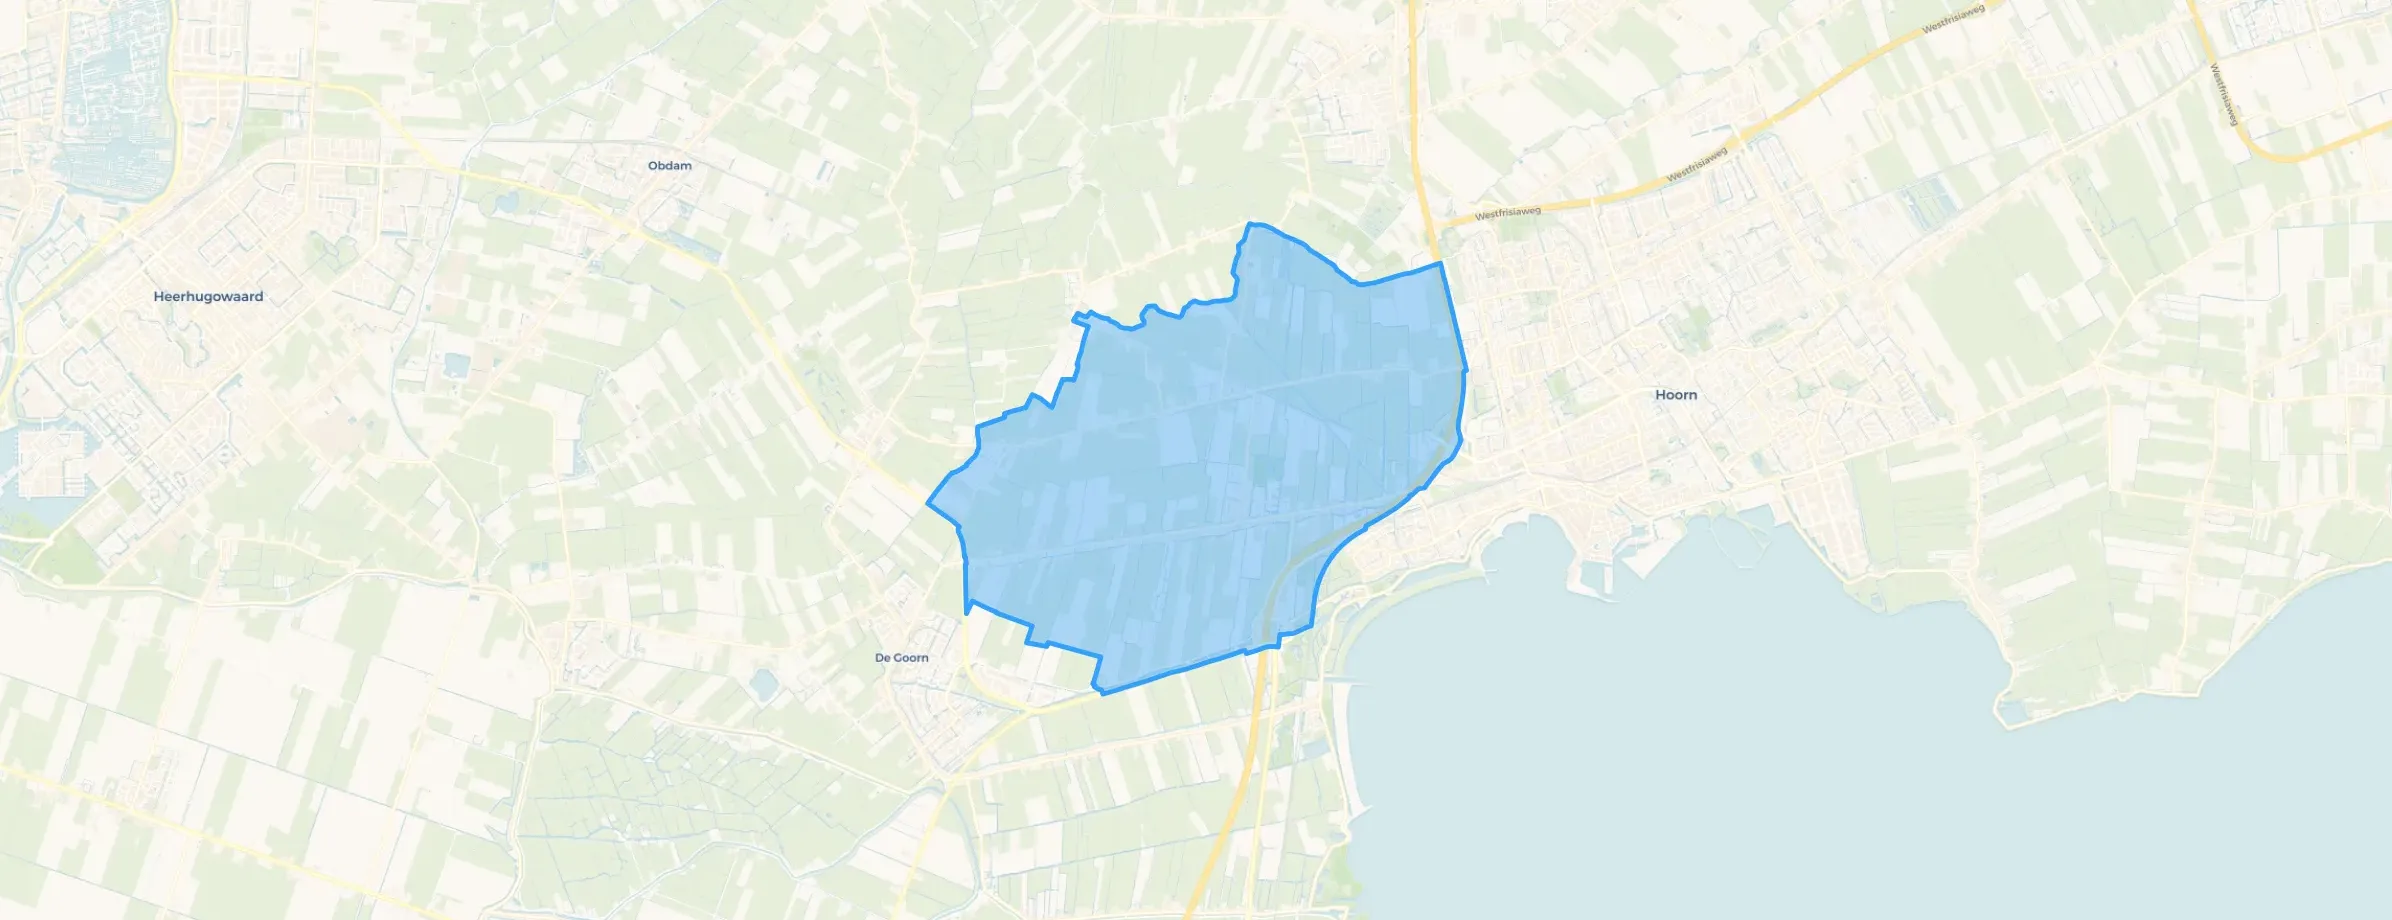
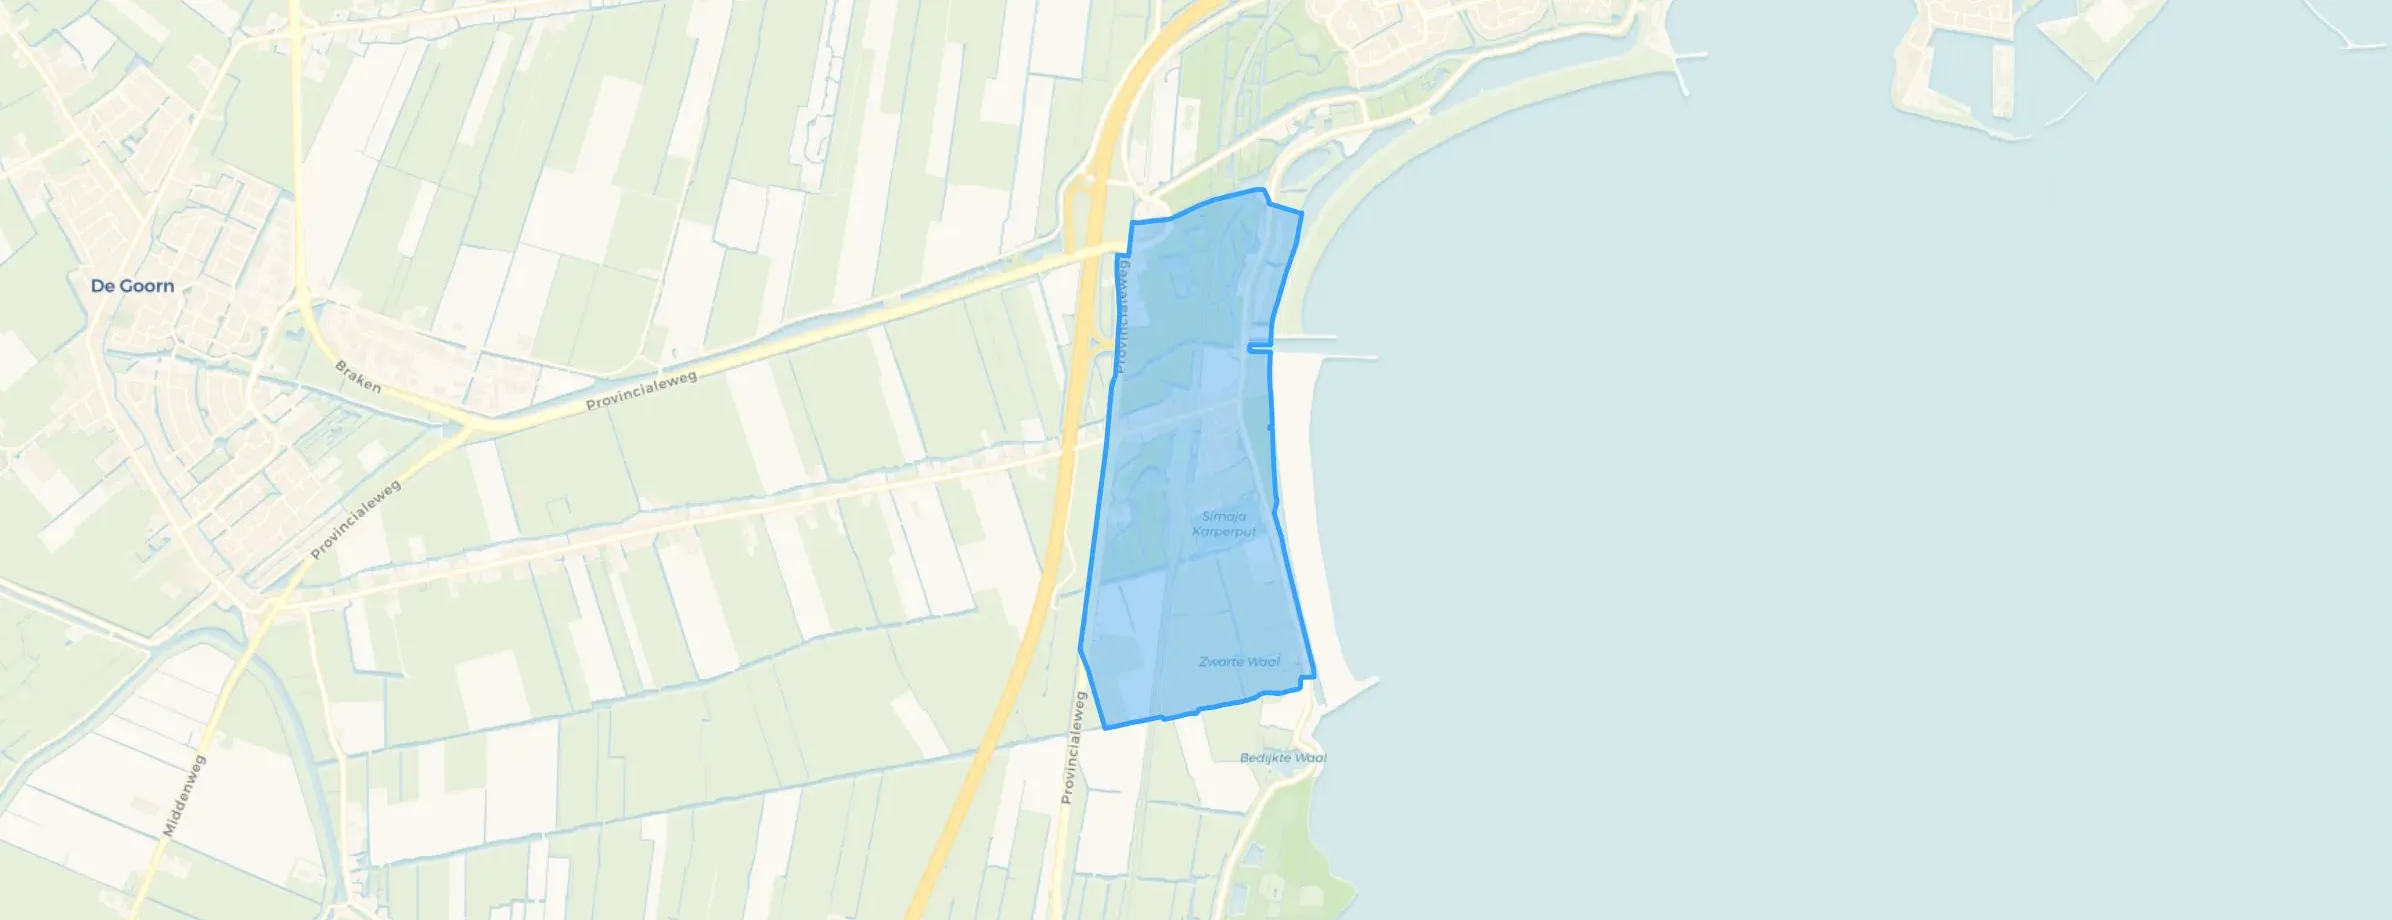
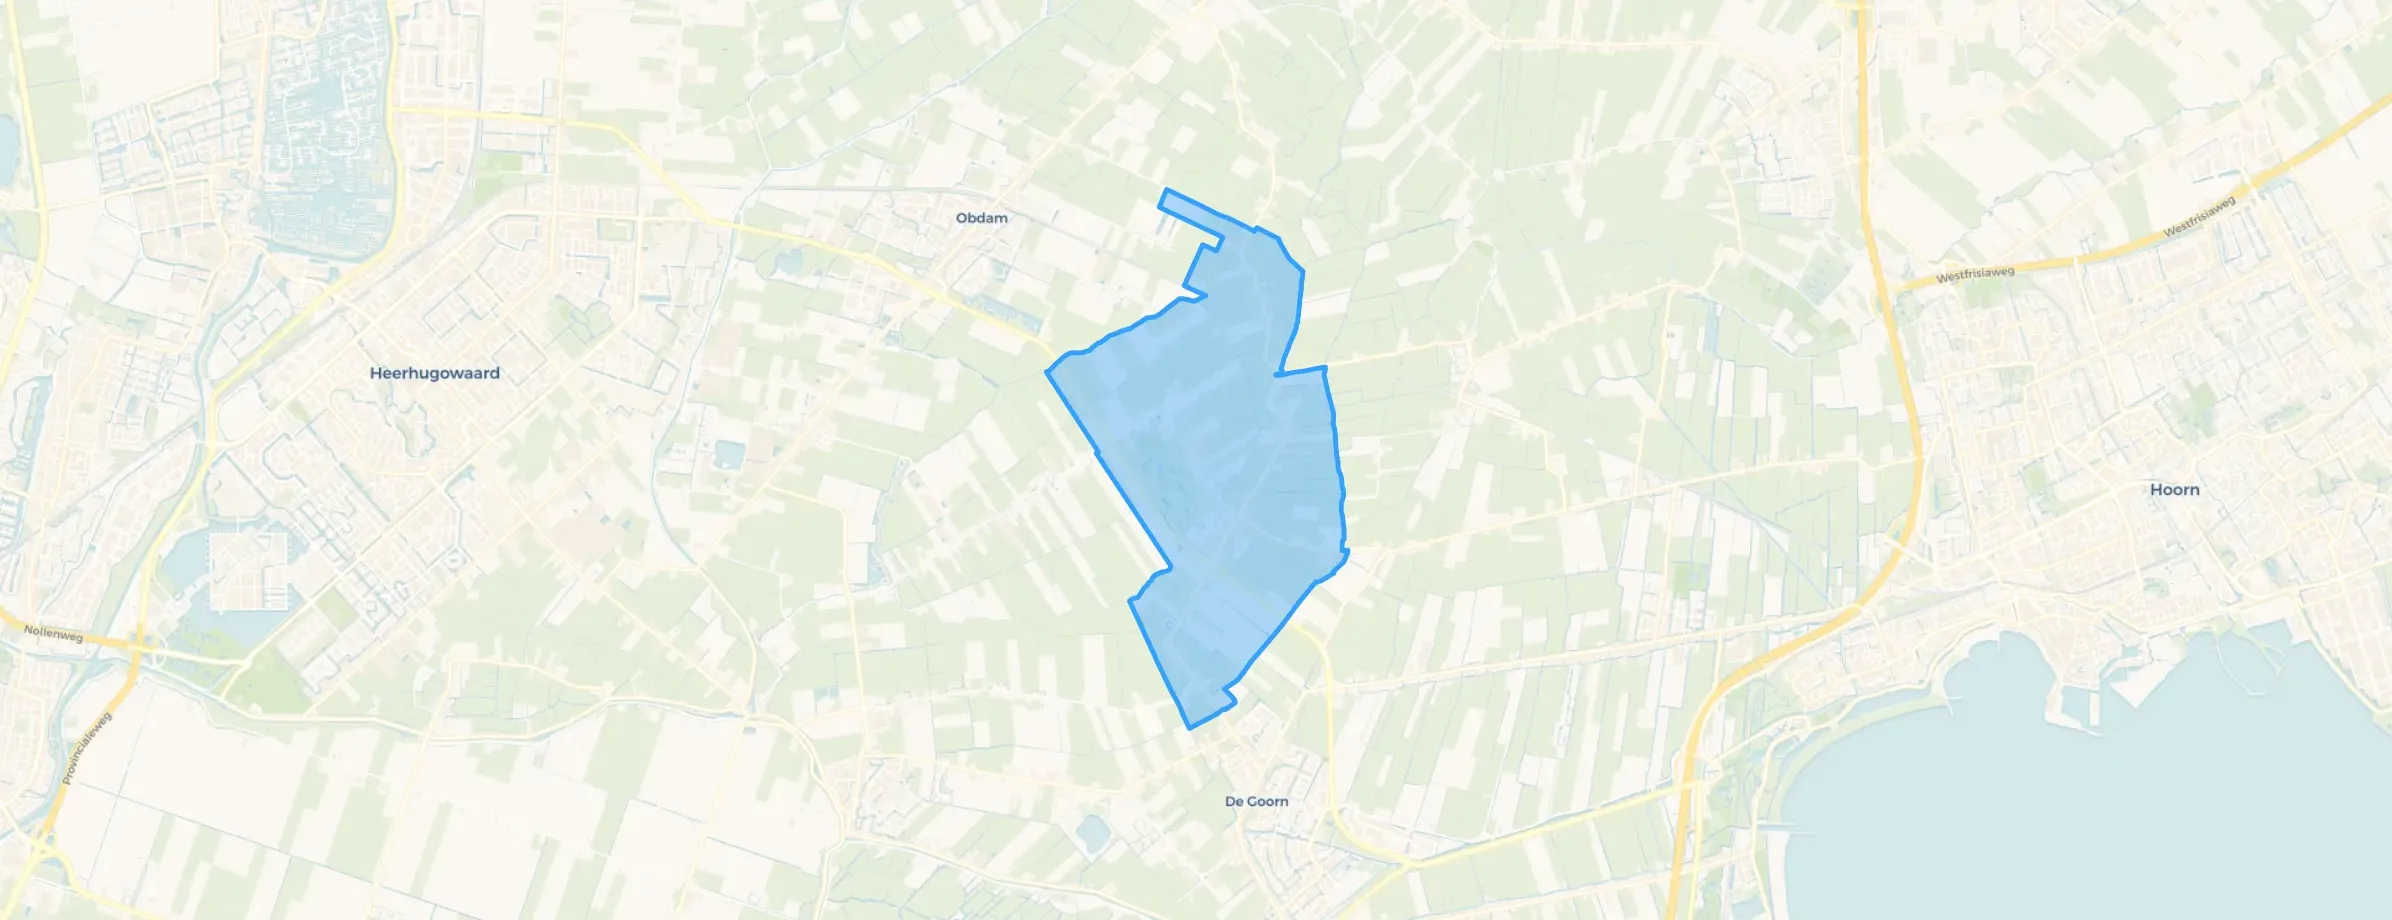
Koggenland is located in the province of Noord-Holland The municipality has a total area of 8.408 hectares, of which 8.026 hectares are land and 383 hectares are water. The municipality is coded as GM1598. The postcode area is 1631DB-1713XA.
Koggenland has 23.821 residents. Of these, 50,2% are men and 49,8% are women. Most residents are 45 to 65 years (27,7%). The other age groups are 22,4% for '65 years or older', 22,3% for '25 to 45 years', 15,3% for '0 to 15 years' and 12,2% for '15 to 25 years'. Of the residents, 47,3% is unmarried, 41,7% is married, 6,1% is divorced and 4,9% is widowed. 20.910 residents originate from the Netherlands, 1.366 come from Europe and 1.545 come from countries outside Europe.
There are 10.027 households in Koggenland. 31,0% of these are single-person households, 31,7% households without children and 37,3% households with children. The average household size is 2,3 persons. The national average is 2,1 persons.
In Koggenland there are 19.500 income recipients. The average income per income recipient is €40.700, which is €1.500 (4%) lower than the national average of €42.200. Per resident, the average income is €34.100, which is €800 (2%) lower than the national average of €34.900. Most residents of Koggenland are educated to an intermediate level. 48,7% have an intermediate education (HAVO, VWO or MBO 2-4), 25,7% have a university or higher professional education (HBO/WO) and 25,6% have a lower education (VMBO or MBO 1).
Of the 23.821 residents, around 77% are in paid employment, which amounts to 18.342 people. This is 5% higher than the national average of 72%. The majority of workers are in salaried employment (79%), while 21% are self-employed. In Koggenland, 26% of residents receive a benefit. The largest group is those receiving a state pension (AOW). 4.830 people receive this benefit.
In Koggenland there are 9.907 homes with an average assessed value (WOZ) of €416.000. Of these, around 97% are occupied and 3% unoccupied. Most homes are owner-occupied. This amounts to 21% rental homes and 79% owner-occupied homes. Of the homes, 79% privately owned, 5% owned by housing associations and 16% owned by other landlords. The most common construction periods in Koggenland are 1970-1980 (18%) and 2000-2010 (15%).
There are currently no homes for sale in Koggenland. The most recently listed home is Grutto 15 by KRK Makelaars. No homes were sold in Koggenland over the past year.
There are currently no homes for rent in Koggenland. The most recent home is Dorpsstraat 82B, offered by Haring Expat Housing Services op Vastgoed Nederland. No homes were let in Koggenland over the past year.
No recent rental data available for Koggenland.
In Koggenland there are 6.316 addresses with a registered energy label. The most common labels are A (31%), C (24%) and B (17%). On average, an address in Koggenland uses 2.920 kWh of electricity per year. This is 15% above the national average of 2.550 kWh. Natural gas consumption, at 900 m³ per year, is 13% above the national average of 800 m³.
Not much contact with the neighbours, but it's cosy, you have to do it yourself
Auto-translated to English by AIVery cosy with each other and we all help each other and we keep the neighbourhood clean together and that is very cosy together
Auto-translated to English by AIGreat
Auto-translated to English by AINice and good and cosy
Auto-translated to English by AIIt's a top neighbourhood
Auto-translated to English by AII experience the neighbourhood as very pleasant. Everyone is friendly, even though I don't know anyone. I sometimes find that a pity. Recently we had a market on the Dorpsstraat and then I felt very connected to my village. Events like that are very nice. By car, everything is just harder to reach than by bike. I also miss rubbish bins on the Dorpsstraat. You can hardly find any. That's why there is often litter on the pavement. Also, households should be encouraged more to install solar panels and remove as many paving stones as possible. Also, more charging points for electric cars should be installed in parking lots. Those are all tips to make it greener, but it's not that the neighbourhood is bad now.
Auto-translated to English by AIJust a fine place. Nice and quiet too. Only a shame that amenities are quite far away.
Auto-translated to English by AIIt's a very nice neighbourhood and everyone is friendly to you, lovely to live here
Auto-translated to English by AIOver the past year a home for sale in Koggenland was listed for an average of €482,331 (€3,830 per m²). Last quarter prices fell by 15%.
A rental home in Koggenland cost an average of €1,608 per month (€18 per m²). That is 26% below the national average.
Residents give Koggenland a 8.4 out of 10 based on 8 reviews. The strongest score is for accessibility (9.5), the weakest for education (6.9).
Gemeente Koggenland has 23,821 residents. Many families: 37% of the households have children.
The housing supply in Koggenland is remarkably efficient: 61% has an A, A+ or B label. The average natural gas consumption per household is 900 m³ per year.
From Koggenland you can on average reach a supermarket at 1.7 km, a GP at 1.3 km, a railway station at 5.3 km, a primary school at 0.8 km (as the crow flies, source: CBS).
Right now you will find 160 homes for sale and 11 homes for rent in Koggenland.