Give feedback Report a problem
Neighbourhood in Utrechtse HeuvelrugAmerongen-Dorp
8.6
Residents give Amerongen-Dorp a very good ratingThis score is based on 1 response
View
Amerongen-Dorp has 5,165 residentsMost are 65 years or older old
There are 2,462 homes in Amerongen-DorpCurrently there are 47 for sale and 1 for rent
Energy label A is the most common in Amerongen-DorpBased on registered homes

Amerongen-Dorp is located in the province of Utrecht, in the municipality of Utrechtse Heuvelrug, in the district Amerongen. The neighbourhood has a total area of 132 hectares, of which 128 hectares are land and 4 hectares are water. The neighbourhood is coded as BU15810300. The postcode area is 3958BA-3958XZ.

One resident rates the neighbourhood as very good with a score of 8.6. The resident describes this neighbourhood as 'Nice cosy neighbourhood'. Based on a limited number of reviews, no clear trends are visible yet in this neighbourhood.

Residents

Amerongen-Dorp has 5.165 residents. Of these, 48,6% are men and 51,3% are women. Most residents are 65 years or older (28,4%). The other age groups are 27,9% for '45 to 65 years', 20,0% for '25 to 45 years', 14,0% for '0 to 15 years' and 9,6% for '15 to 25 years'. Of the residents, 40,5% is unmarried, 44,5% is married, 7,3% is divorced and 7,7% is widowed. 4.345 residents originate from the Netherlands, 295 come from Europe and 530 come from countries outside Europe.

There are 2.275 households in Amerongen-Dorp. 33,2% of these are single-person households, 34,3% households without children and 32,5% households with children. The average household size is 2,2 persons. The national average is 2,1 persons.

In Amerongen-Dorp there are 4.100 income recipients. The average income per income recipient is €44.100, which is €1.900 (5%) higher than the national average of €42.200. Per resident, the average income is €36.800, which is €1.900 (5%) higher than the national average of €34.900. Most residents of Amerongen-Dorp are educated to an intermediate level. 38,3% have an intermediate education (HAVO, VWO or MBO 2-4), 37,2% have a university or higher professional education (HBO/WO) and 24,5% have a lower education (VMBO or MBO 1).

Of the 5.165 residents, around 73% are in paid employment, which amounts to 3.770 people. This is 1% higher than the national average of 72%. The majority of workers are in salaried employment (81%), while 19% are self-employed. In Amerongen-Dorp, 32% of residents receive a benefit. The largest group is those receiving a state pension (AOW). 1.320 people receive this benefit.

Housing

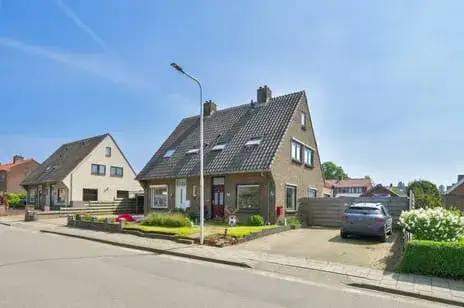
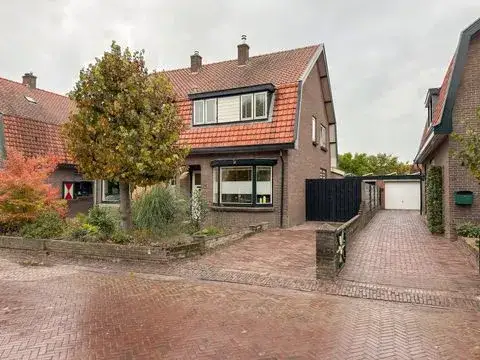
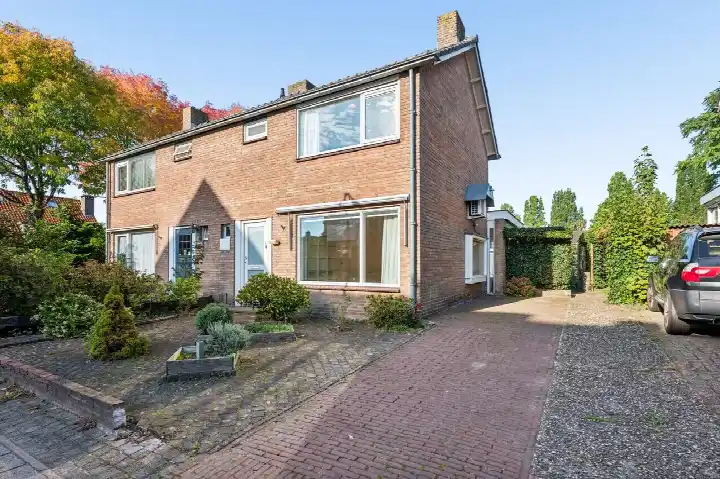
In Amerongen-Dorp there are 2.462 homes with an average assessed value (WOZ) of €441.000. Of these, around 95% are occupied and 5% unoccupied. Most homes are owner-occupied. This amounts to 36% rental homes and 64% owner-occupied homes. Of the homes, 64% privately owned, 28% owned by housing associations and 8% owned by other landlords. The most common construction periods in Amerongen-Dorp are 1950-1970 (25%) and 1970-1980 (19%).

Homes for sale in Amerongen-Dorp

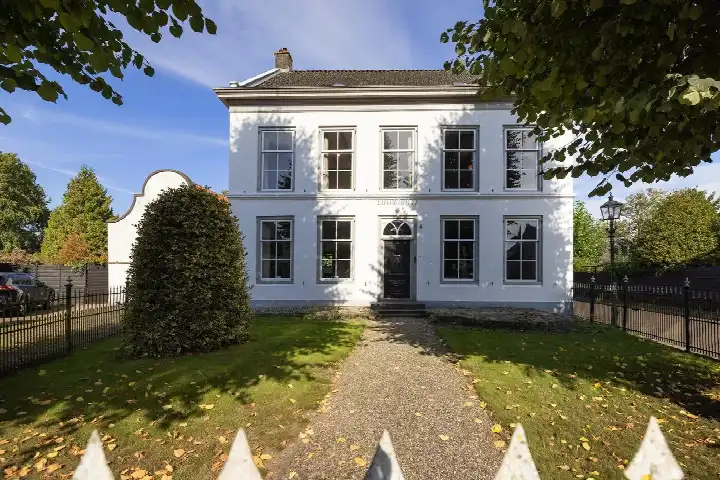
There are currently 47 homes for sale in Amerongen-Dorp. The most recently listed home is Utrechtsestraatweg 48 by Makelaardij de Terp. Over the past year, 83 homes were sold in Amerongen-Dorp. On average, a home was sold within 55 days.

The average asking price for a home for sale in Amerongen-Dorp over the past year was €647.723. This is 47% higher than the average assessed value (WOZ) of €441.000. The average asking price per m² of floor area is €4.608.

Rental homes in Amerongen-Dorp

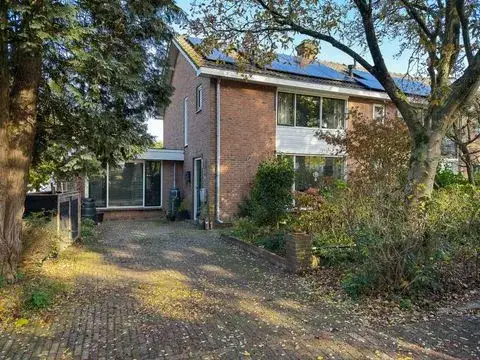
There is 1 homes for rent in Amerongen-Dorp. The most recent home is Prins Bernhardlaan 39, offered by Van Loon Makelaardij op Funda. Over the past year, 3 homes were let in Amerongen-Dorp. On average, a listing was let within 59 days.

The average rent for a rental home in Amerongen-Dorp over the past year was €1.600 per month. Per m² of floor area that is €16 per month.

Energy

In Amerongen-Dorp there are 1.546 addresses with a registered energy label. The most common labels are C (36%), B (18%) and A (18%). On average, an address in Amerongen-Dorp uses 2.730 kWh of electricity per year. This is 7% above the national average of 2.550 kWh. Natural gas consumption, at 960 m³ per year, is 20% above the national average of 800 m³.

Street names

  • Drostestraat
  • Aspergelaan
  • Willem de Zwijgerlaan
  • Hul
  • Prinses Christinastraat
  • Overstraat
  • Prins Clauslaan
  • Allemanswaard
  • Schapendrift zuid
  • Molenbrink
  • de Breelaan
  • Het engelse werk
  • Gasthuisstraat
  • Bertus Leendersweg
  • Korenland
  • Jan van Zutphenweg
  • Industrieweg zuid
  • Utrechtsestraatweg
  • De Tol
  • de Kievit
  • Dwarsakkers
  • Nederstraat
  • Jachtlaan
  • de Del
  • Nassaulaan
  • Industrieweg
  • de Reehorst
  • Prinses Margrietstraat
  • Tabaksteelrotonde
  • Rijksstraatweg
  • Dominee Keppellaan
  • Prinses Irenelaan
  • Erica
  • Bessenland
  • Bentinckhof
  • van Reede Ginckellaan
  • Koningin Julianalaan
  • Burgemeester W Martenslaan
  • Oranjelaan
  • Schapendrift noord
  • Dooiweg
  • Molenstraat
  • Kerkeland
  • Zandgoed
  • Vossenhol
  • de Hank
  • de Klamp
  • Schoolstraat
  • Prins Willem Alexanderlaan
  • Prins Hendriklaan
  • Domineessteek
  • Kerksteeg
  • In de west
  • Koningin Emmalaan
  • Boslaan
  • Holleweg
  • Koningin Wilhelminaweg
  • Stenderland
  • Donkerstraat
  • Kersweg
  • Burgemeester W E van Weedelaan
  • De Oude Wei
  • Margaretha Turnorstraat
  • Prins Bernhardlaan
  • de Spijlen
  • Koenestraat
  • Imkerlaan
  • Prinses Beatrixlaan
  • Hof
  • Hazeleger
  • Schoolsteeg
  • Zandvoort
  • Tabakslaan
  • Cliftwijck
  • Burgemeester van den Boschstraat
  • Industrieweg noord
  • Imminkstraat
  • Dorpshuisplein
  • Royenstein
  • Menorapad
  • Rijnstraat
  • Majoorsweg
  • de Postmeester
  • Burgemeester H Spruytlaan
  • Wildbaan

Amenities

GP
0,6 km
Pharmacy
2,7 km
Hospital
8,6 km
Supermarket
0,6 km
Railway station
7,8 km
Day nursery
0,5 km
Primary school
0,5 km
Secondary school
6,5 km
Rate Amerongen-Dorp

Share your opinion and help improve the neighbourhood.

  • Takes less than 2 minutes
  • Help home seekers
  • Improve your neighbourhood
Write a review
8.6
Residents give Amerongen-Dorp a very good rating
This score is based on 1 response
Join the conversation
Safety
Housing
Cleanliness
Amenities
Education
Community
Greenery
Accessibility

Experiences of Amerongen-Dorp

Join the conversation
8.6
Aukje
Gezin · twee-onder-een-kap
15-10-2023
Nice cosy neighbourhood

I experience it as a safe neighbourhood. It's nice to grow up here. Playing in the street and nice neighbours

Auto-translated to English by AI

Statistics about the residents

Ages

Residents per age category

Household composition

Households per category
755Single-person households
780Households without children
740Households with children

Gender

Residents by gender
Men
Women

Marital status

Residents by marital status
Married
Unmarried
Divorced
Widowed

Origin

Residents per category of origin
Netherlands
Europe
Outside Europe

Work & income

Labour participation and average income
€36,800 P.A.average per resident5% above the national average
€44,100 P.A.average per income recipient5% above the national average
81%of the employed are in paid employment
19%of the employed are self-employed
73%
of the residents are employed
72%
is the national average

Education level

Residents per education level
VMBO, MBO 1
HAVO/VWO, MBO 2-4
HBO/WO

Wealth

Median wealth per household
Amerongen-Dorp
Netherlands

Benefits

Residents per benefit type
Social assistance
Disability
Unemployment

Housing market in Amerongen-Dorp

Sale price · Q4 2026
€557.643
average▼ 25,9%
€462.000
median▼ 27,6%
14 sales · vs. Q3 2026
€/m² for sale · Q4 2026
€4.556
average▼ 5,2%
€4.601
median▼ 7,9%
+24% vs. national average

Price trend for sale

Sale price per quarter · Q4 '25 – Q4 '26
Average
Median

Sales market

Market speed and dynamics, last 12 months
55 days ▼ 44,2%
average time listed · vs. last year
83
sales in the past year
147 m²
average living area
+24%
more expensive than the national average

Year built

Age of the housing stock

Energy labels

Sustainability of the housing stock

Living area

Distribution of home sizes

Statistics about the homes

Home types

Addresses per home type

Construction periods

Addresses per construction period

Labels

Addresses per energy label

Energy consumption

Average per address, compared with the Netherlands
Natural gas (m³)
Amerongen-Dorp
960
Netherlands
800
Electricity (kWh)
Amerongen-Dorp
2.730
Netherlands
2.550

Frequently asked questions about Amerongen-Dorp

What kind of homes are there in Amerongen-Dorp?

The housing stock is mainly post-war — 68% was built between 1945 and 1990.

What do you pay for a house in Amerongen-Dorp?

Over the past year a home for sale in Amerongen-Dorp was listed for an average of €647,723 (€4,608 per m²). That is 24% above the Dutch national average. Last quarter prices fell by 26%.

How far are amenities from Amerongen-Dorp?

From Amerongen-Dorp you can on average reach a supermarket at 0.6 km, a GP at 0.6 km, a railway station at 7.8 km, a primary school at 0.5 km (as the crow flies, source: CBS).

How many homes are currently for sale in Amerongen-Dorp?

Right now you will find 47 homes for sale and 1 homes for rent in Amerongen-Dorp.

Homes Rate your neighbourhood
Buurtje.nl
Buurtje.nl in the appSearch faster and respond first
Open