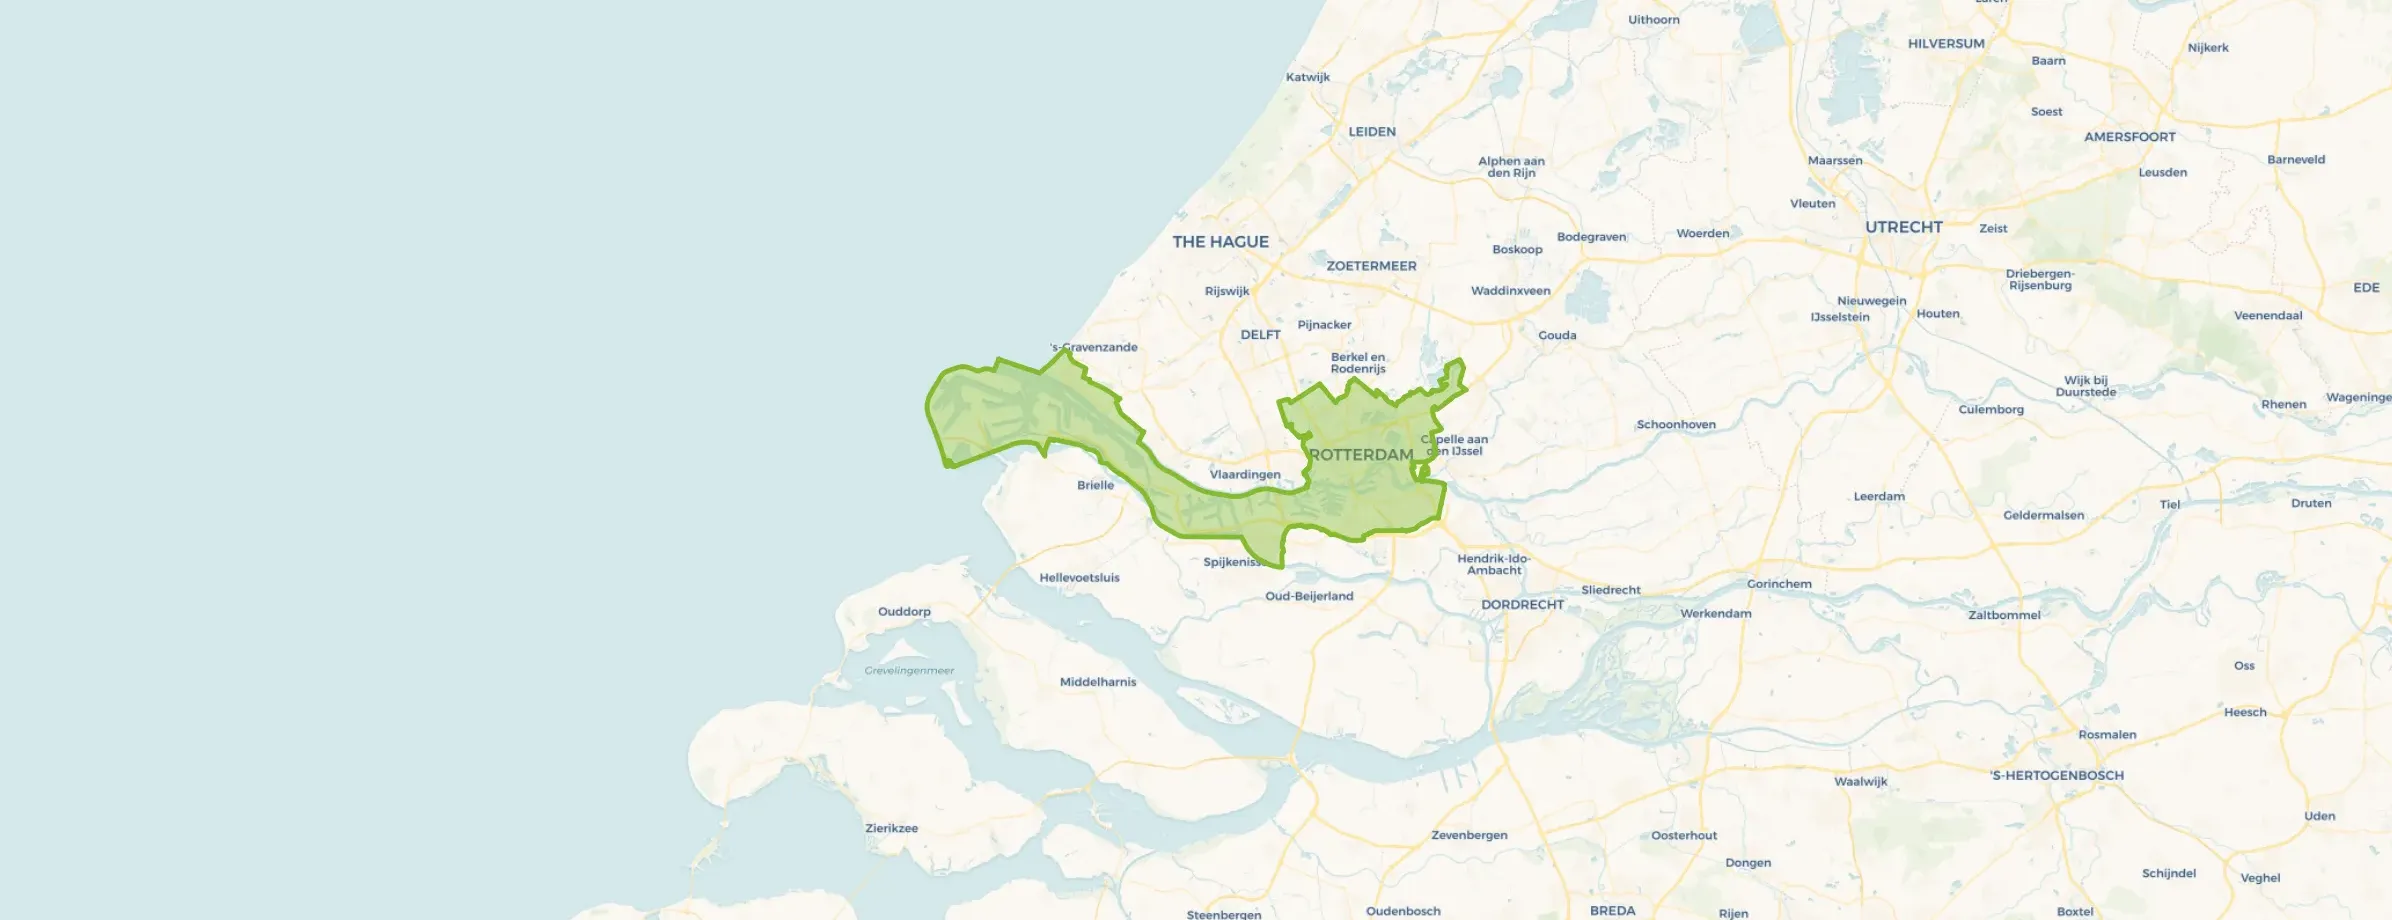
Geertruidenberg-Kom is located in the province of Noord-Brabant, in the municipality of Geertruidenberg, in the district Geertruidenberg. The neighbourhood has a total area of 67 hectares, of which 56 hectares are land and 11 hectares are water. The neighbourhood is coded as BU07790200. The postcode area is 4931AD-4931NK.
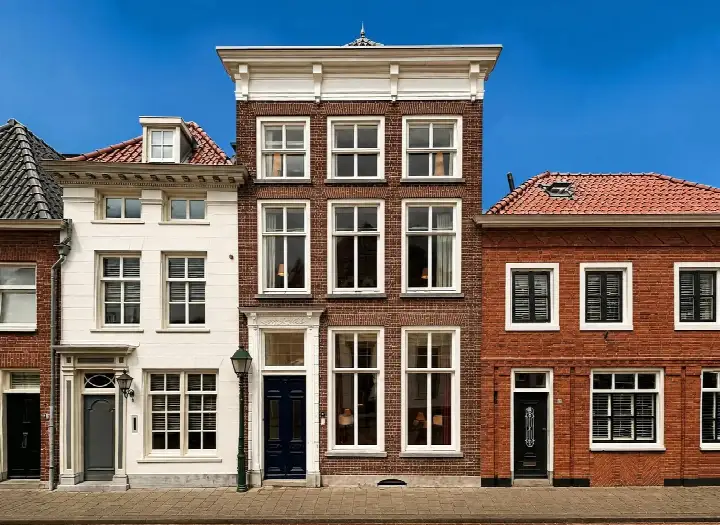
Two residents rate the neighbourhood as very good with a score of 8.2. They describe it as 'Beautiful old street with a mix of young and old.' and 'Cosy'. Based on a limited number of reviews, no clear trends are visible yet in this neighbourhood.
Geertruidenberg-Kom has 2.985 residents. Of these, 49,2% are men and 50,8% are women. Most residents are 45 to 65 years (28,0%). The other age groups are 26,5% for '65 years or older', 21,9% for '25 to 45 years', 13,2% for '0 to 15 years' and 10,2% for '15 to 25 years'. Of the residents, 43,2% is unmarried, 38,4% is married, 10,1% is divorced and 8,4% is widowed. 2.625 residents originate from the Netherlands, 160 come from Europe and 200 come from countries outside Europe.
There are 1.405 households in Geertruidenberg-Kom. 38,1% of these are single-person households, 32,7% households without children and 29,2% households with children. The average household size is 2,1 persons. The national average is 2,1 persons.
In Geertruidenberg-Kom there are 2.500 income recipients. The average income per income recipient is €39.500, which is €2.700 (6%) lower than the national average of €42.200. Per resident, the average income is €35.400, which is €500 (1%) higher than the national average of €34.900. Most residents of Geertruidenberg-Kom are educated to an intermediate level. 40,5% have an intermediate education (HAVO, VWO or MBO 2-4), 33,0% have a lower education (VMBO or MBO 1) and 26,5% have a university or higher professional education (HBO/WO).
Of the 2.985 residents, around 75% are in paid employment, which amounts to 2.239 people. This is 3% higher than the national average of 72%. The majority of workers are in salaried employment (84%), while 16% are self-employed. In Geertruidenberg-Kom, 31% of residents receive a benefit. The largest group is those receiving a state pension (AOW). 720 people receive this benefit.
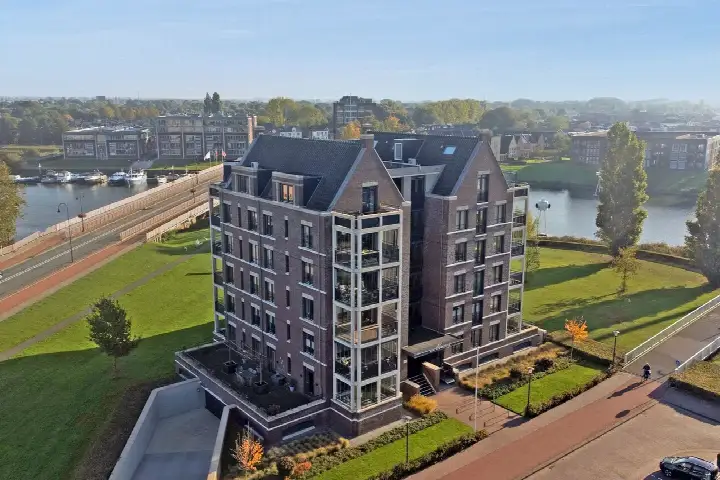
In Geertruidenberg-Kom there are 1.568 homes with an average assessed value (WOZ) of €348.000. Of these, around 90% are occupied and 10% unoccupied. Most homes are owner-occupied. This amounts to 43% rental homes and 57% owner-occupied homes. Of the homes, 56% privately owned, 28% owned by housing associations and 16% owned by other landlords. The most common construction periods in Geertruidenberg-Kom are 1990-2000 (23%) and 2000-2010 (17%).
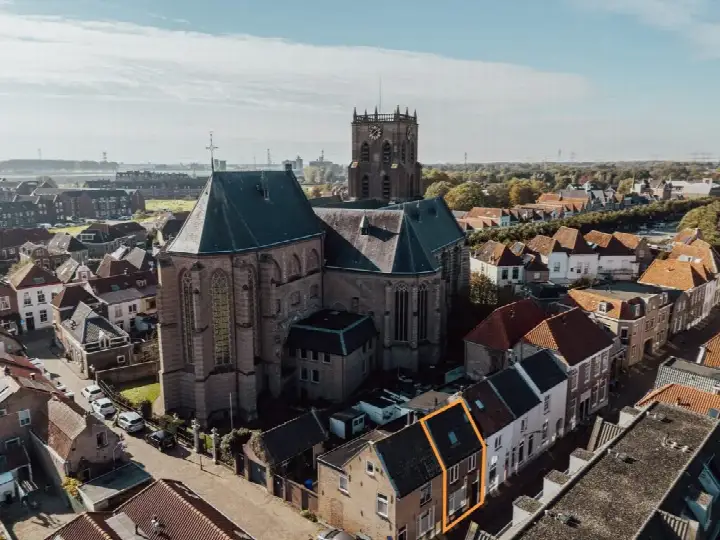
There are currently 28 homes for sale in Geertruidenberg-Kom. The most recently listed home is Havendijkstraat 9 by Mol & Roubos Makelaardij op Funda. Over the past year, 45 homes were sold in Geertruidenberg-Kom. On average, a home was sold within 84 days.
The average asking price for a home for sale in Geertruidenberg-Kom over the past year was €591.900. This is 70% higher than the average assessed value (WOZ) of €348.000. The average asking price per m² of floor area is €3.638.
There are currently no homes for rent in Geertruidenberg-Kom. The most recent home is Bergse Poort 29, offered by www.klikvoorwonen.nl. Over the past year, 2 homes were let in Geertruidenberg-Kom. On average, a listing was let within 36 days.
The average rent for a rental home in Geertruidenberg-Kom over the past year was €1.950 per month. Per m² of floor area that is €14 per month.
In Geertruidenberg-Kom there are 1.047 addresses with a registered energy label. The most common labels are A (37%), B (21%) and C (10%). On average, an address in Geertruidenberg-Kom uses 2.400 kWh of electricity per year. This is 6% below the national average of 2.550 kWh. With an annual consumption of 730 m³ per address, natural gas consumption is 9% below the national average of 800 m³.
We know most of the people who live in our neighbourhood. We greet each other when we meet. During festivities, almost all of us are present. The beautiful market with its stately houses and the large square are very cosy when the terraces are set out in summer. We have many activities for outsiders too. And the Biesbosch is nearby. In short, I love my little town.
Auto-translated to English by AIDownside, other cities/villages are hard to reach if you don't have a car. Plus point, it's a safe village and almost everyone knows each other
Auto-translated to English by AIThe housing stock is relatively young — 57% dates from after 1990.
Over the past year a home for sale in Geertruidenberg-Kom was listed for an average of €591,900 (€3,638 per m²). That is 13% above the Dutch national average. Last quarter prices rose by 19%.
The housing supply in Geertruidenberg-Kom is remarkably efficient: 68% has an A, A+ or B label. The average natural gas consumption per household is 730 m³ per year.
From Geertruidenberg-Kom you can on average reach a supermarket at 1.1 km, a GP at 0.5 km, a railway station at 16.8 km, a primary school at 0.6 km (as the crow flies, source: CBS).
Right now you will find 28 homes for sale in Geertruidenberg-Kom. A home for sale here is listed for an average of 83 days — relatively long for the current market.